Academic Profile
Statistics
Similar Authors
Papers on arXiv
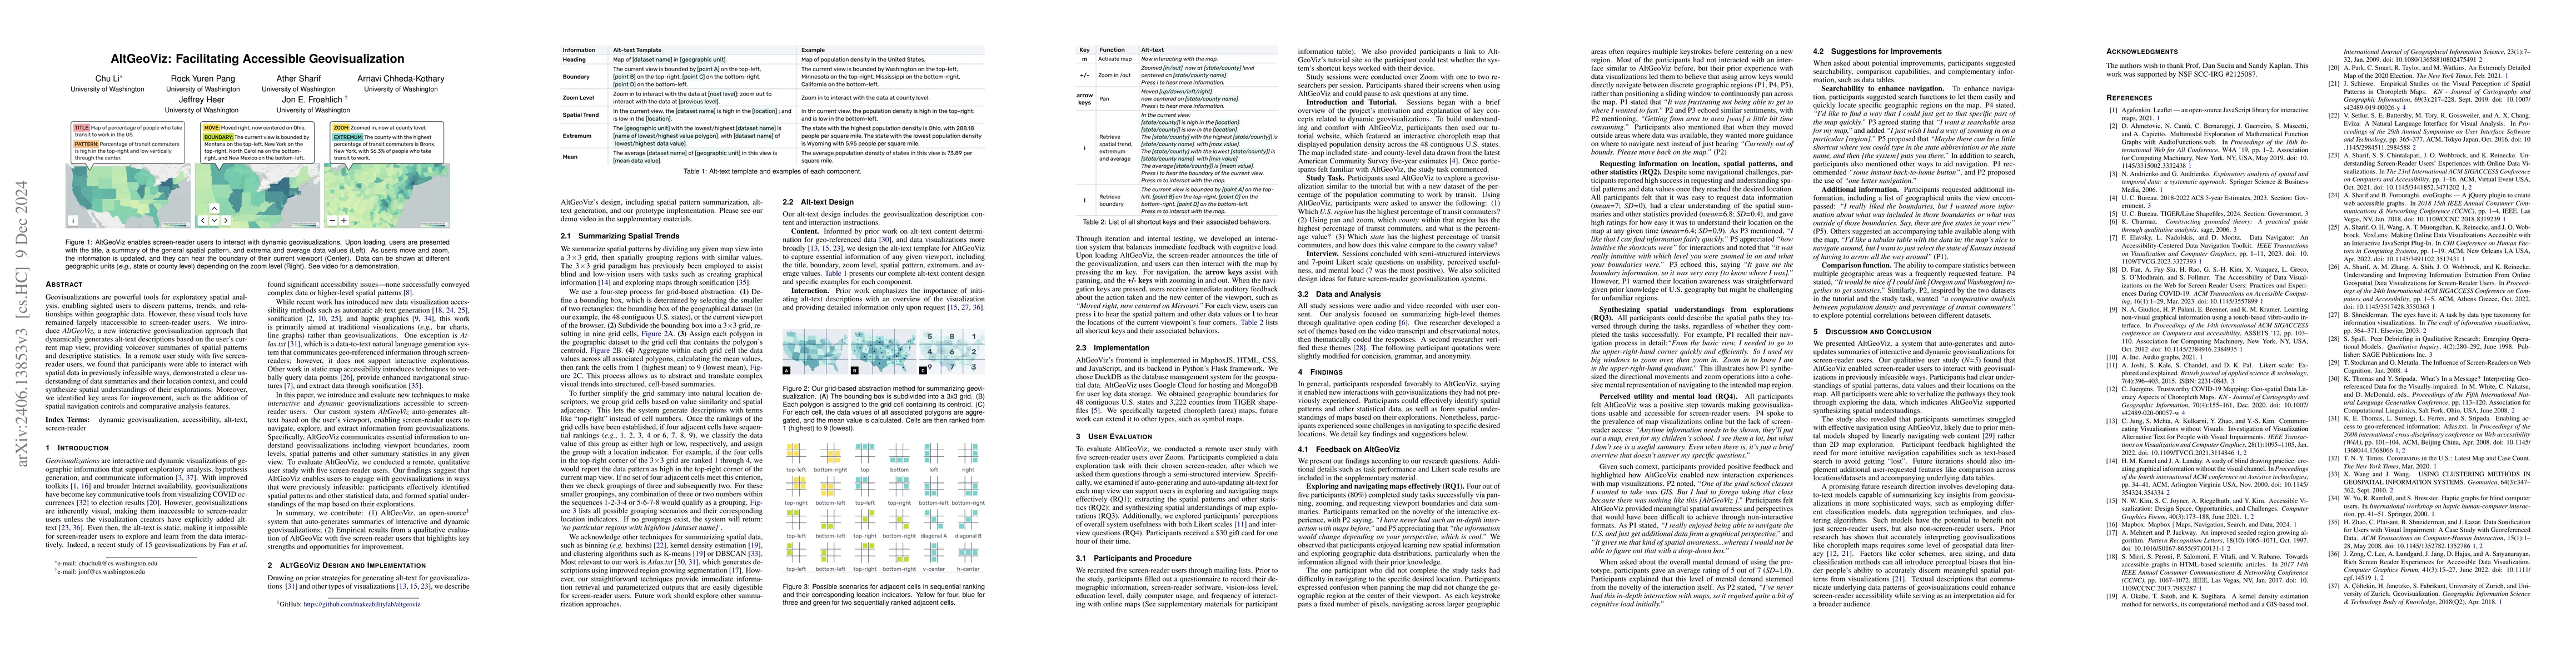
Geovisualizations are powerful tools for exploratory spatial analysis, enabling sighted users to discern patterns, trends, and relationships within geographic data. However, these visual tools have ...
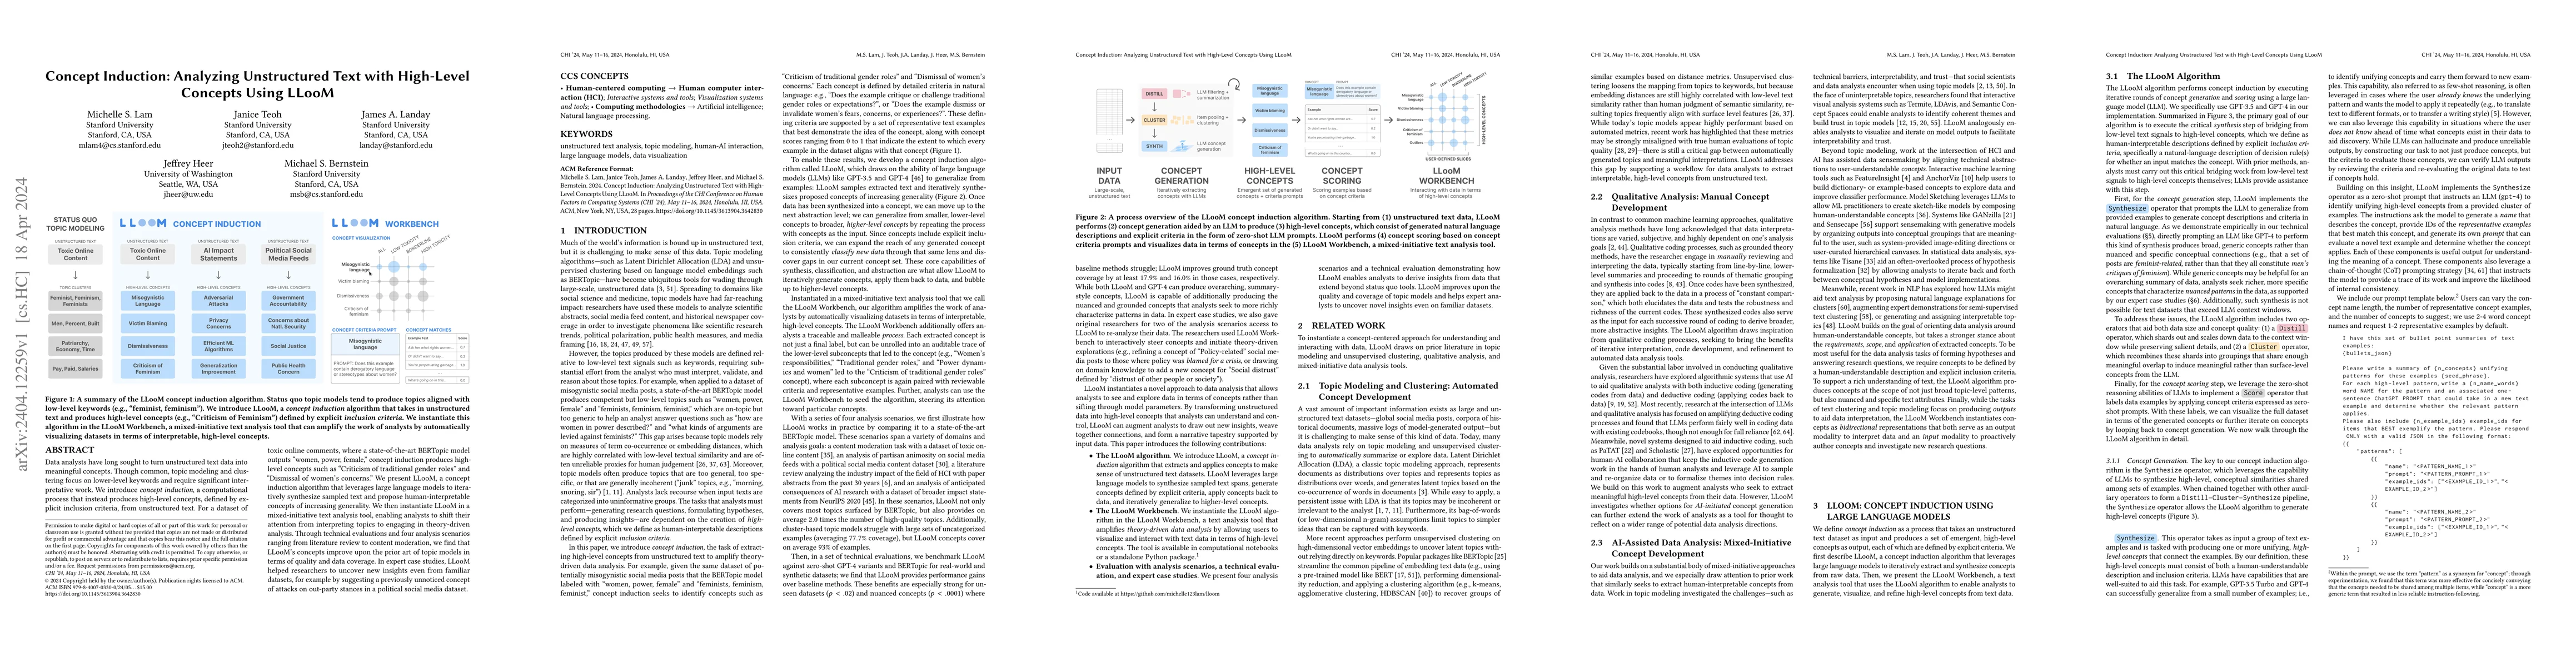
Data analysts have long sought to turn unstructured text data into meaningful concepts. Though common, topic modeling and clustering focus on lower-level keywords and require significant interpretat...
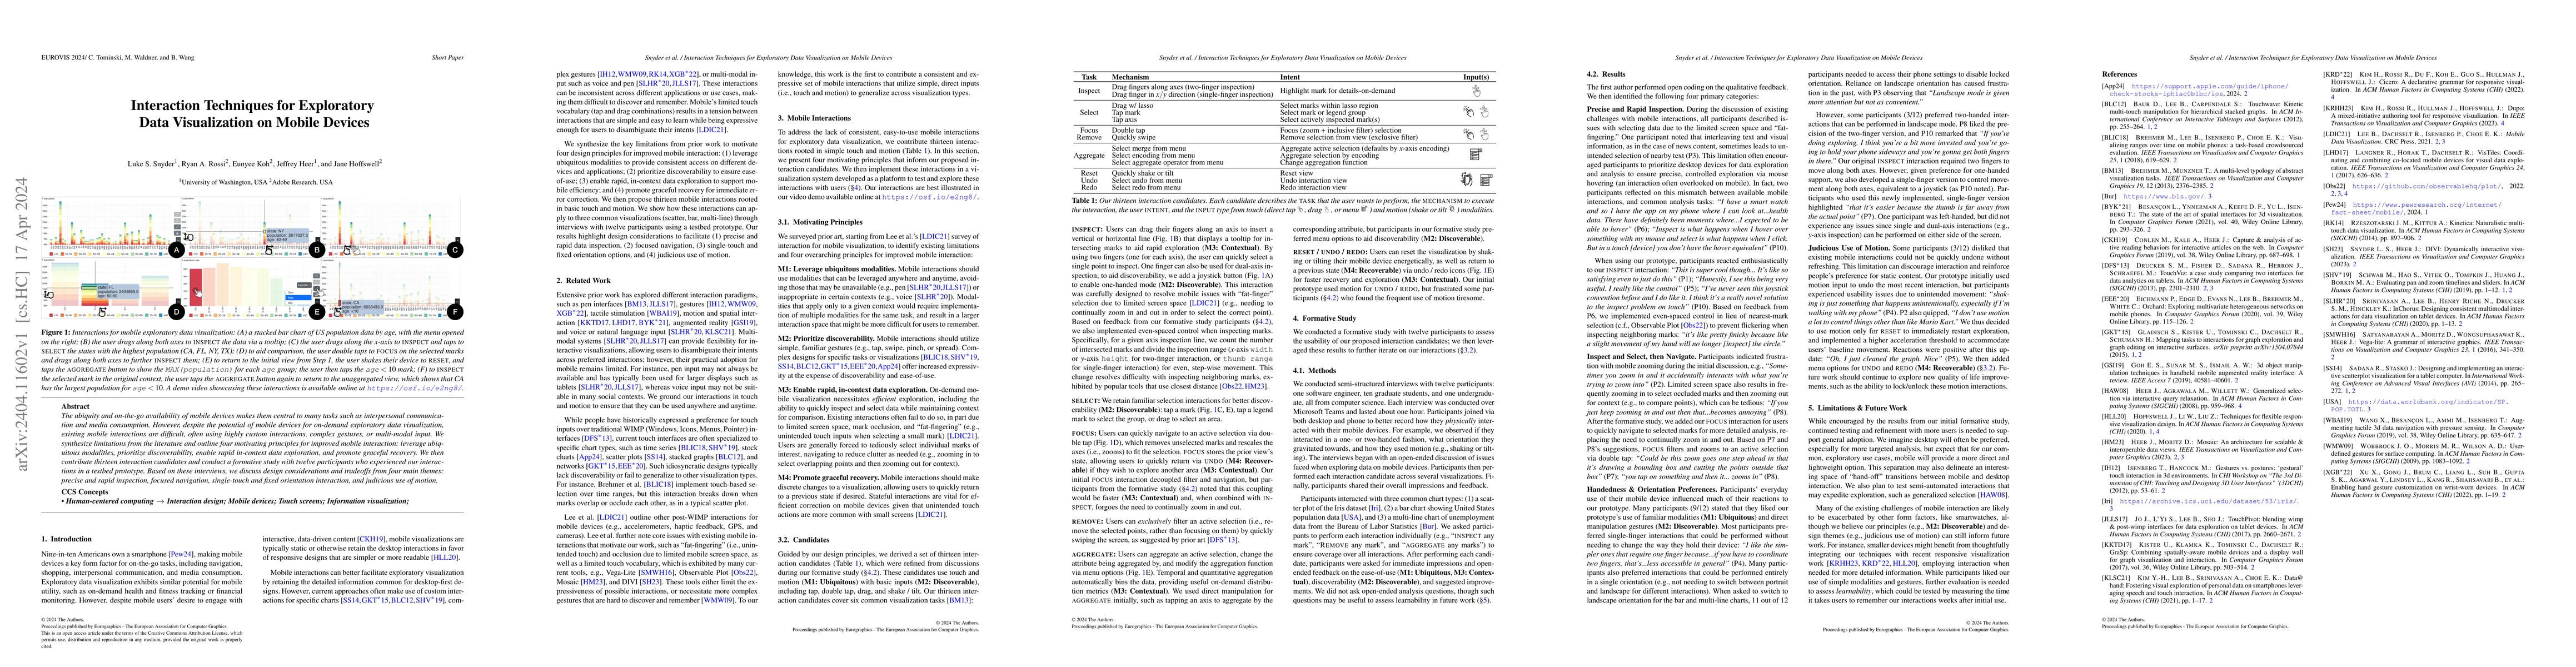
The ubiquity and on-the-go availability of mobile devices makes them central to many tasks such as interpersonal communication and media consumption. However, despite the potential of mobile devices...
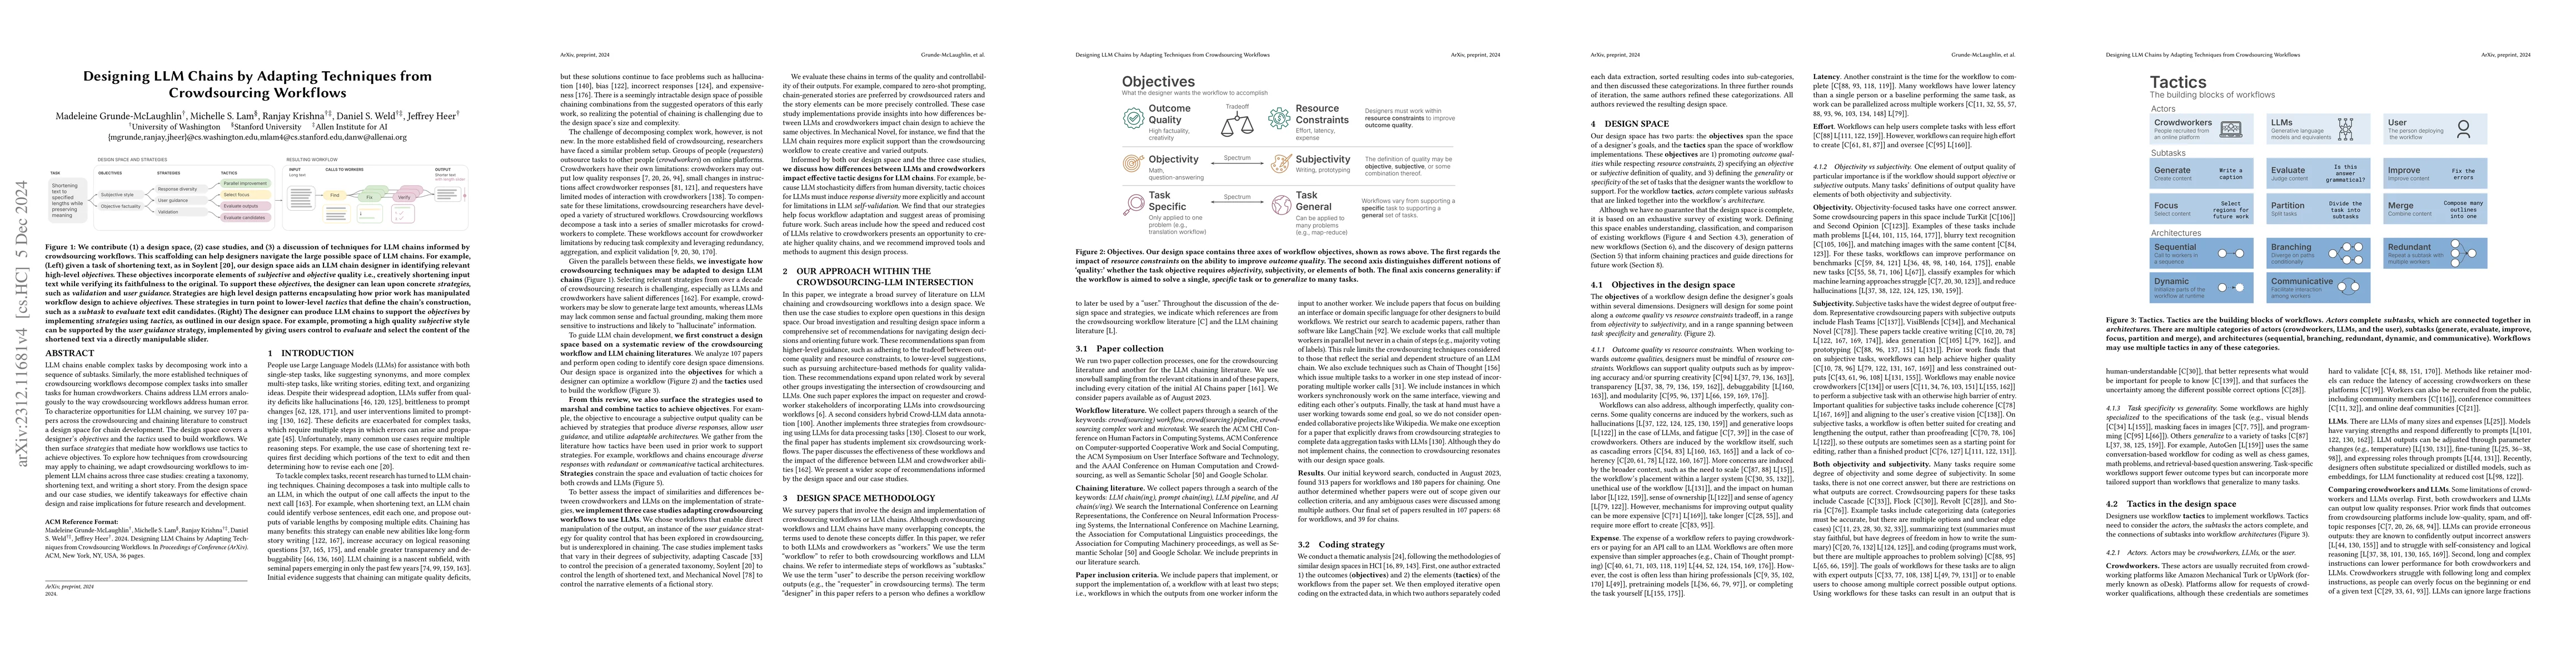
LLM chains enable complex tasks by decomposing work into a sequence of subtasks. Similarly, the more established techniques of crowdsourcing workflows decompose complex tasks into smaller tasks for ...
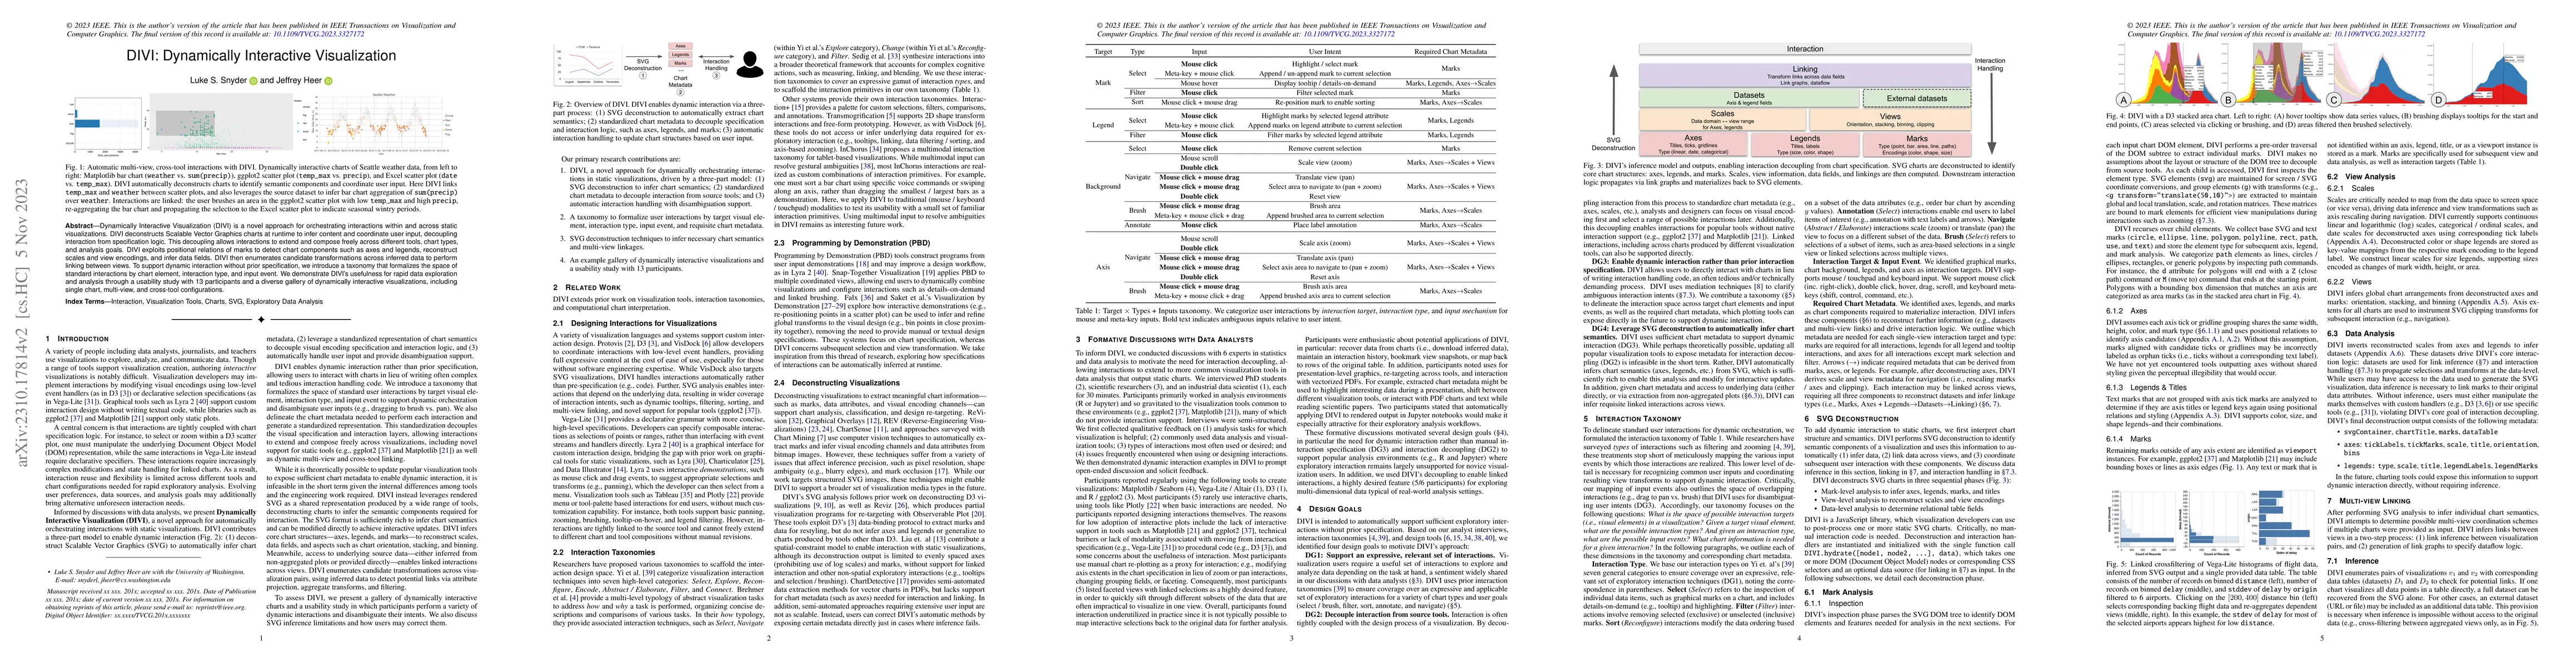
Dynamically Interactive Visualization (DIVI) is a novel approach for orchestrating interactions within and across static visualizations. DIVI deconstructs Scalable Vector Graphics charts at runtime ...
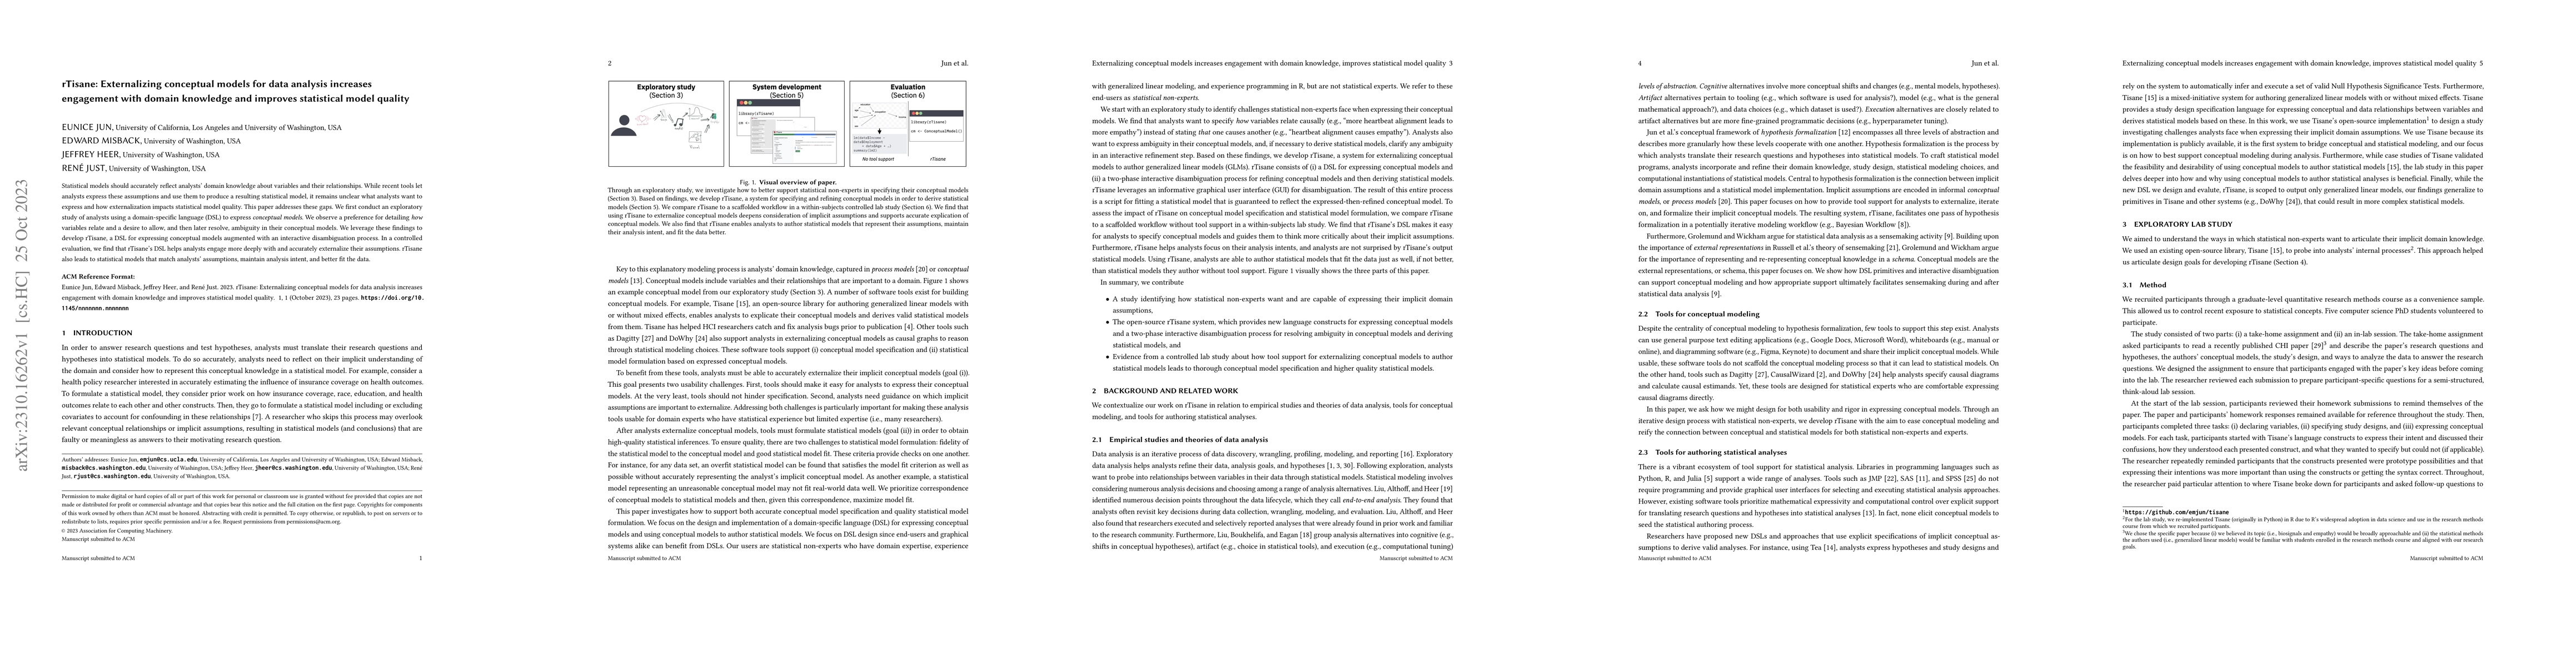
Statistical models should accurately reflect analysts' domain knowledge about variables and their relationships. While recent tools let analysts express these assumptions and use them to produce a r...
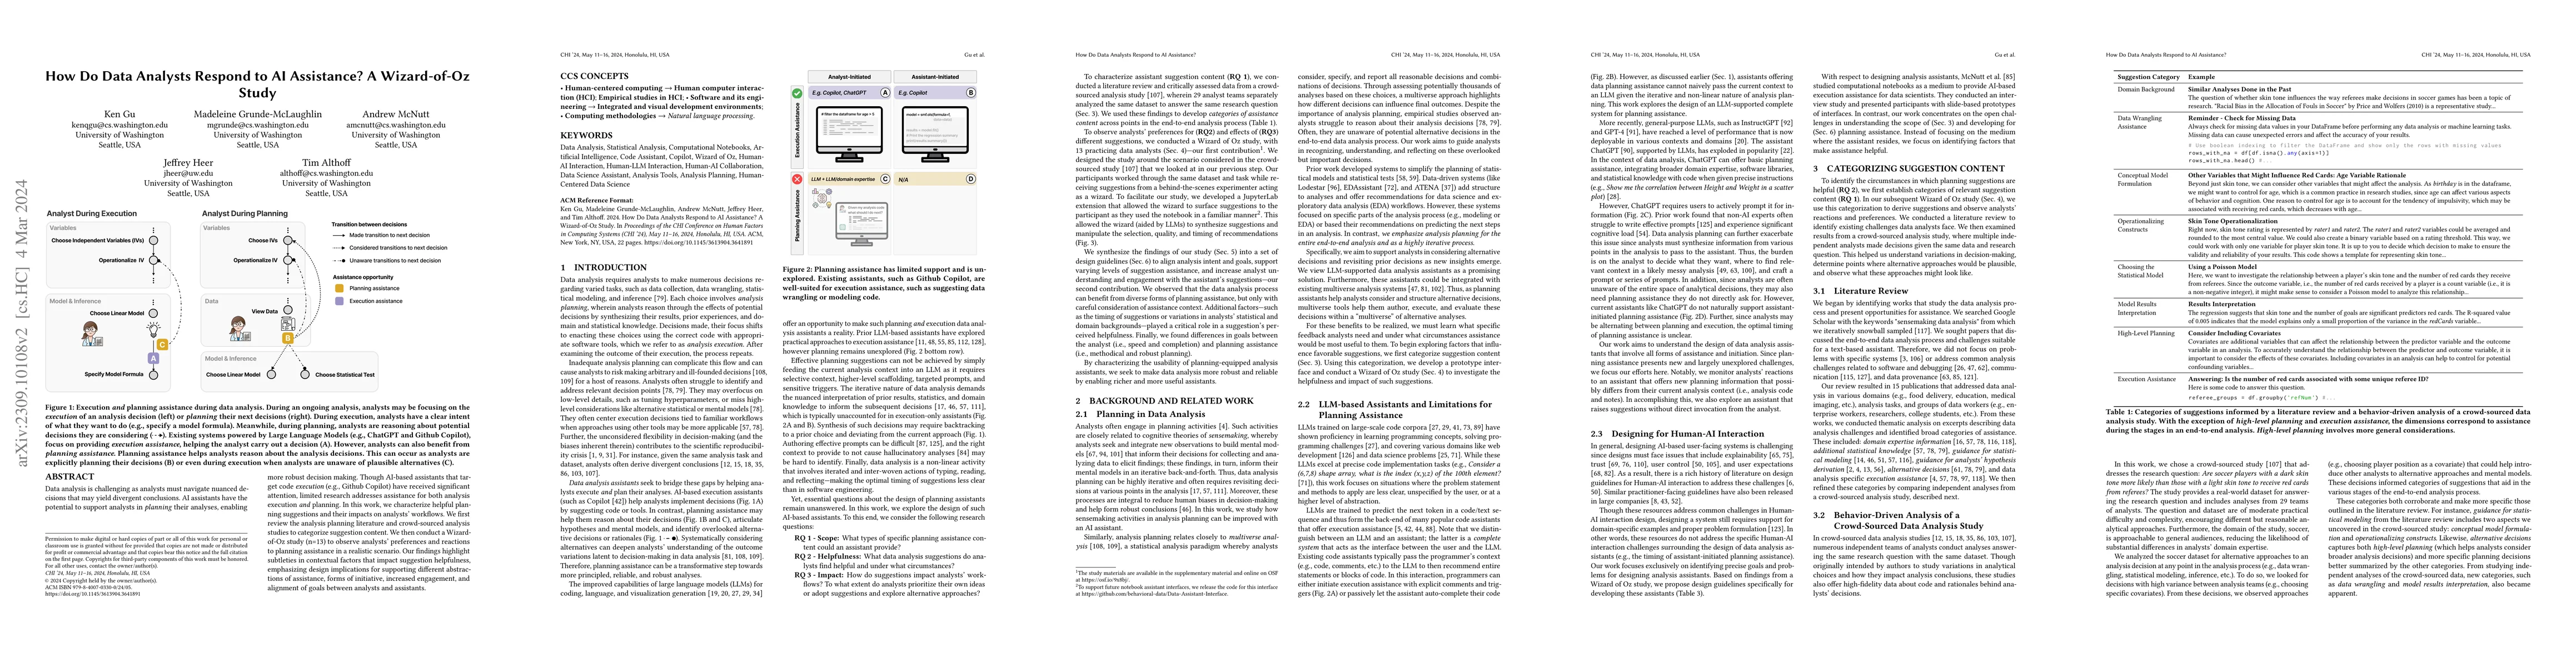
Data analysis is challenging as analysts must navigate nuanced decisions that may yield divergent conclusions. AI assistants have the potential to support analysts in planning their analyses, enabli...
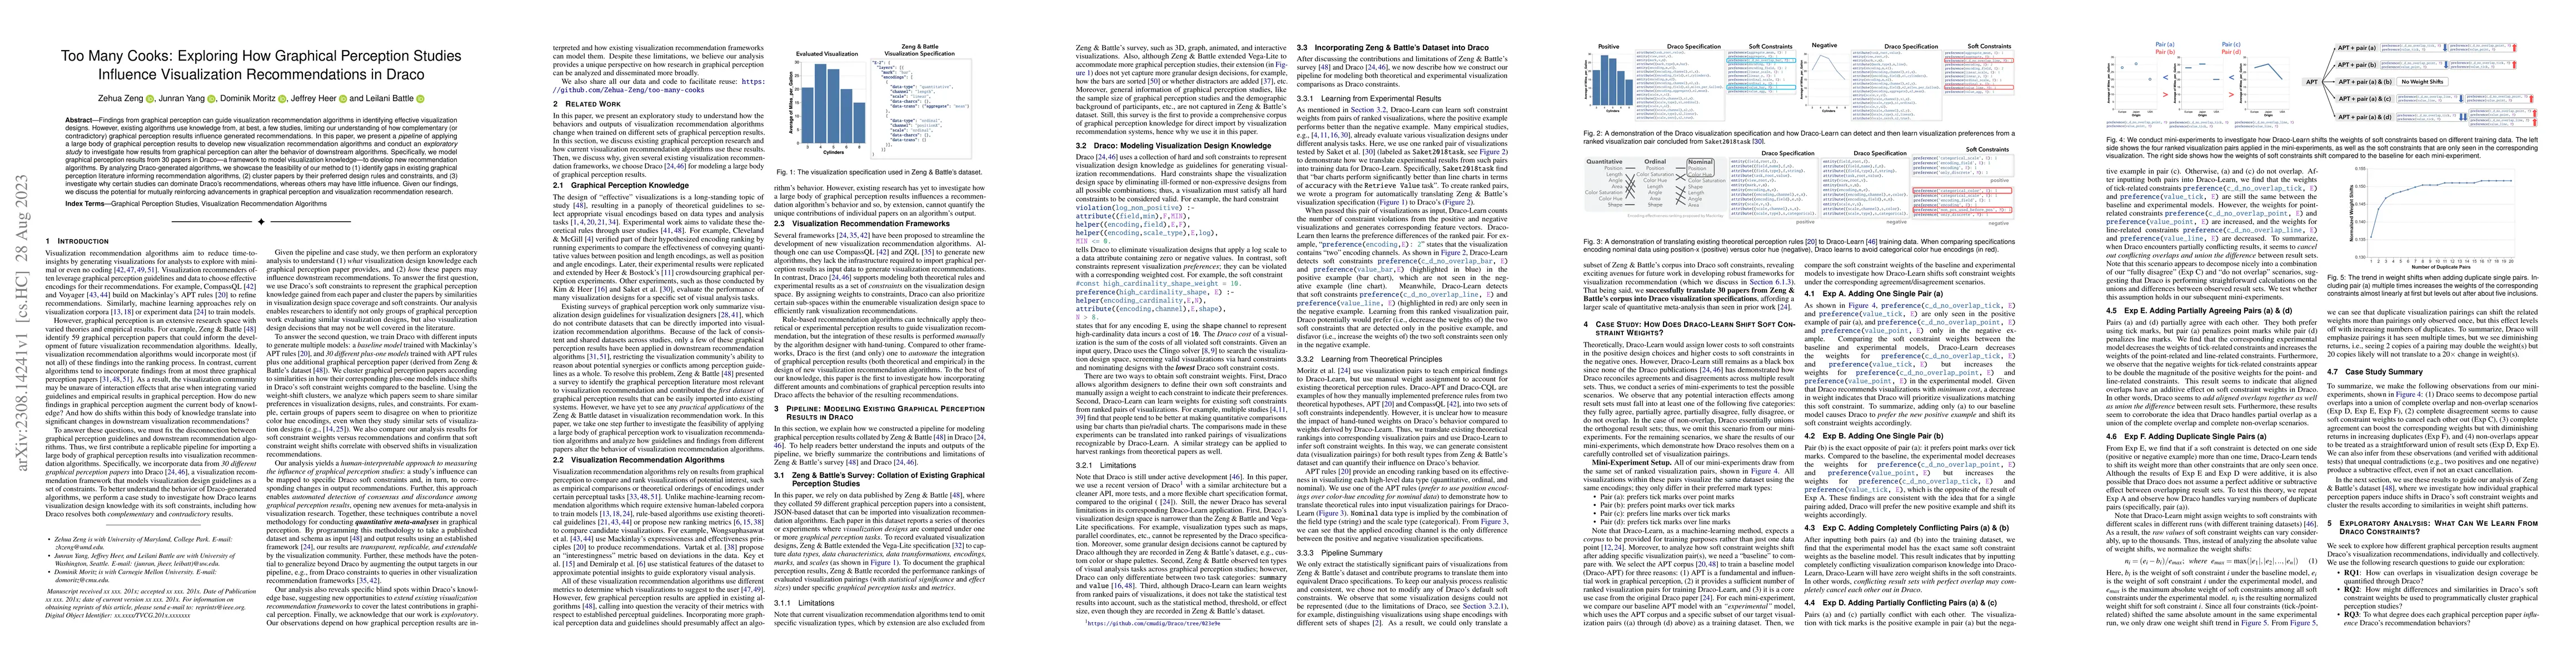
Findings from graphical perception can guide visualization recommendation algorithms in identifying effective visualization designs. However, existing algorithms use knowledge from, at best, a few s...
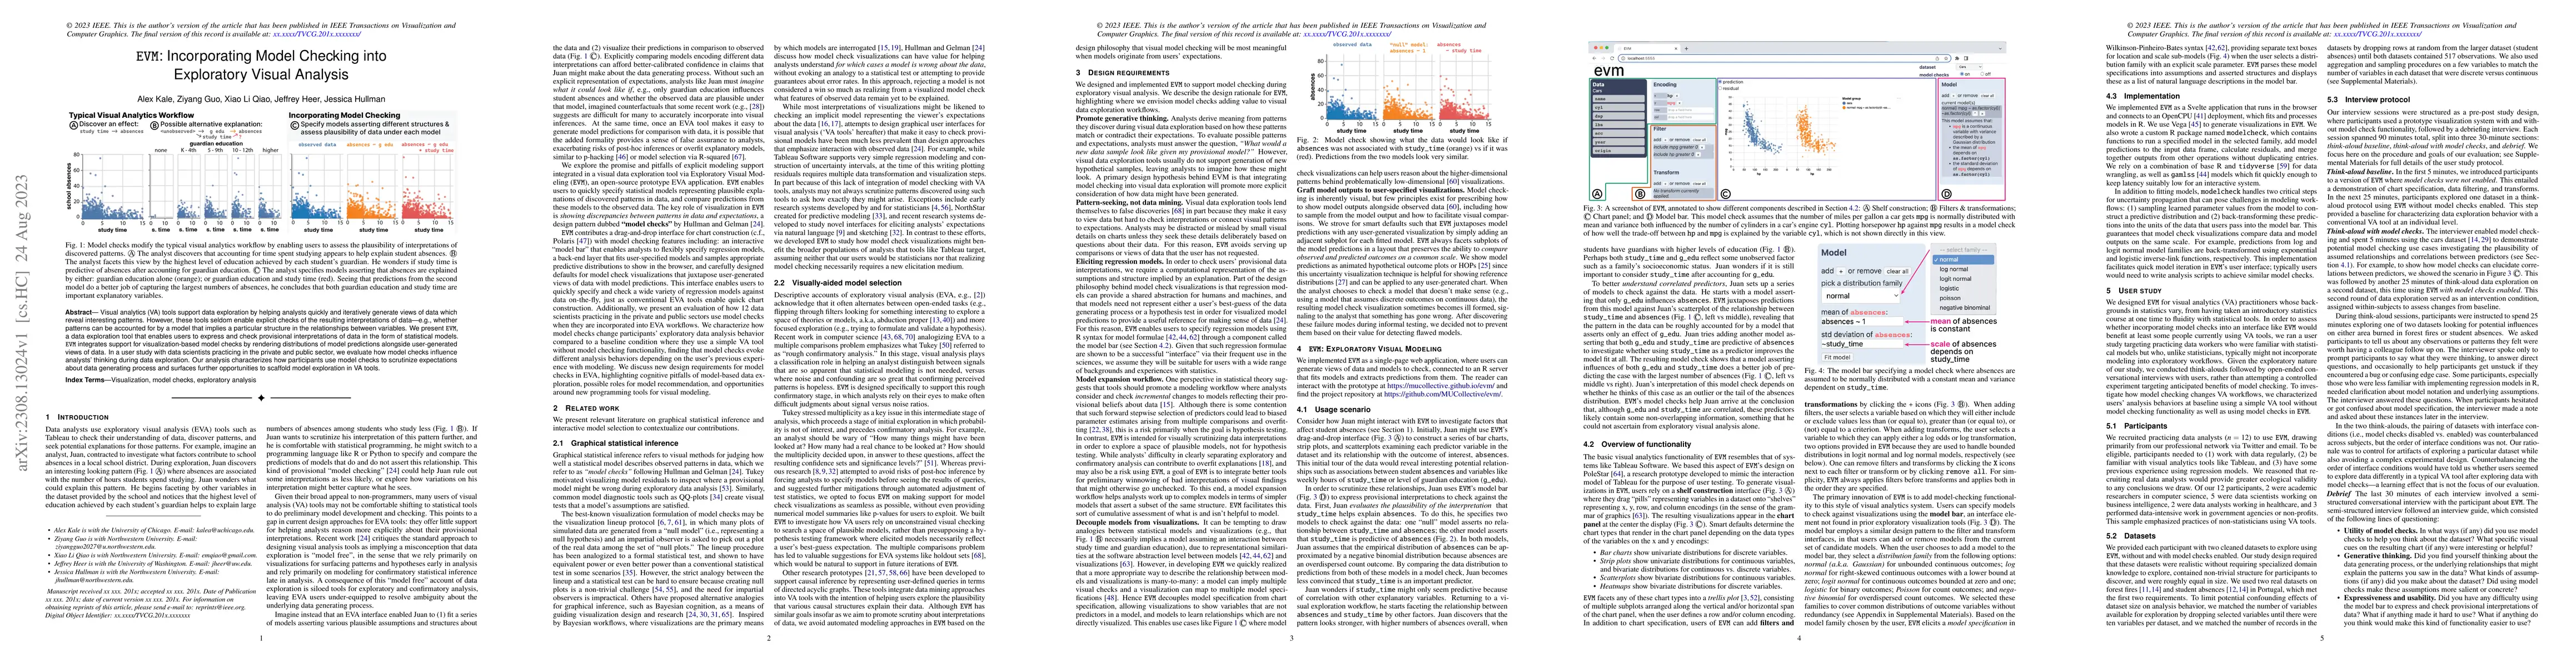
Visual analytics (VA) tools support data exploration by helping analysts quickly and iteratively generate views of data which reveal interesting patterns. However, these tools seldom enable explicit...
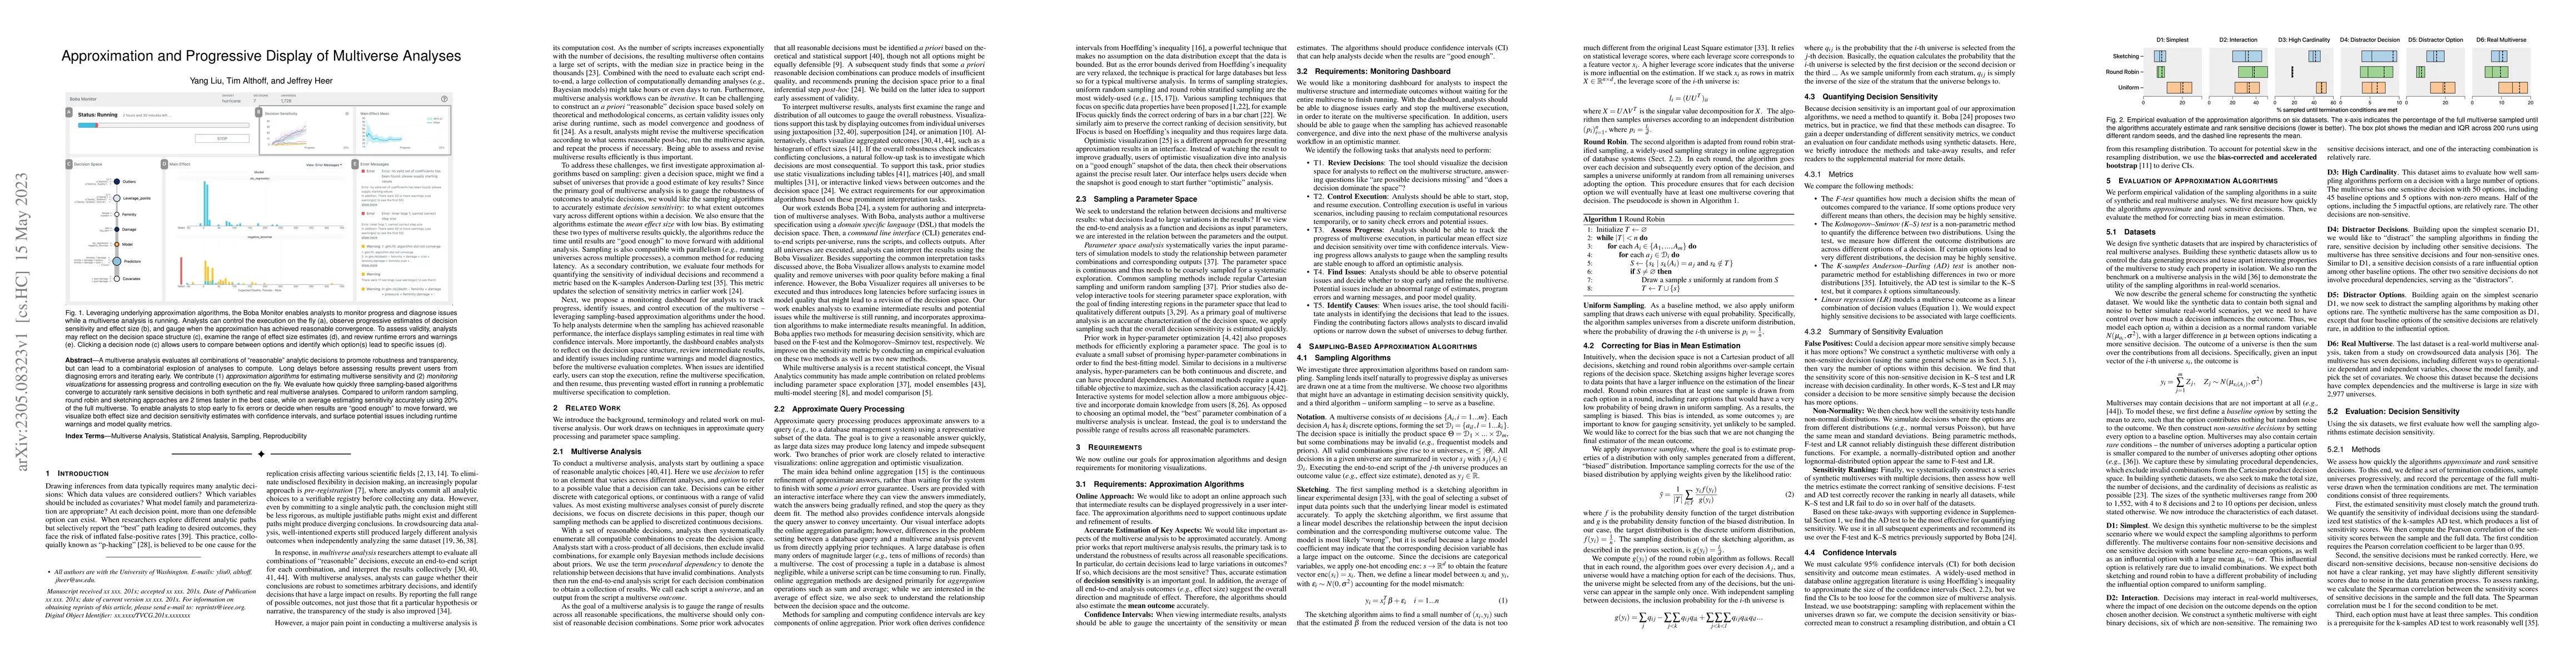
A multiverse analysis evaluates all combinations of "reasonable" analytic decisions to promote robustness and transparency, but can lead to a combinatorial explosion of analyses to compute. Long del...
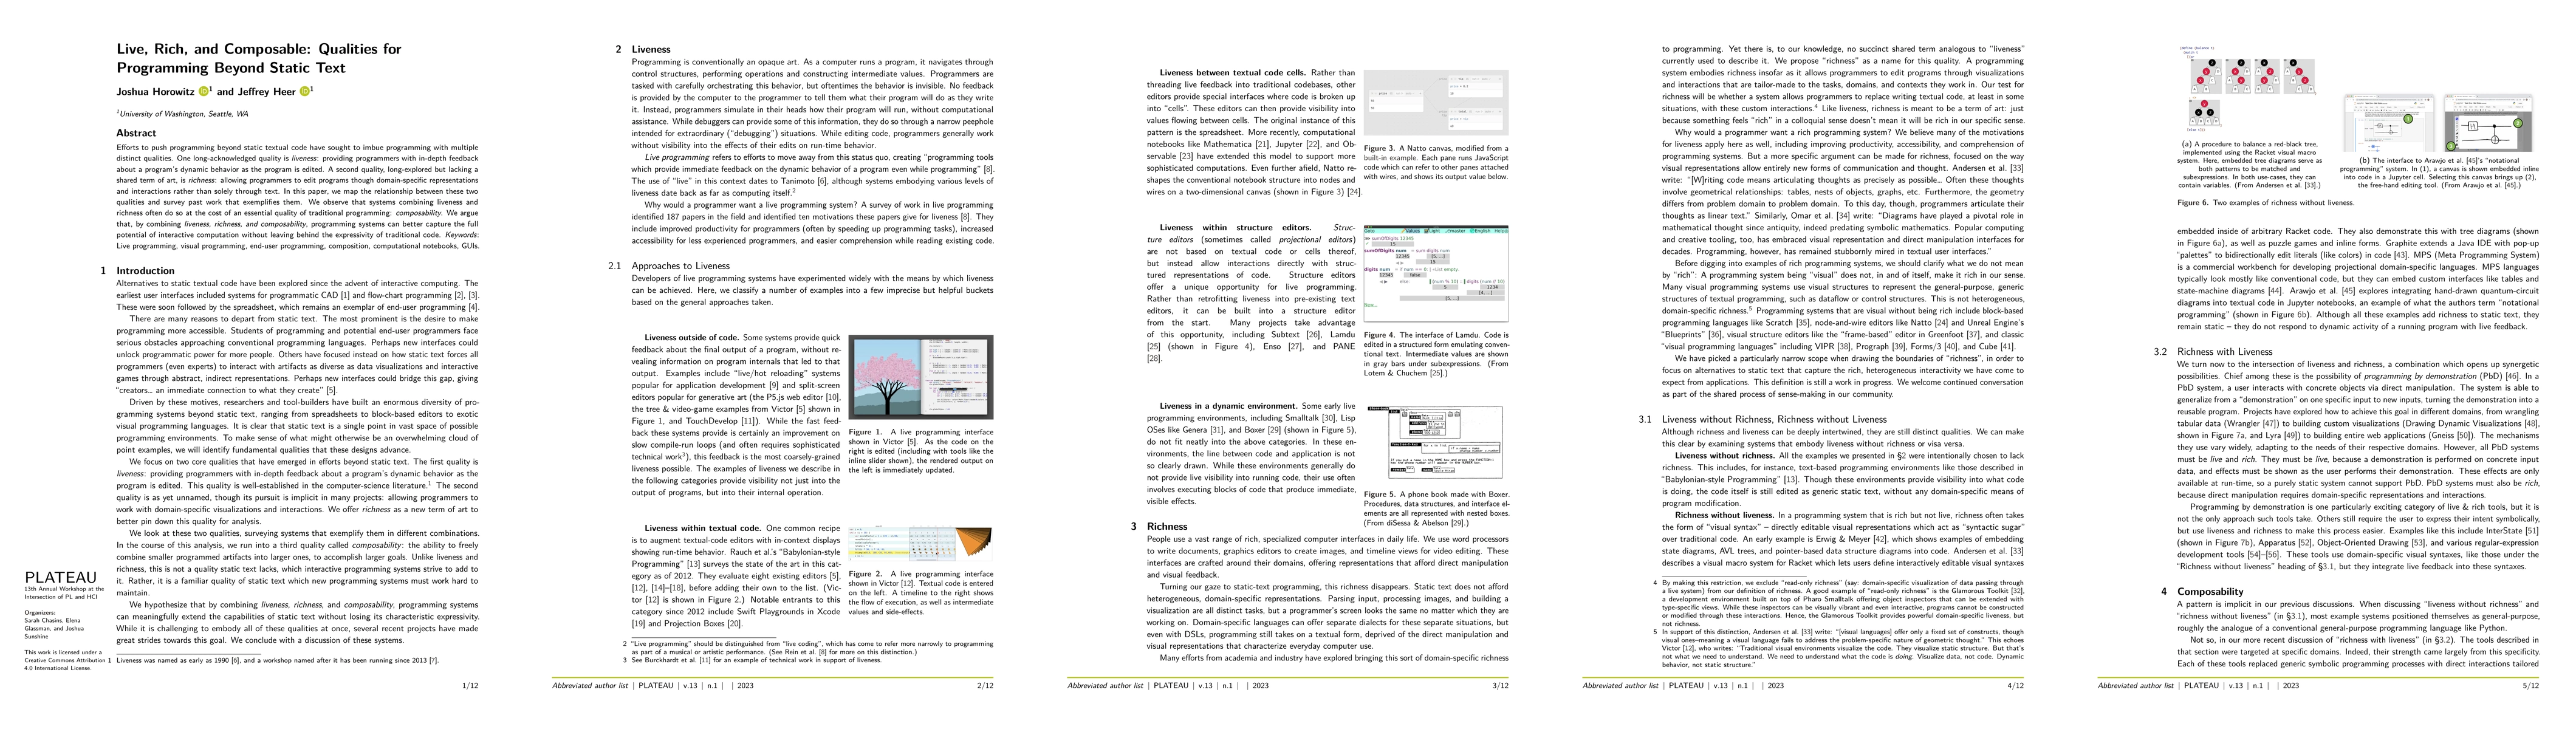
Efforts to push programming beyond static textual code have sought to imbue programming with multiple distinct qualities. One long-acknowledged quality is liveness: providing programmers with in-dep...
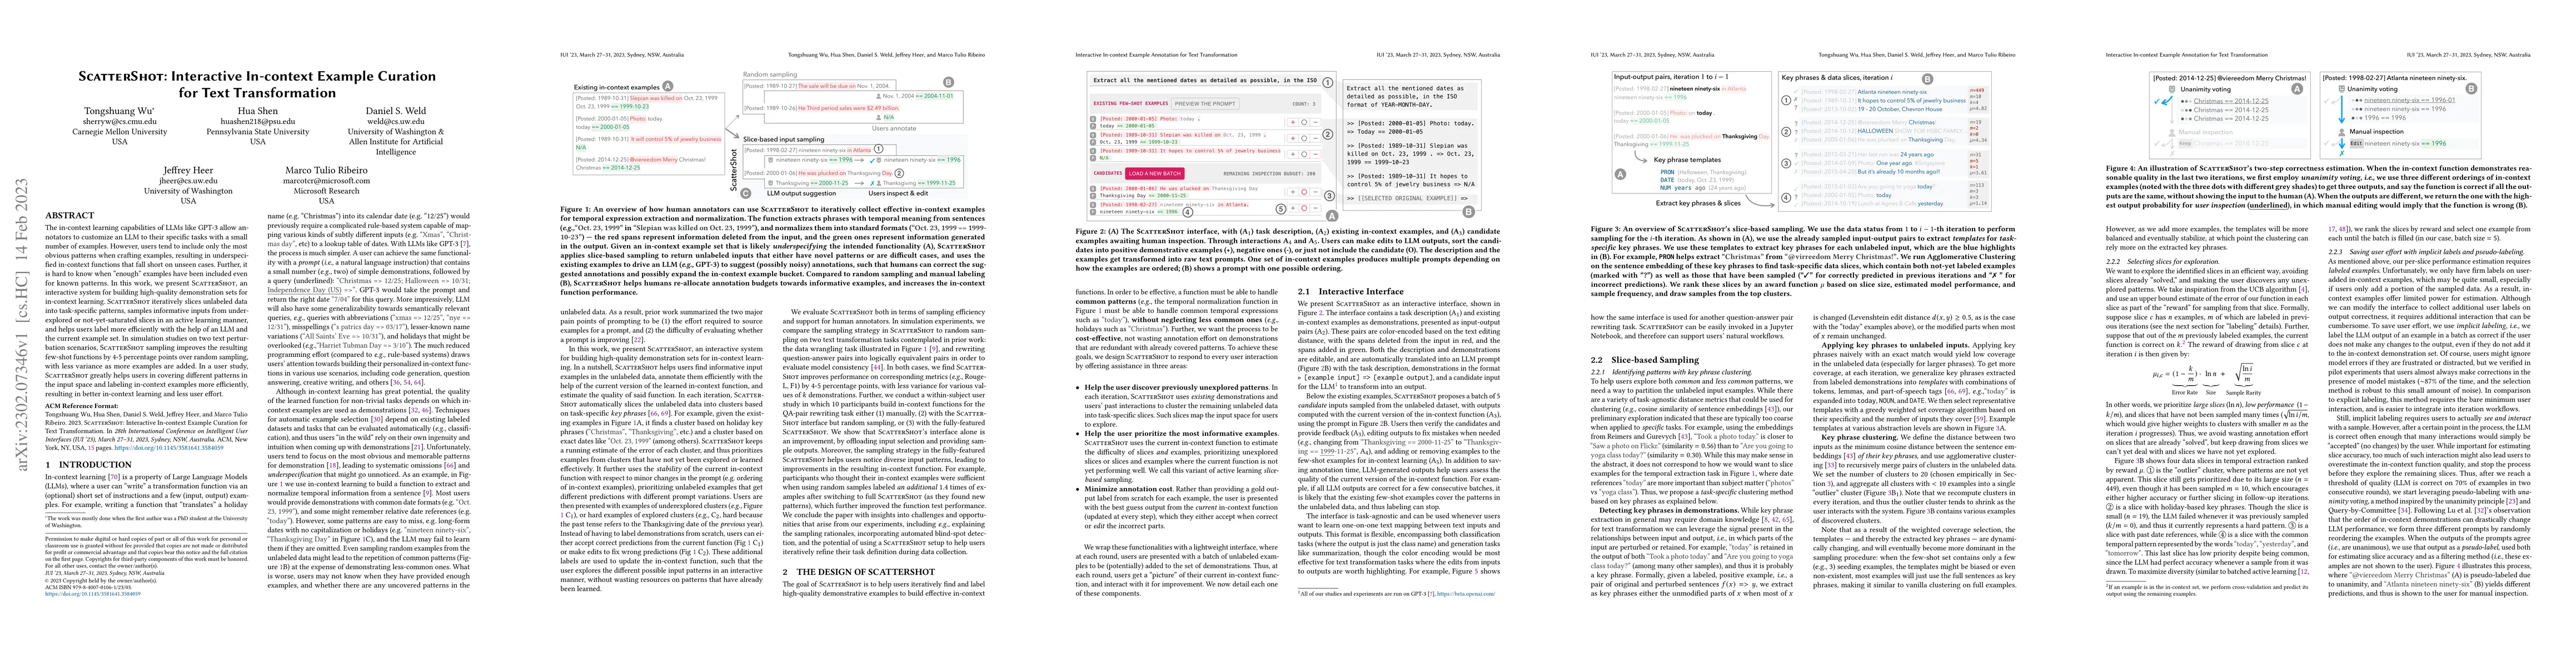
The in-context learning capabilities of LLMs like GPT-3 allow annotators to customize an LLM to their specific tasks with a small number of examples. However, users tend to include only the most obv...
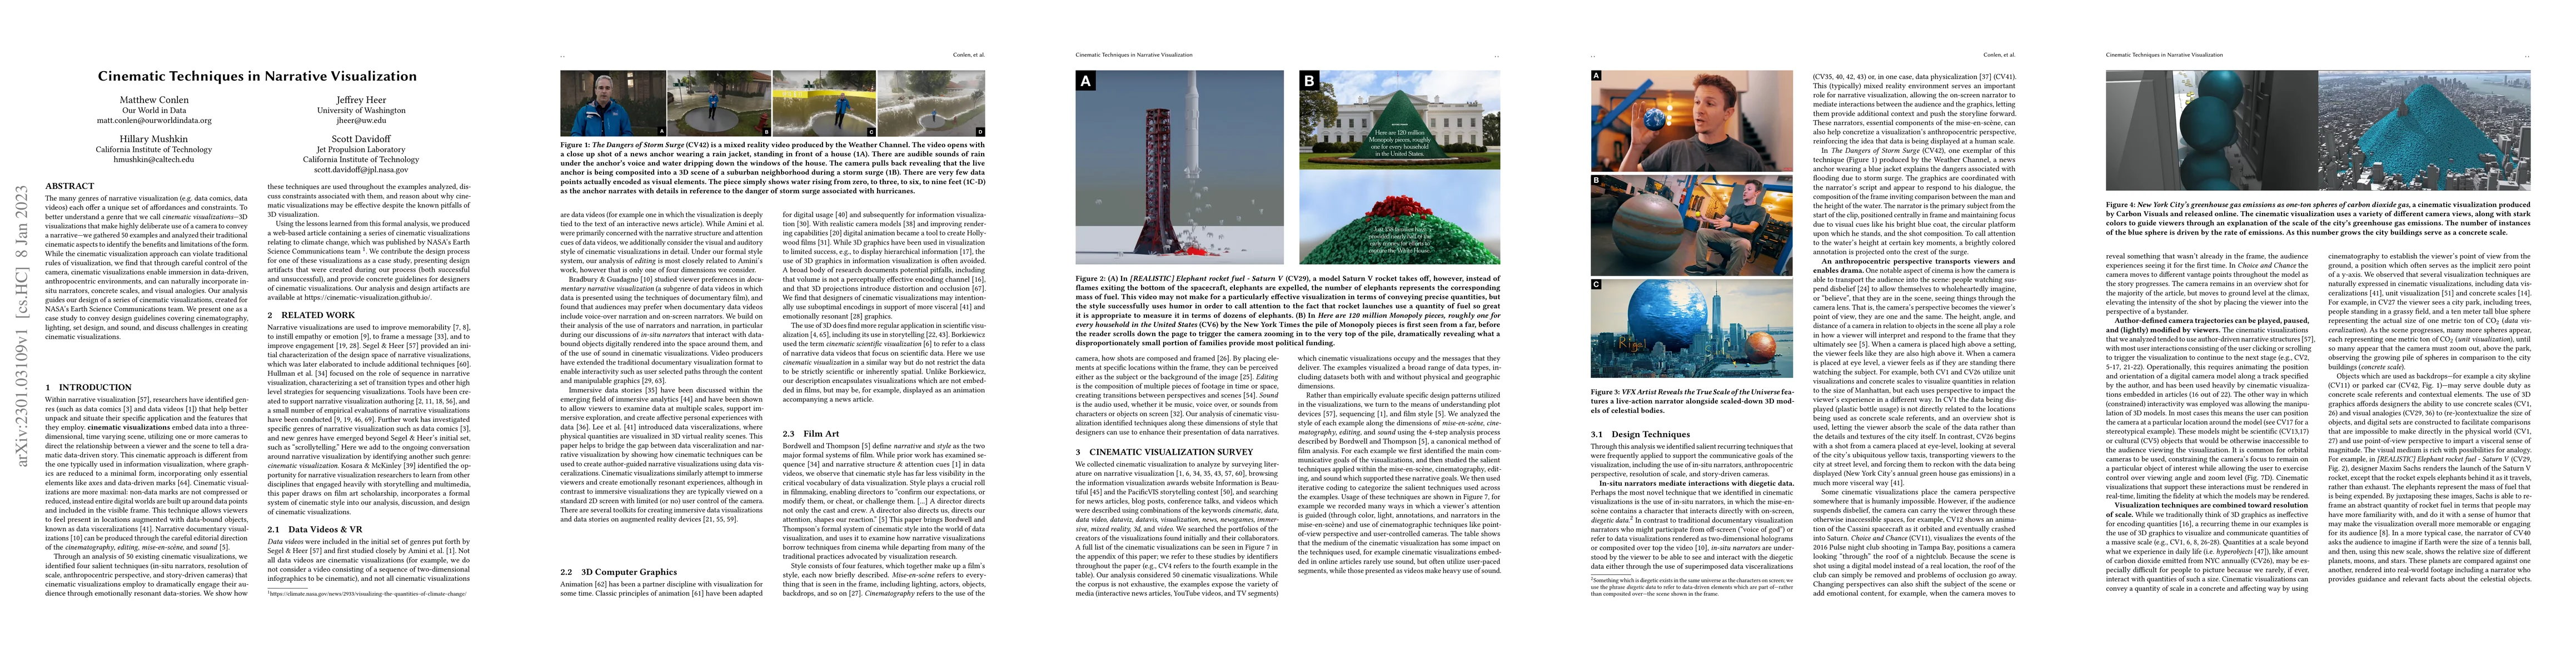
The many genres of narrative visualization (e.g. data comics, data videos) each offer a unique set of affordances and constraints. To better understand a genre that we call cinematic visualizations-...
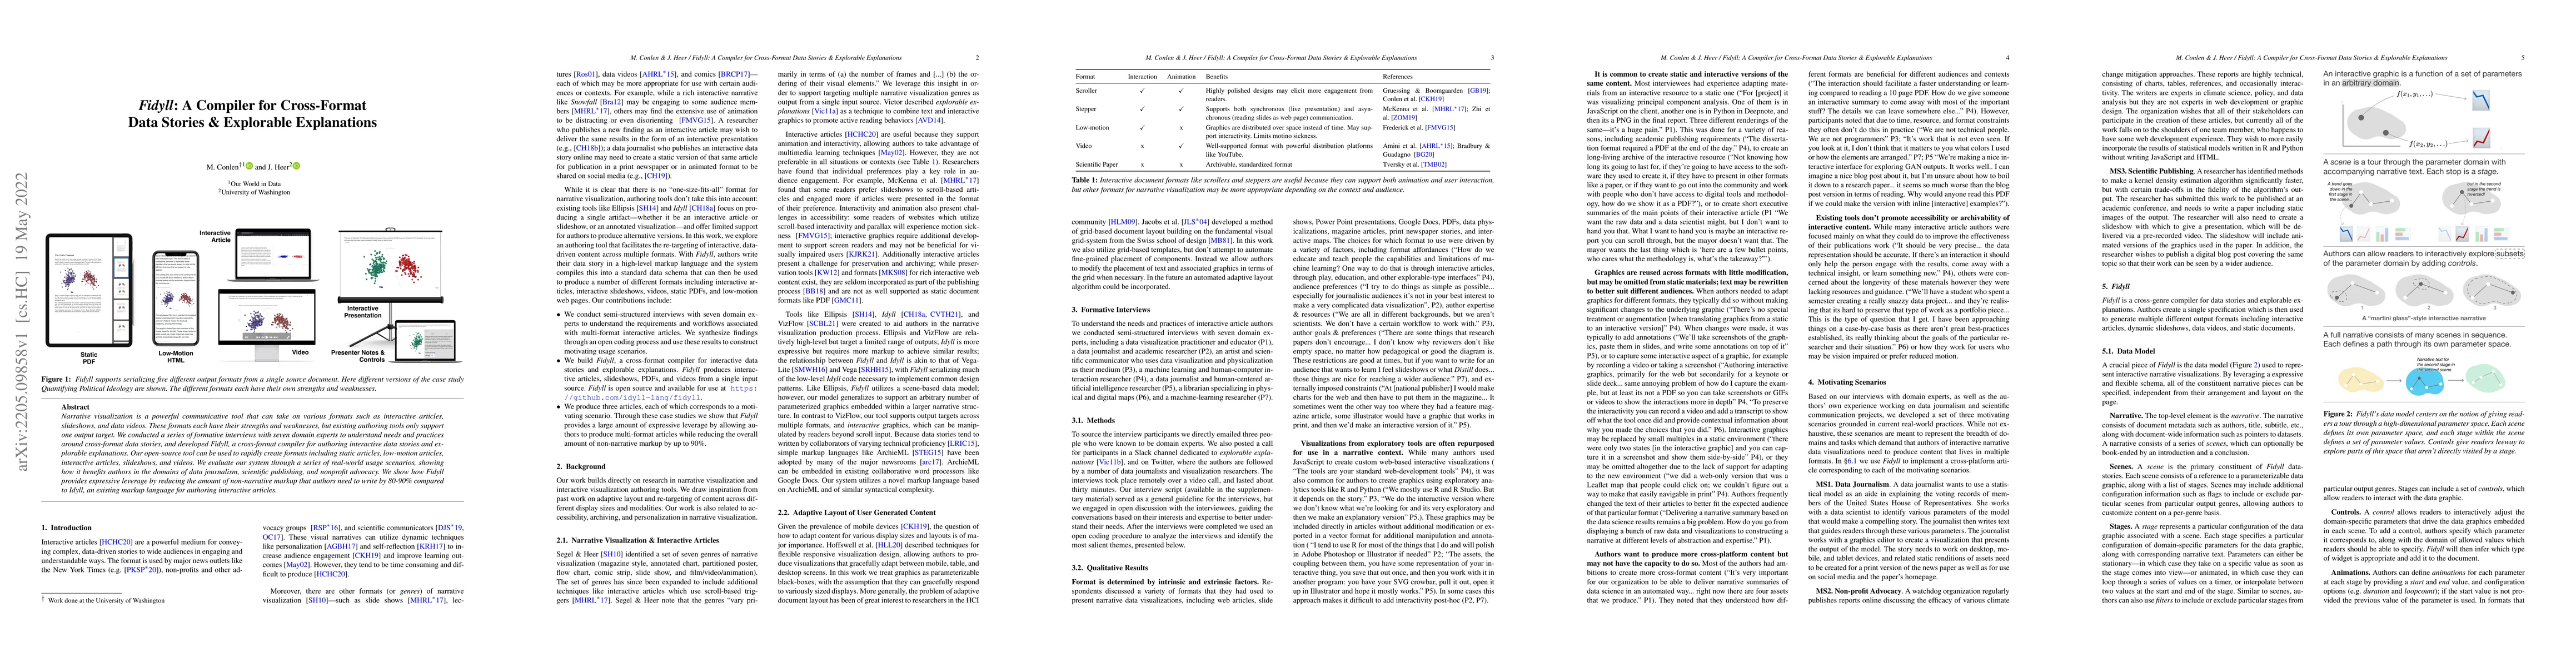
Narrative visualization is a powerful communicative tool that can take on various formats such as interactive articles, slideshows, and data videos. These formats each have their strengths and weakn...
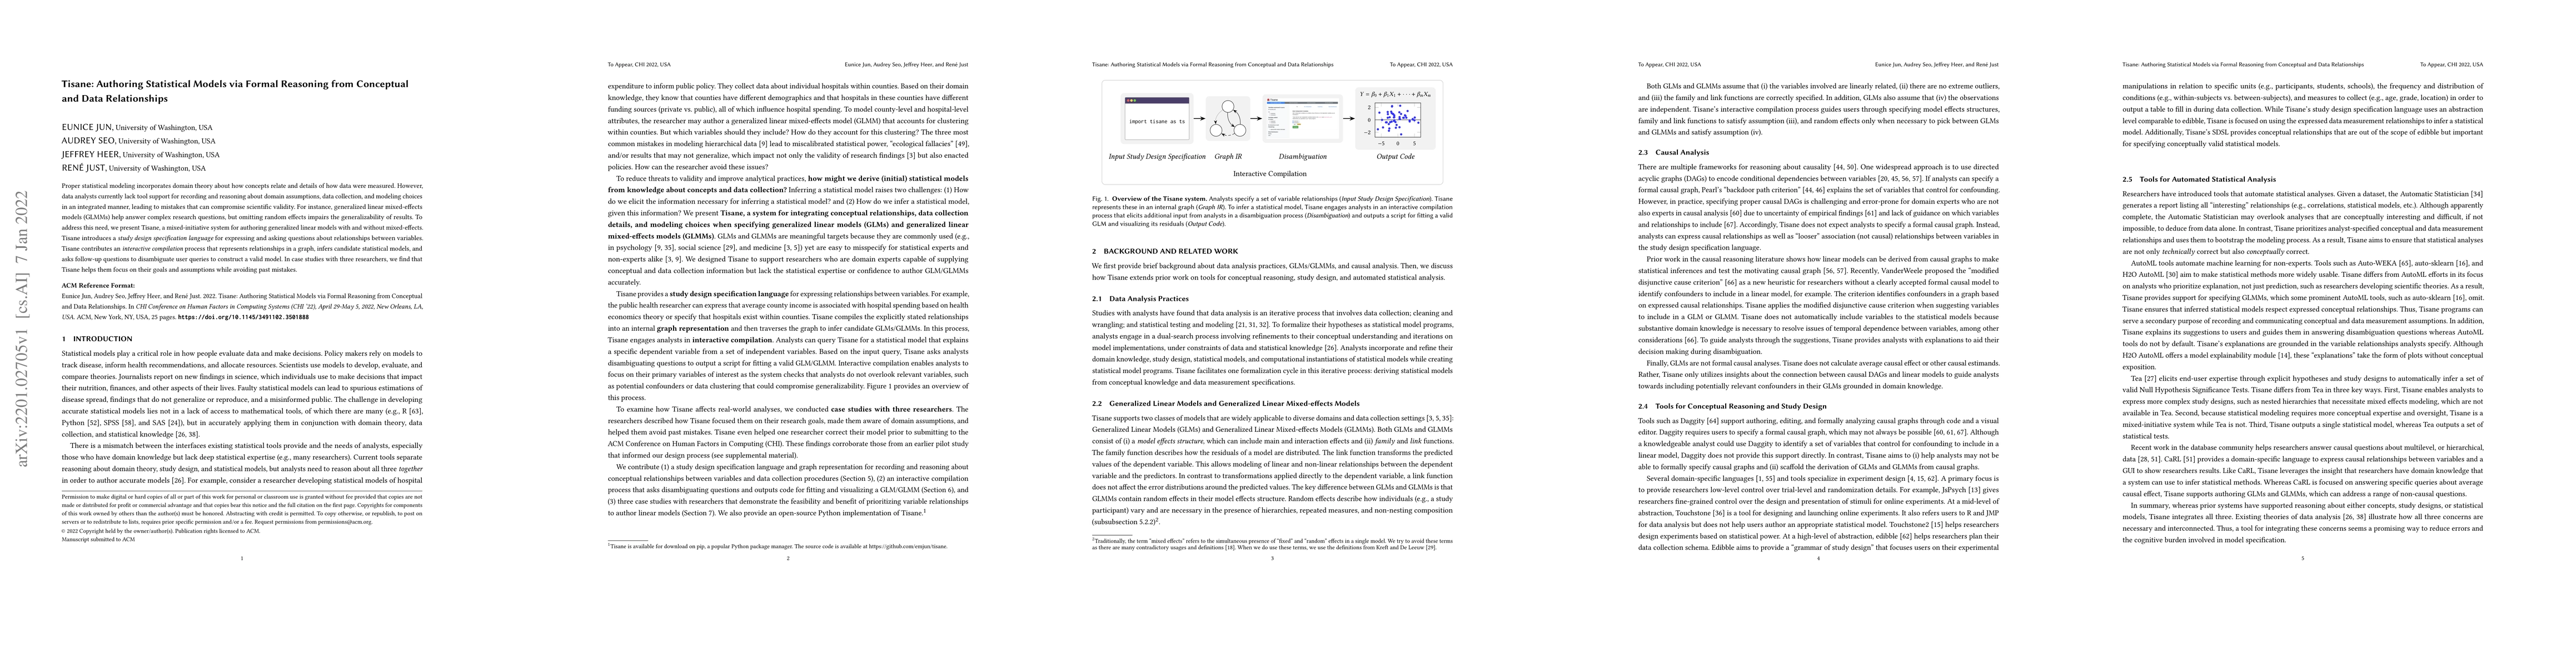
Proper statistical modeling incorporates domain theory about how concepts relate and details of how data were measured. However, data analysts currently lack tool support for recording and reasoning...
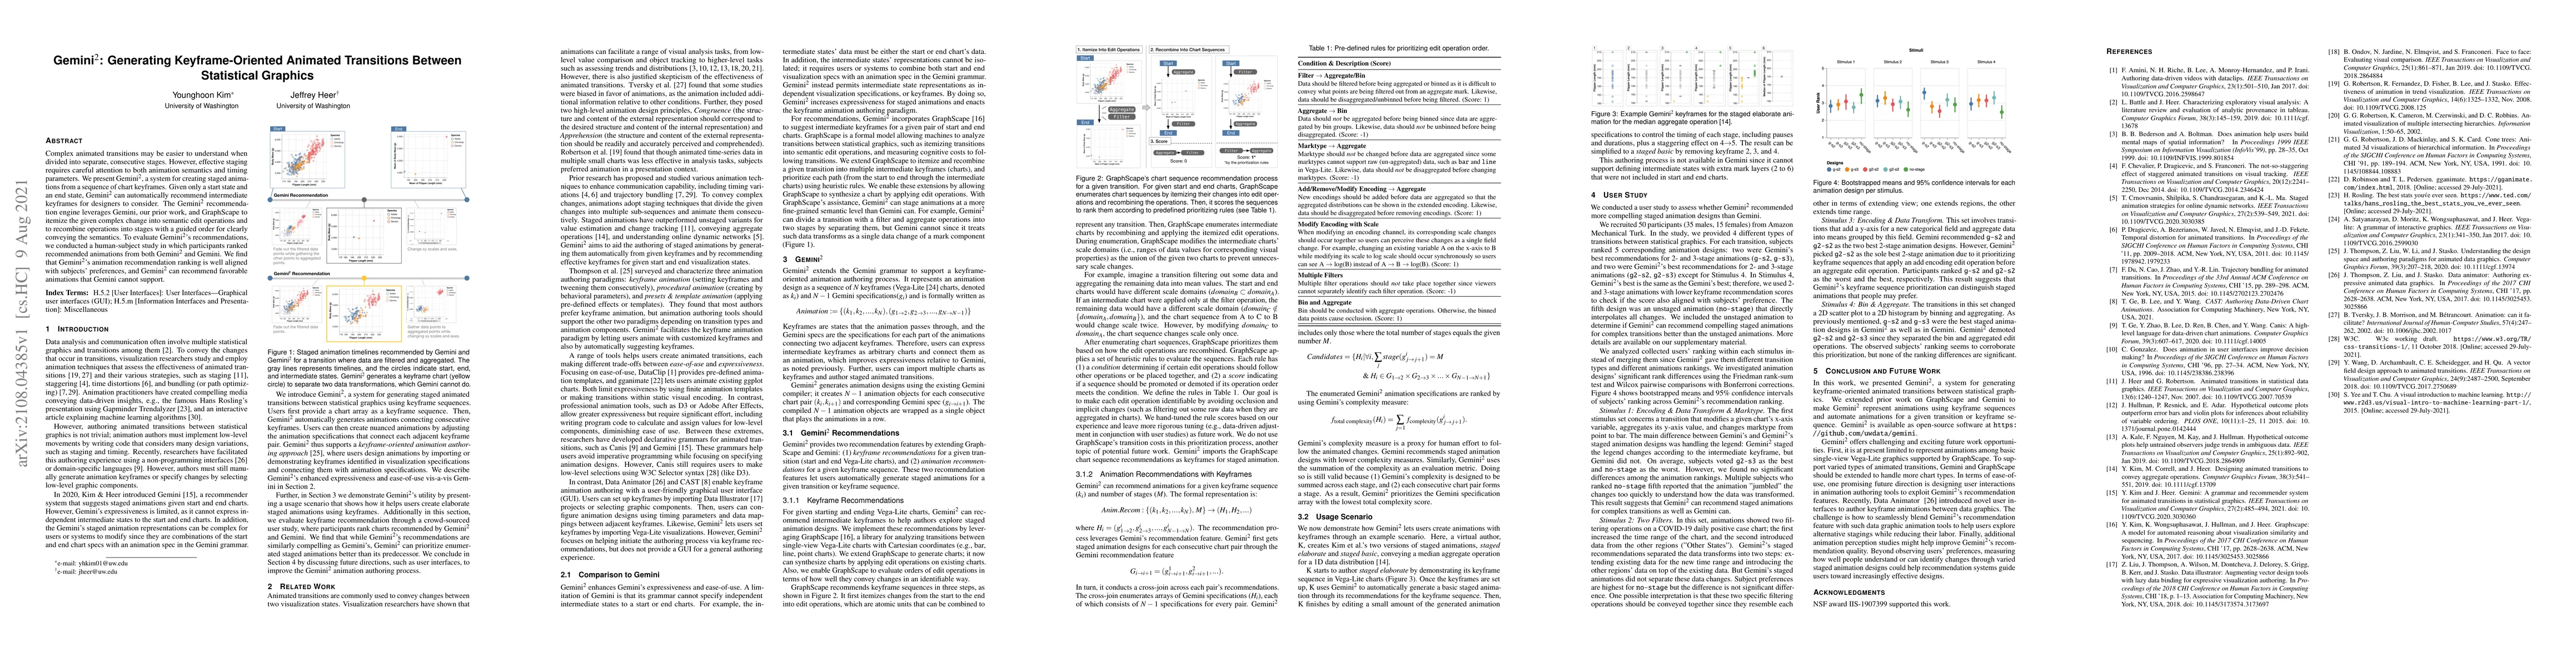
Complex animated transitions may be easier to understand when divided into separate, consecutive stages. However, effective staging requires careful attention to both animation semantics and timing ...
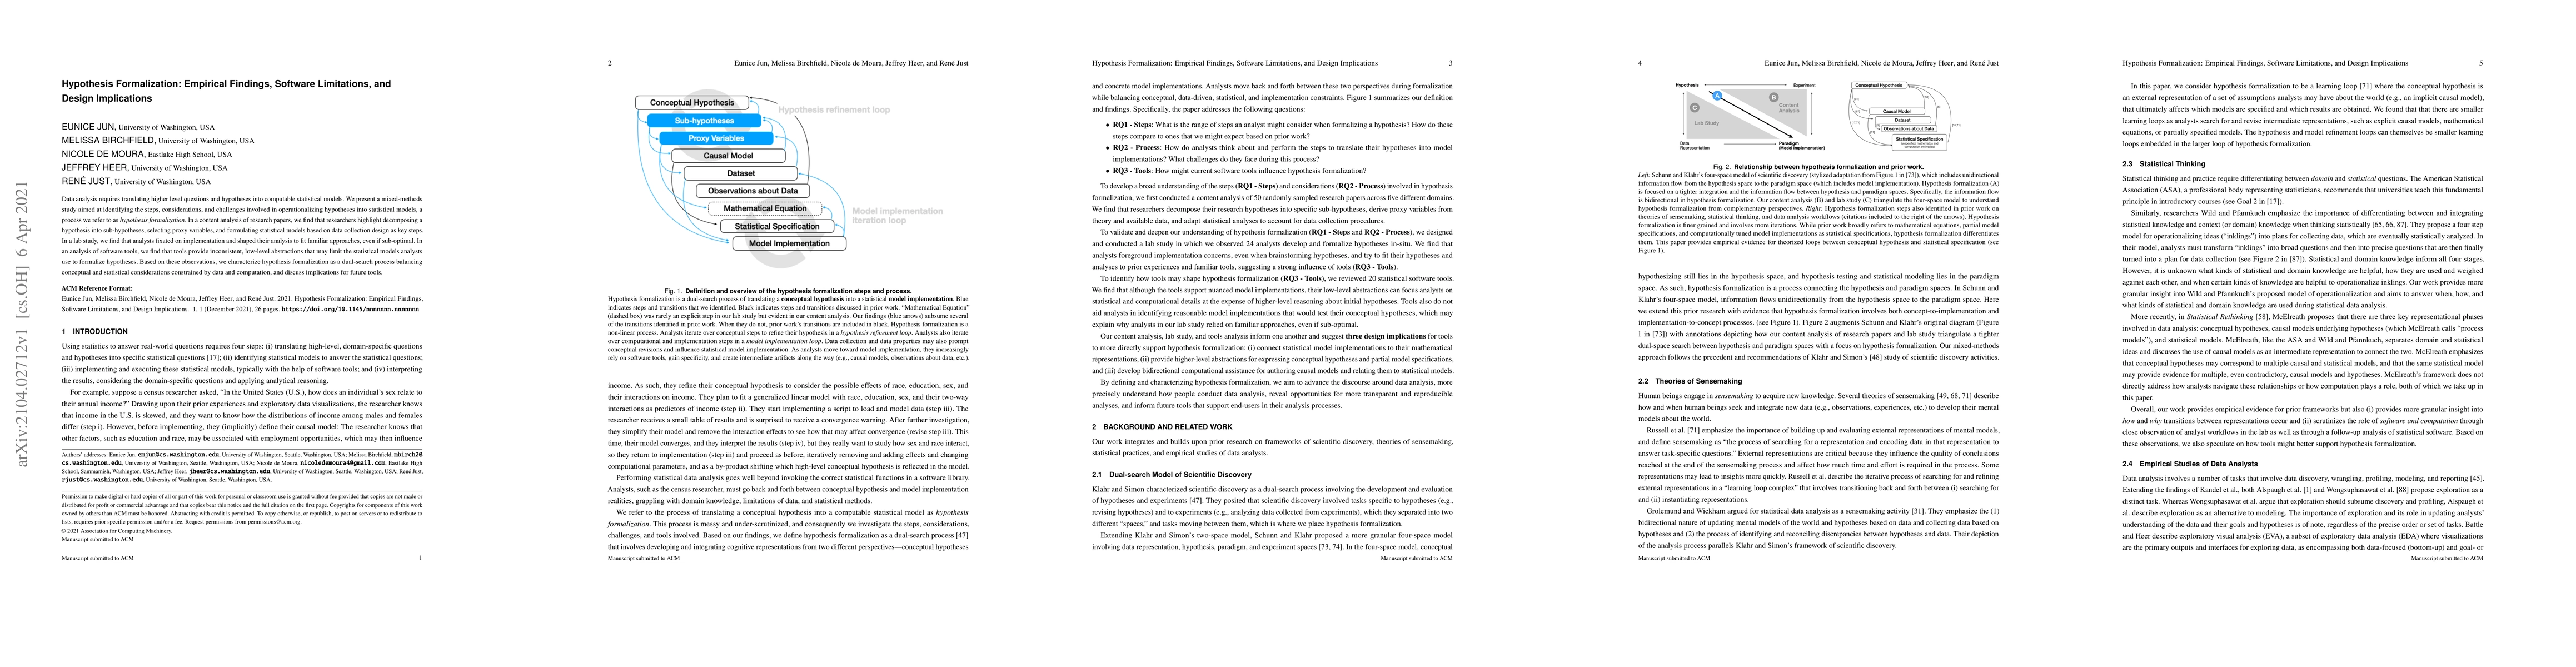
Data analysis requires translating higher level questions and hypotheses into computable statistical models. We present a mixed-methods study aimed at identifying the steps, considerations, and chal...
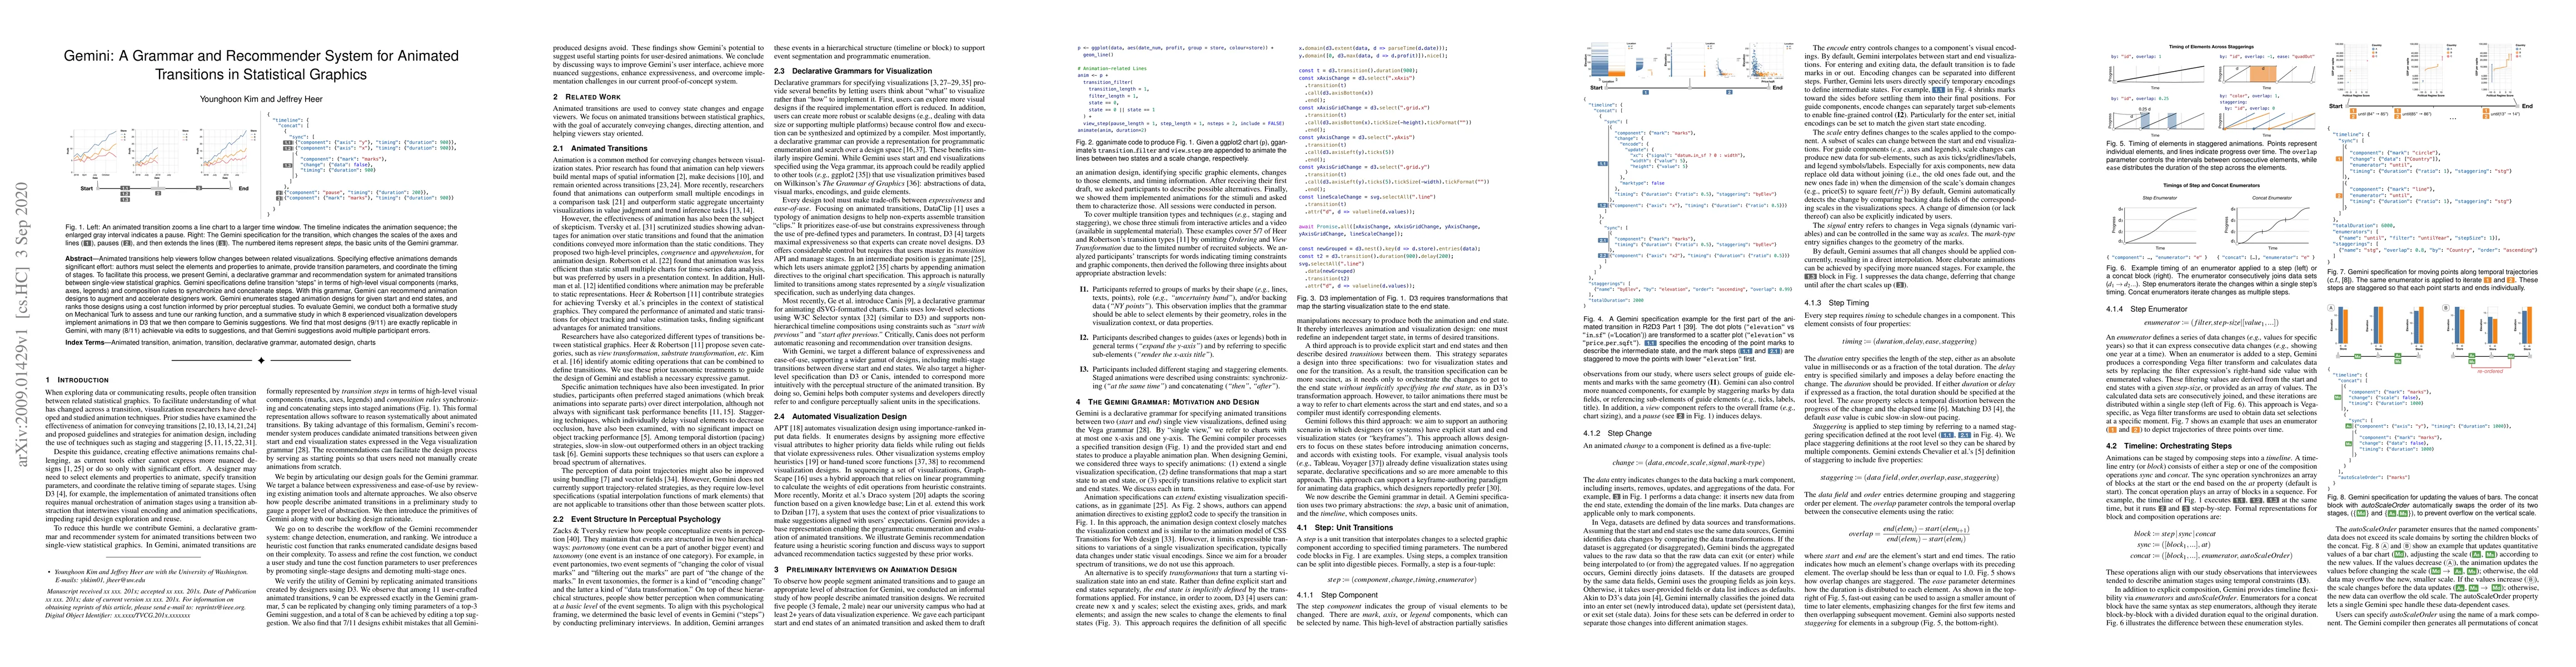
Animated transitions help viewers follow changes between related visualizations. Specifying effective animations demands significant effort: authors must select the elements and properties to animat...
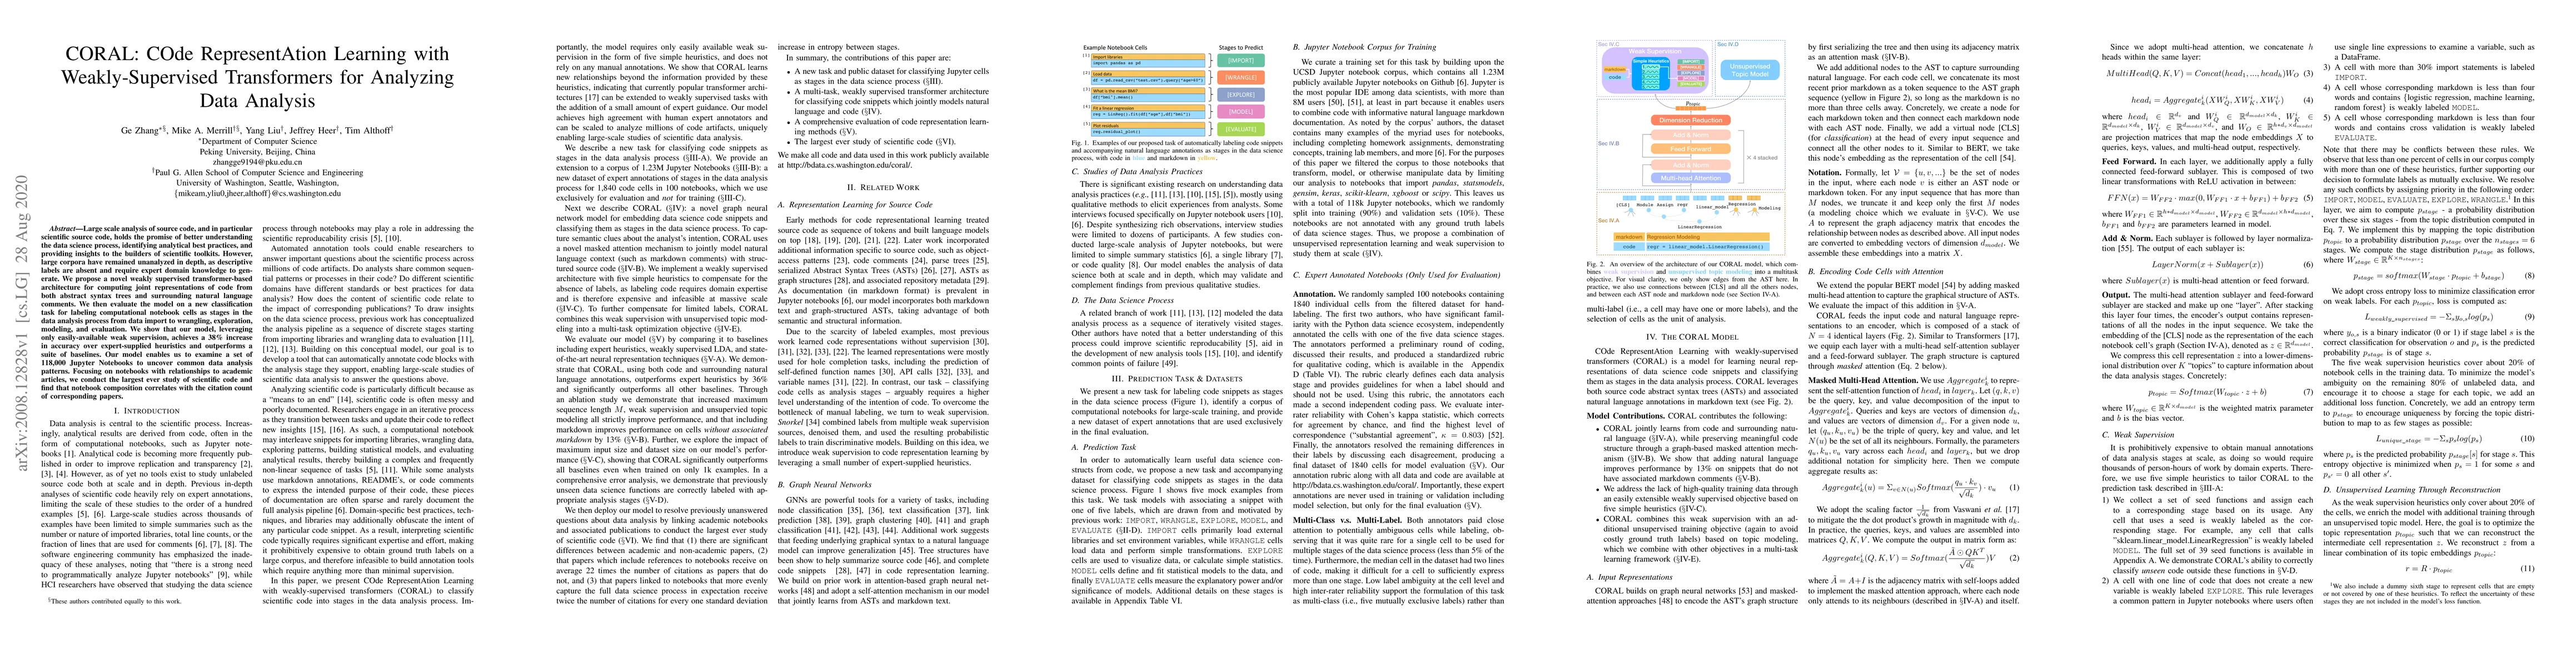
Large scale analysis of source code, and in particular scientific source code, holds the promise of better understanding the data science process, identifying analytical best practices, and providin...
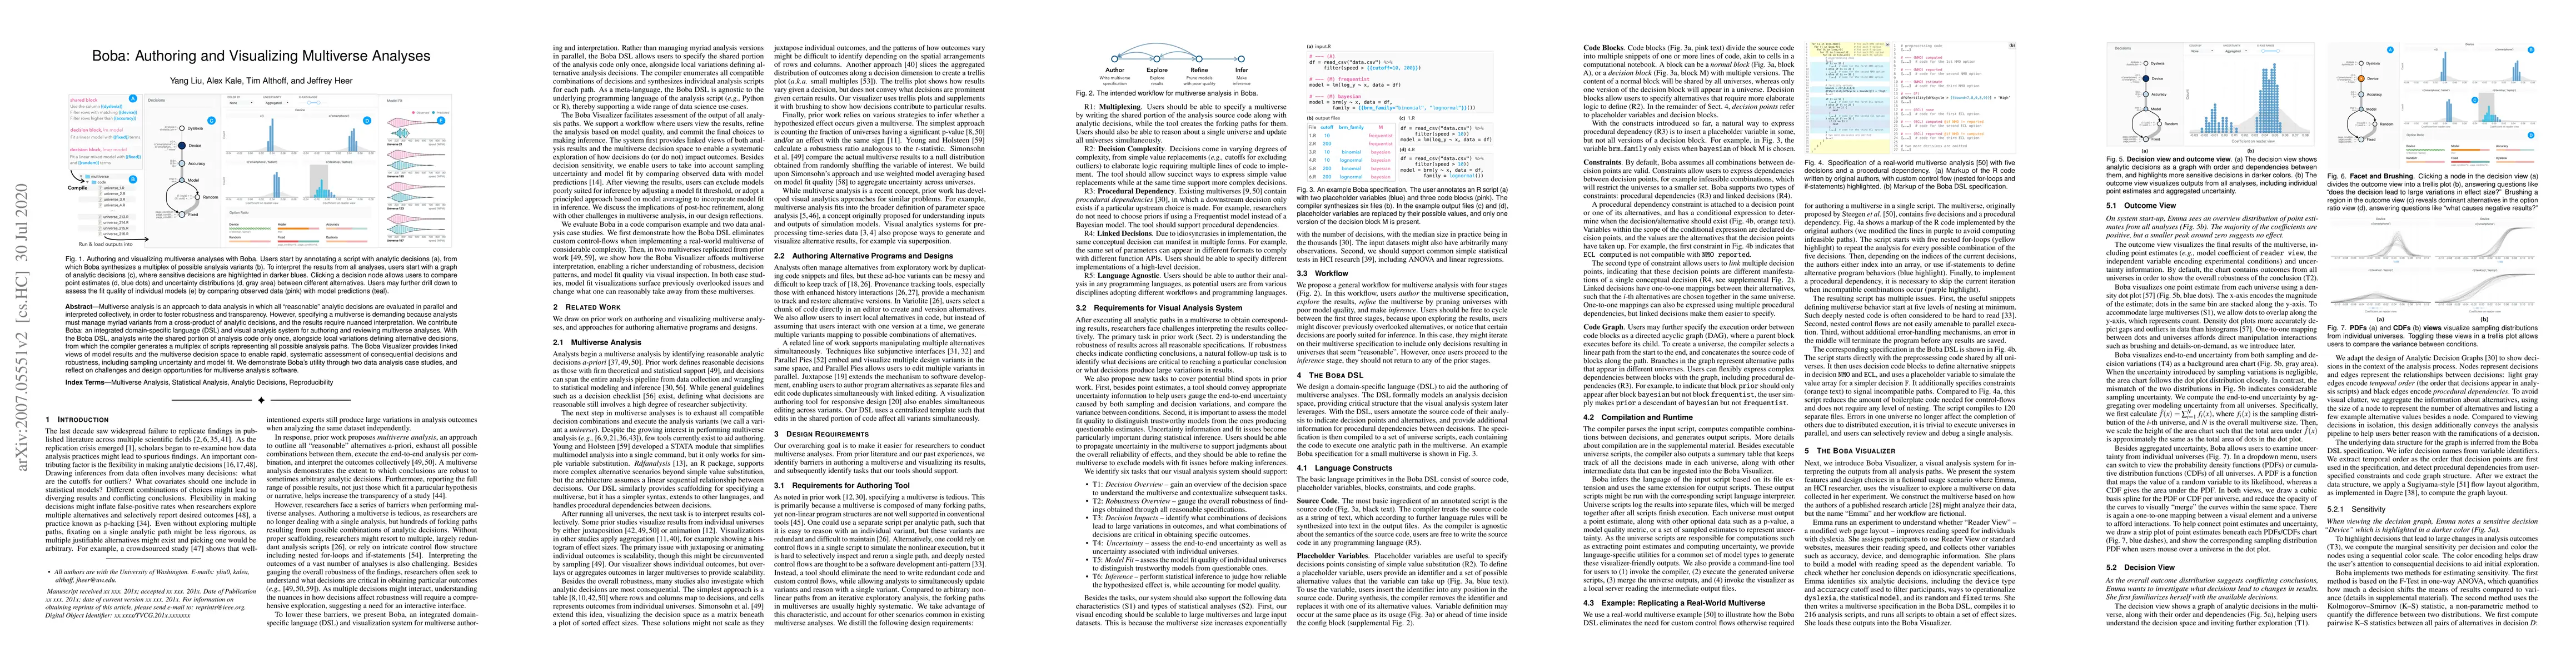
Multiverse analysis is an approach to data analysis in which all "reasonable" analytic decisions are evaluated in parallel and interpreted collectively, in order to foster robustness and transparenc...
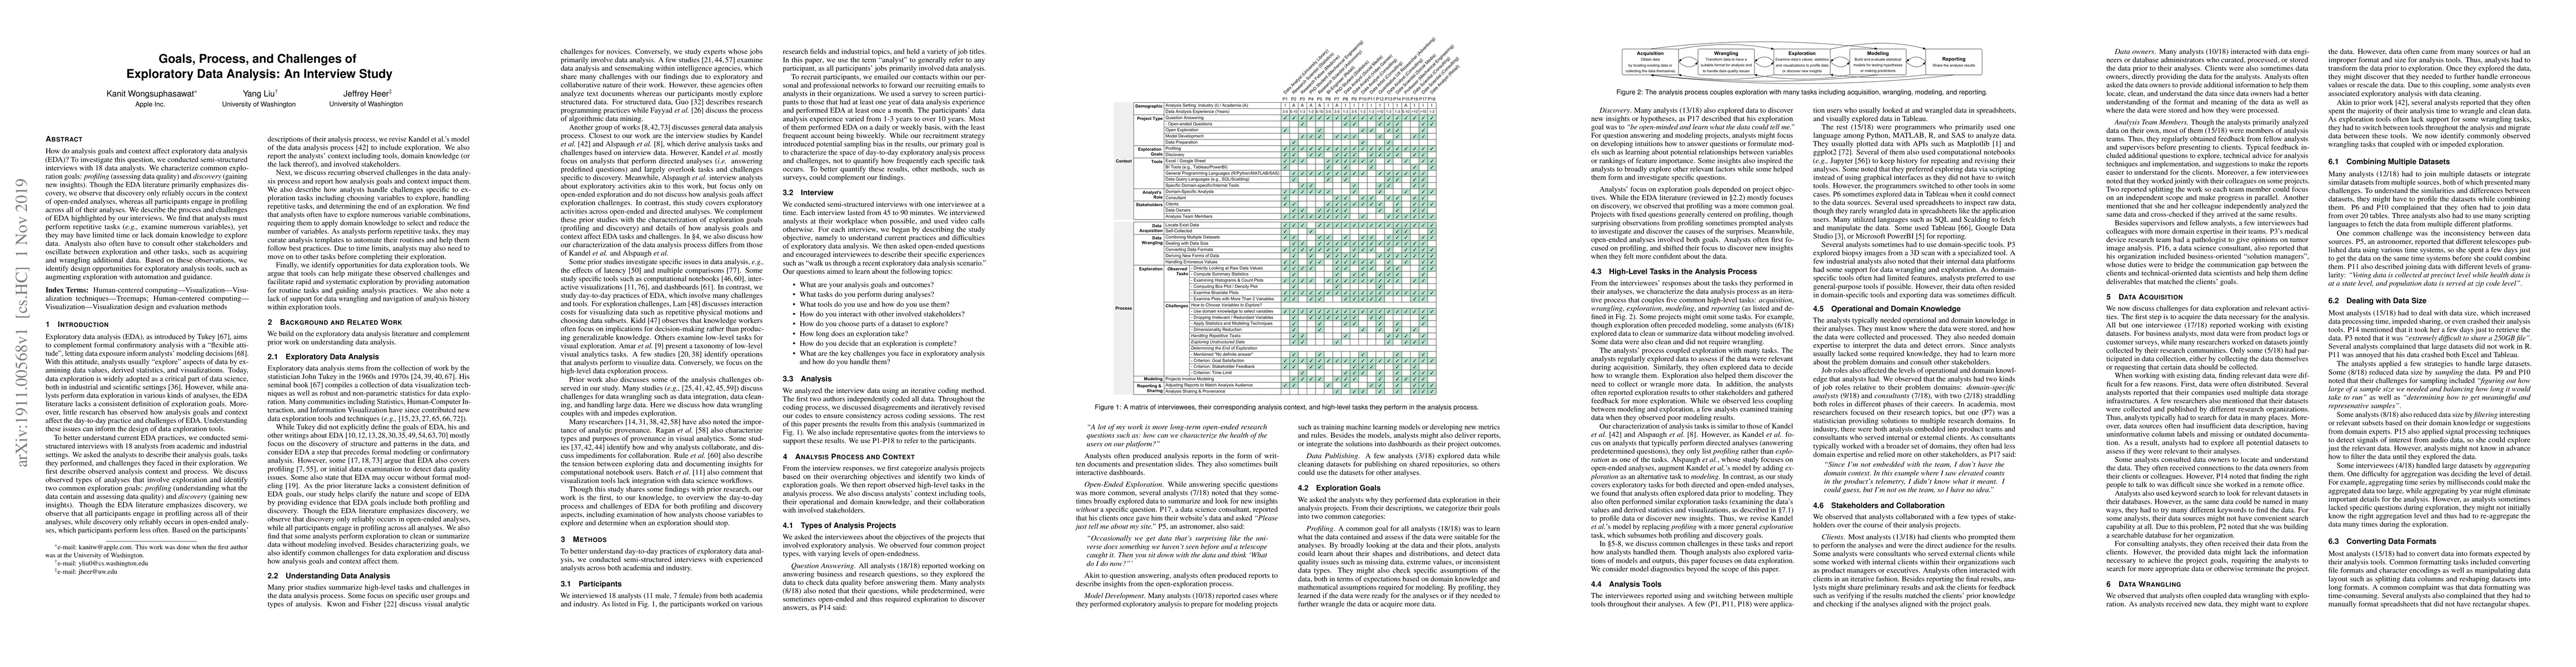
How do analysis goals and context affect exploratory data analysis (EDA)? To investigate this question, we conducted semi-structured interviews with 18 data analysts. We characterize common explorat...
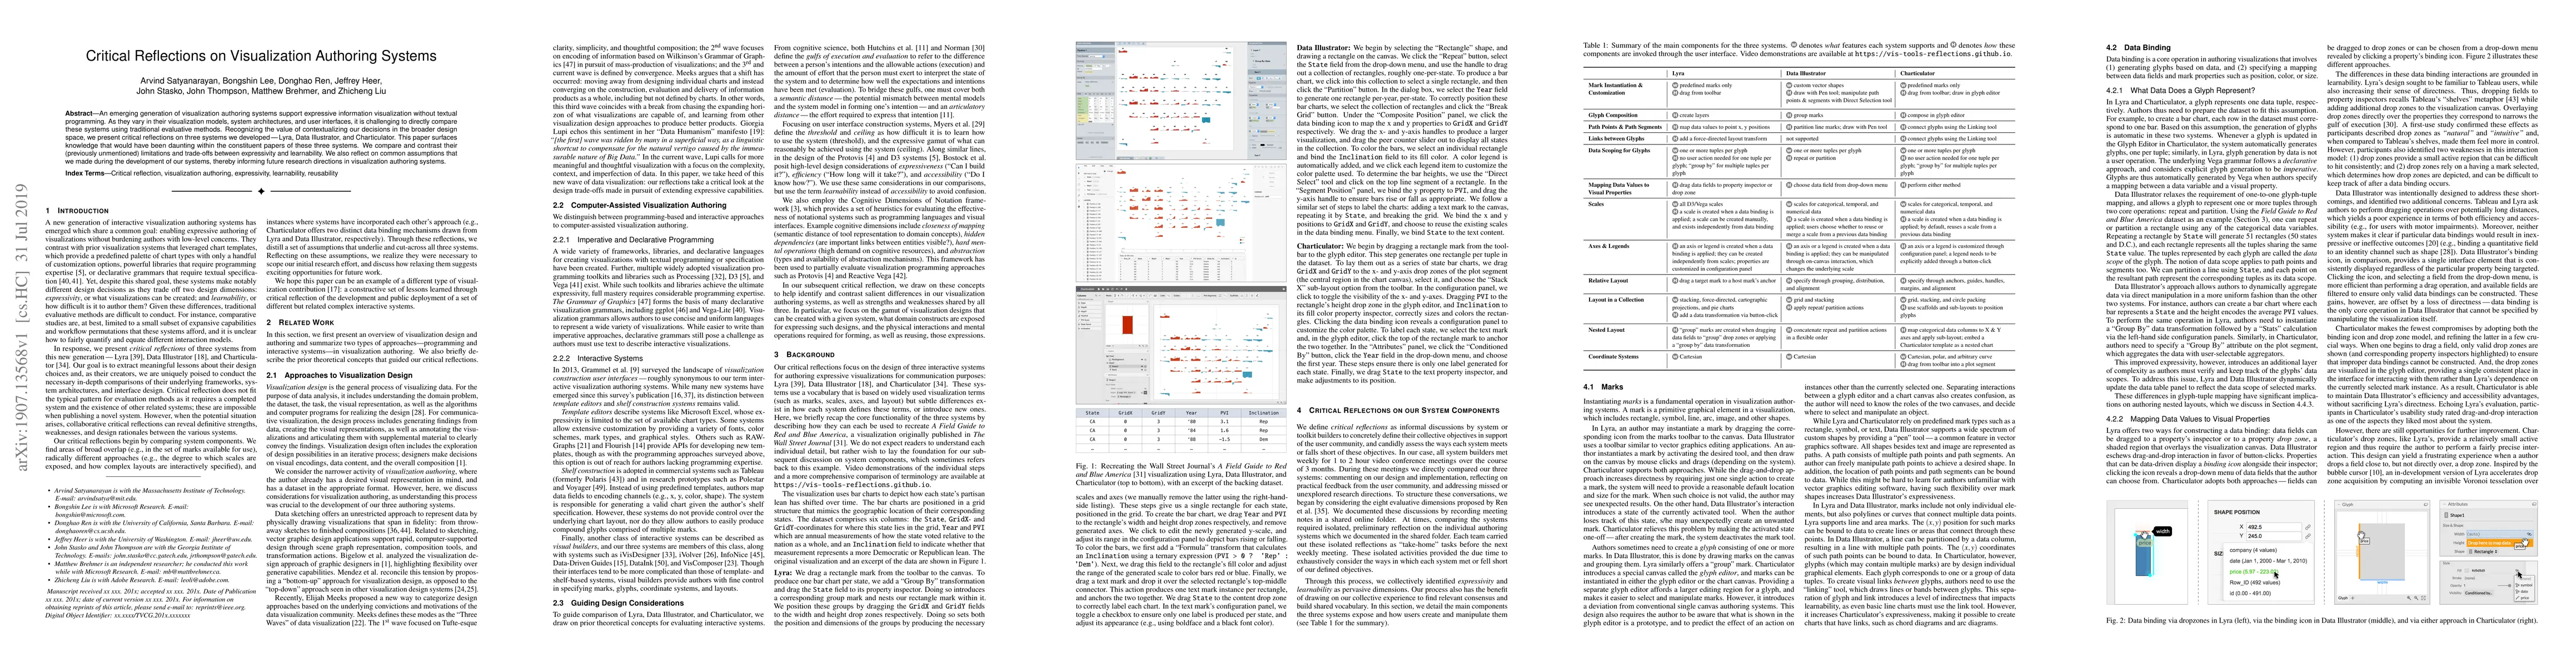
An emerging generation of visualization authoring systems support expressive information visualization without textual programming. As they vary in their visualization models, system architectures, ...
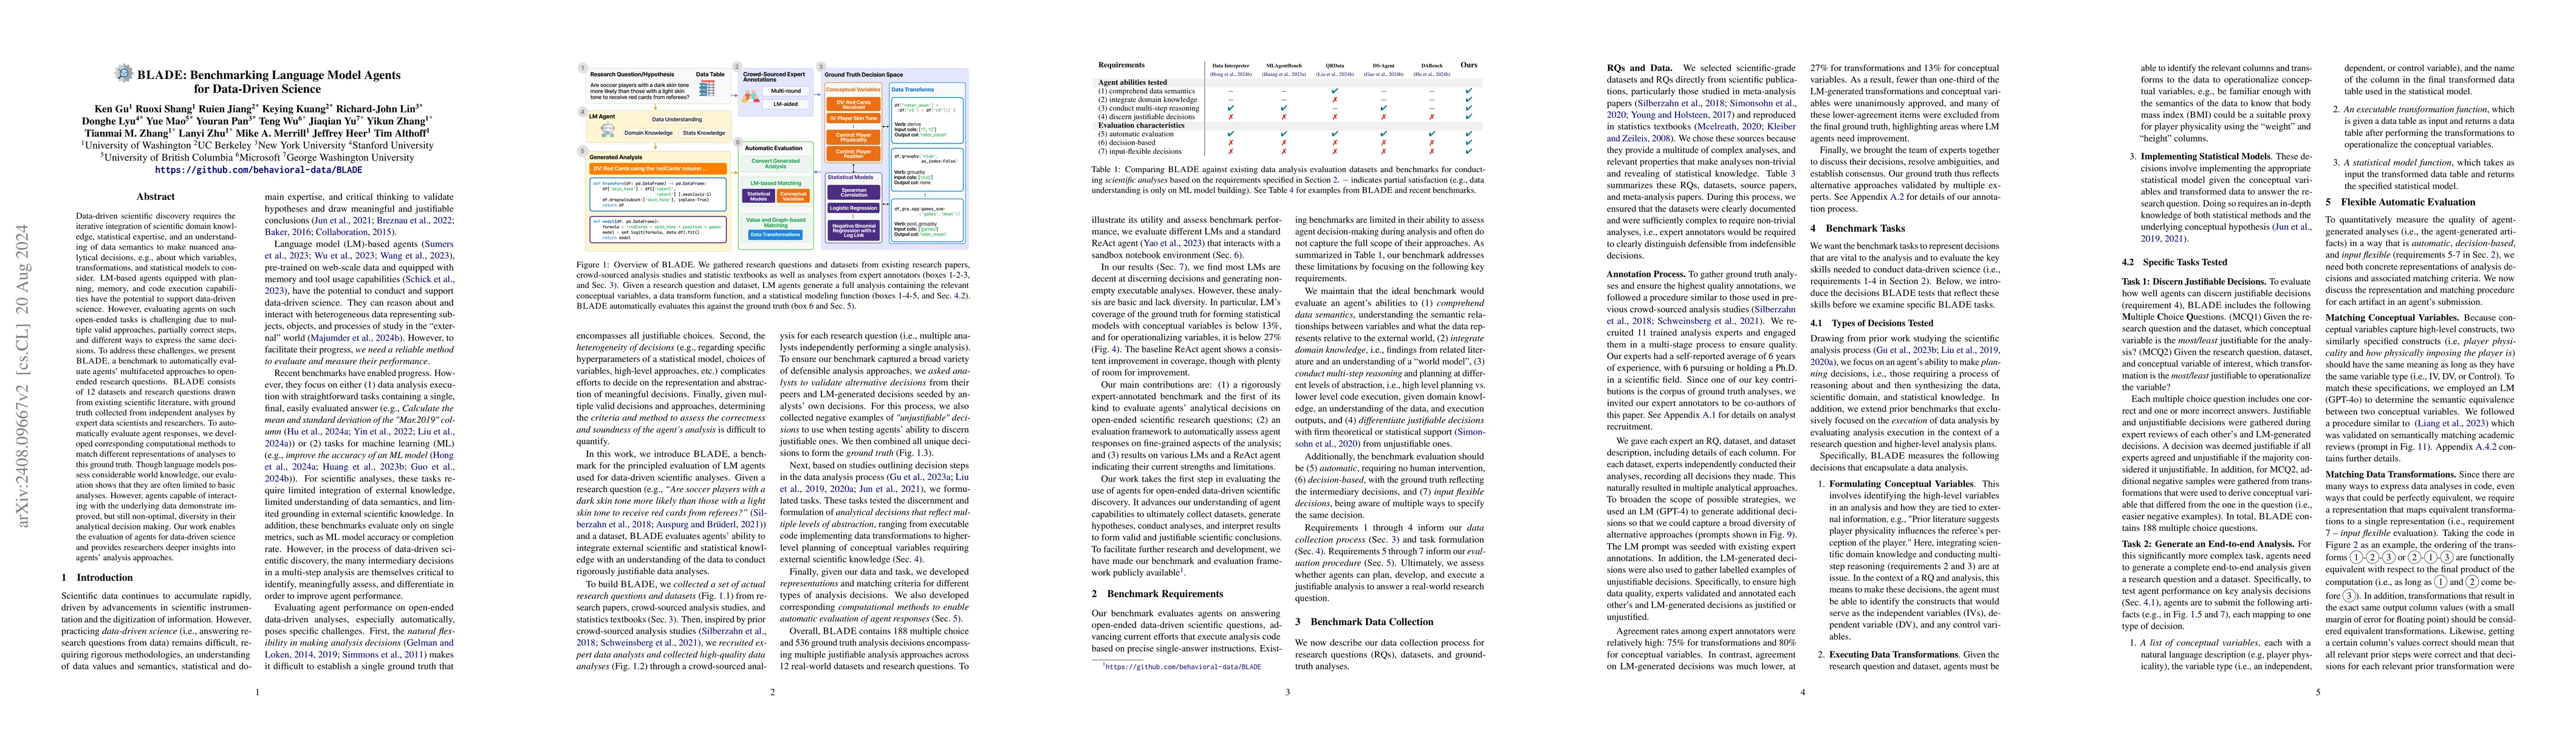
Data-driven scientific discovery requires the iterative integration of scientific domain knowledge, statistical expertise, and an understanding of data semantics to make nuanced analytical decisions, ...
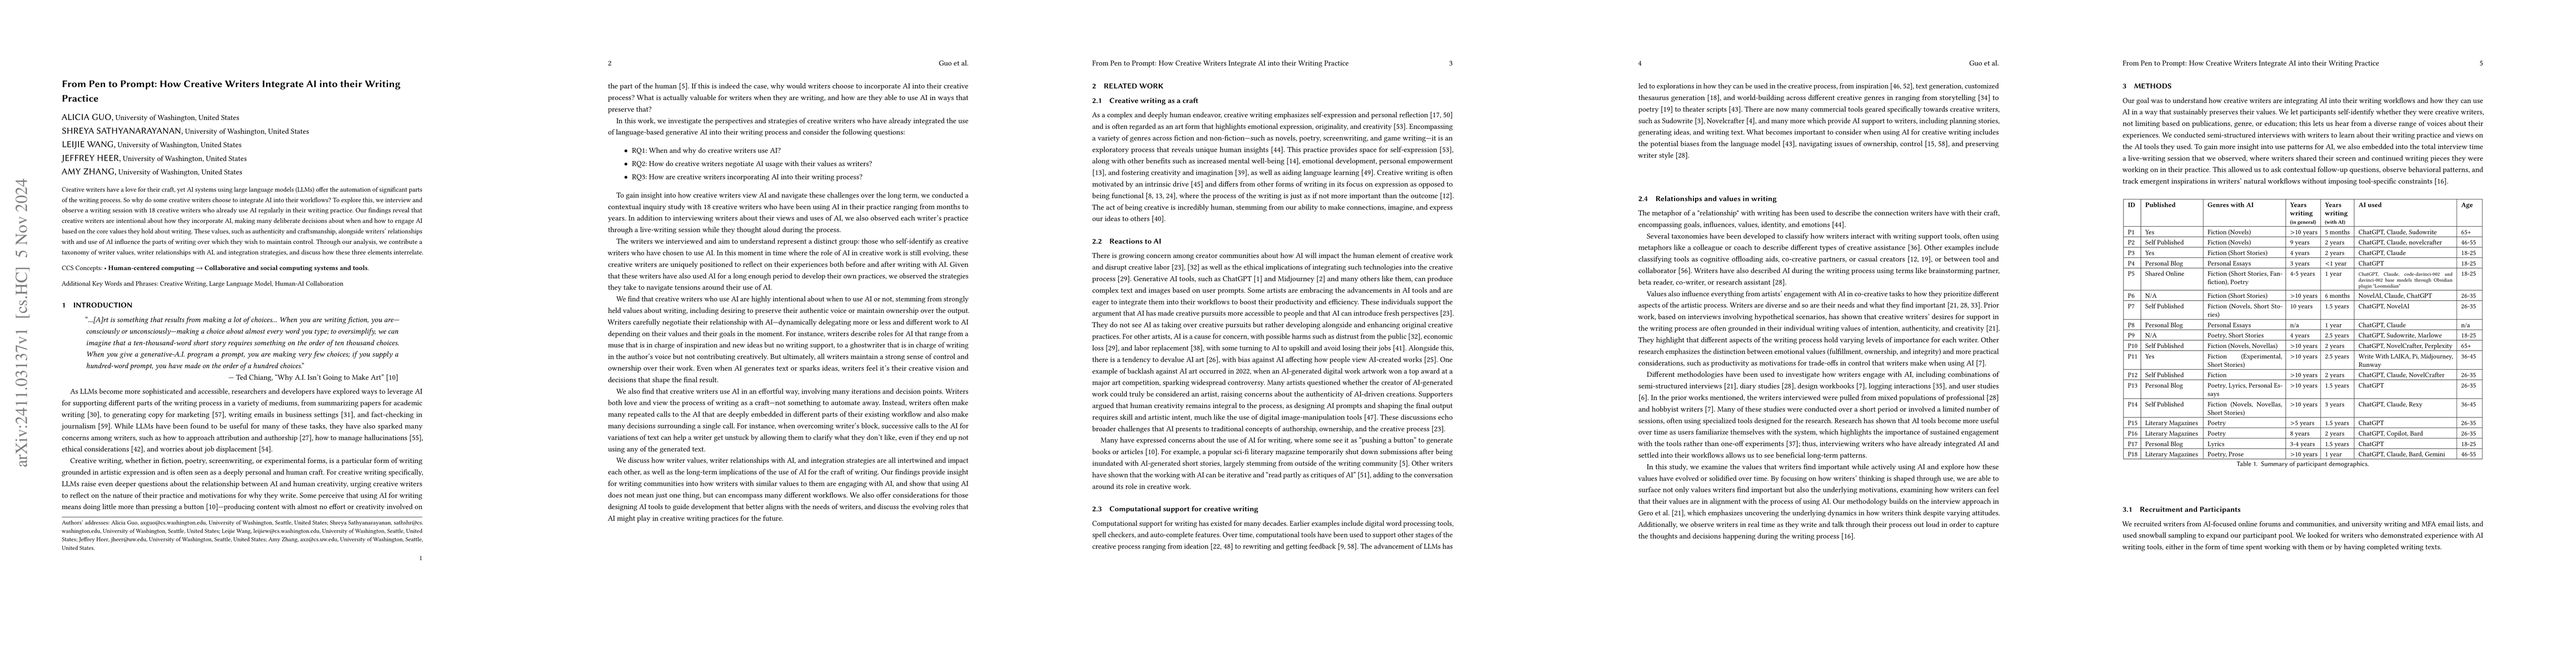
Creative writers have a love for their craft, yet AI systems using large language models (LLMs) offer the automation of significant parts of the writing process. So why do some creative writers choose...
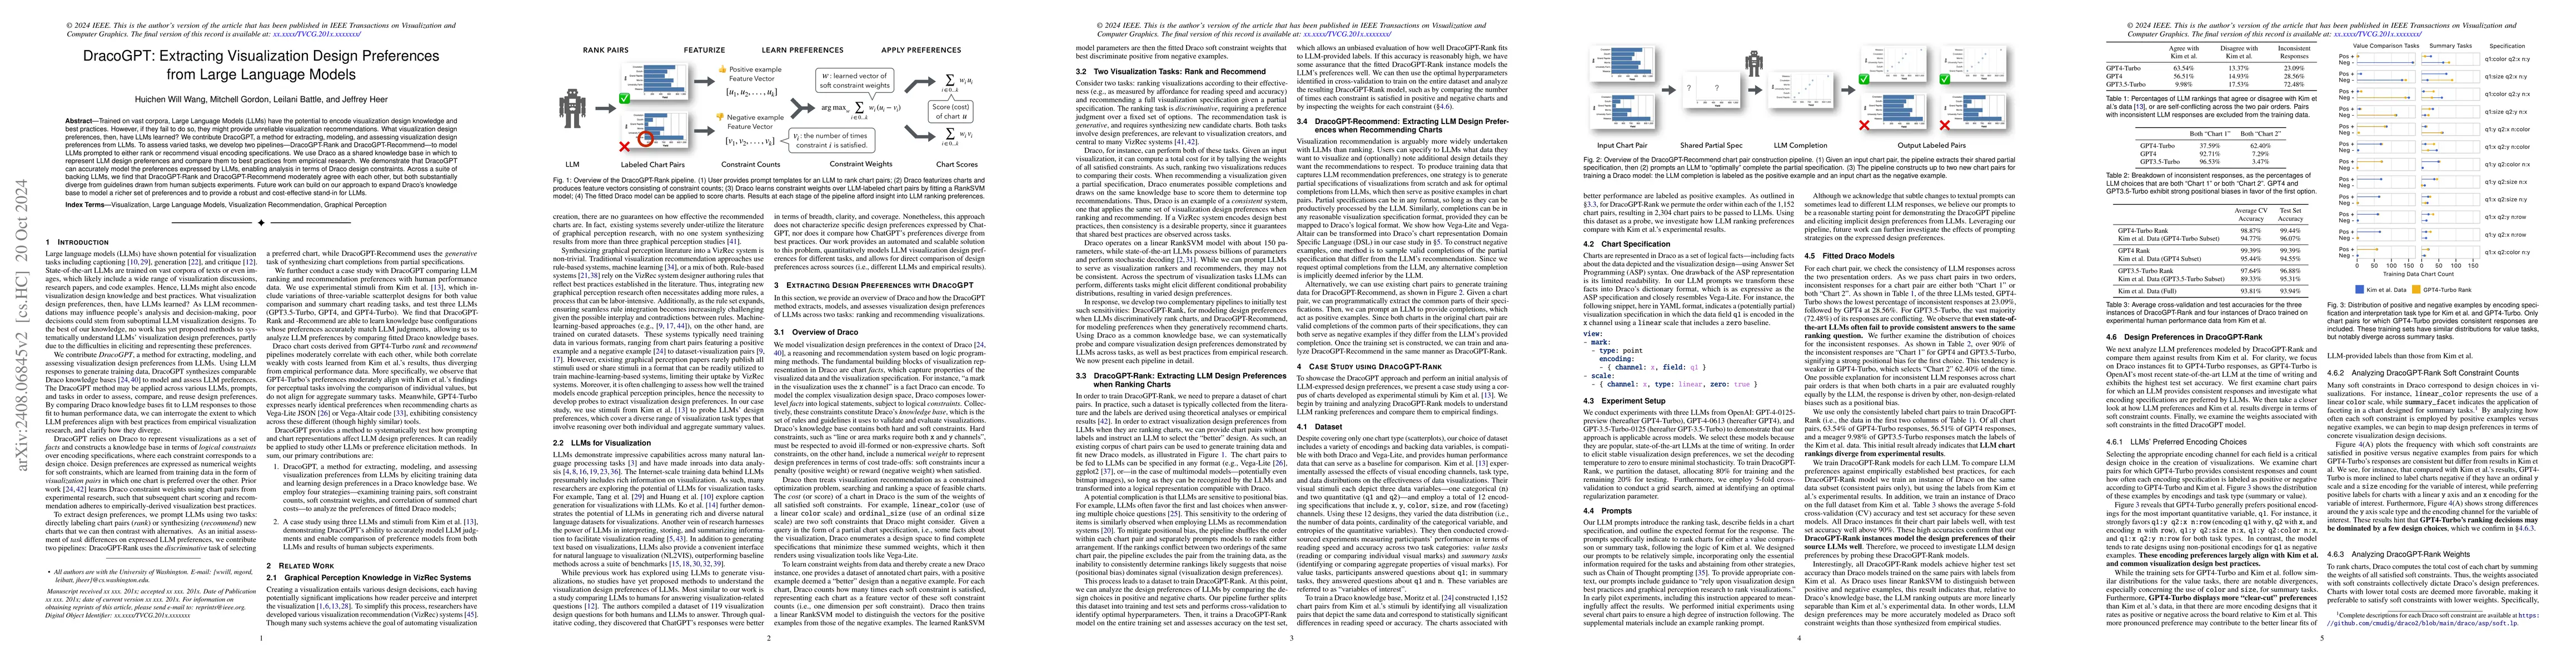
Trained on vast corpora, Large Language Models (LLMs) have the potential to encode visualization design knowledge and best practices. However, if they fail to do so, they might provide unreliable visu...
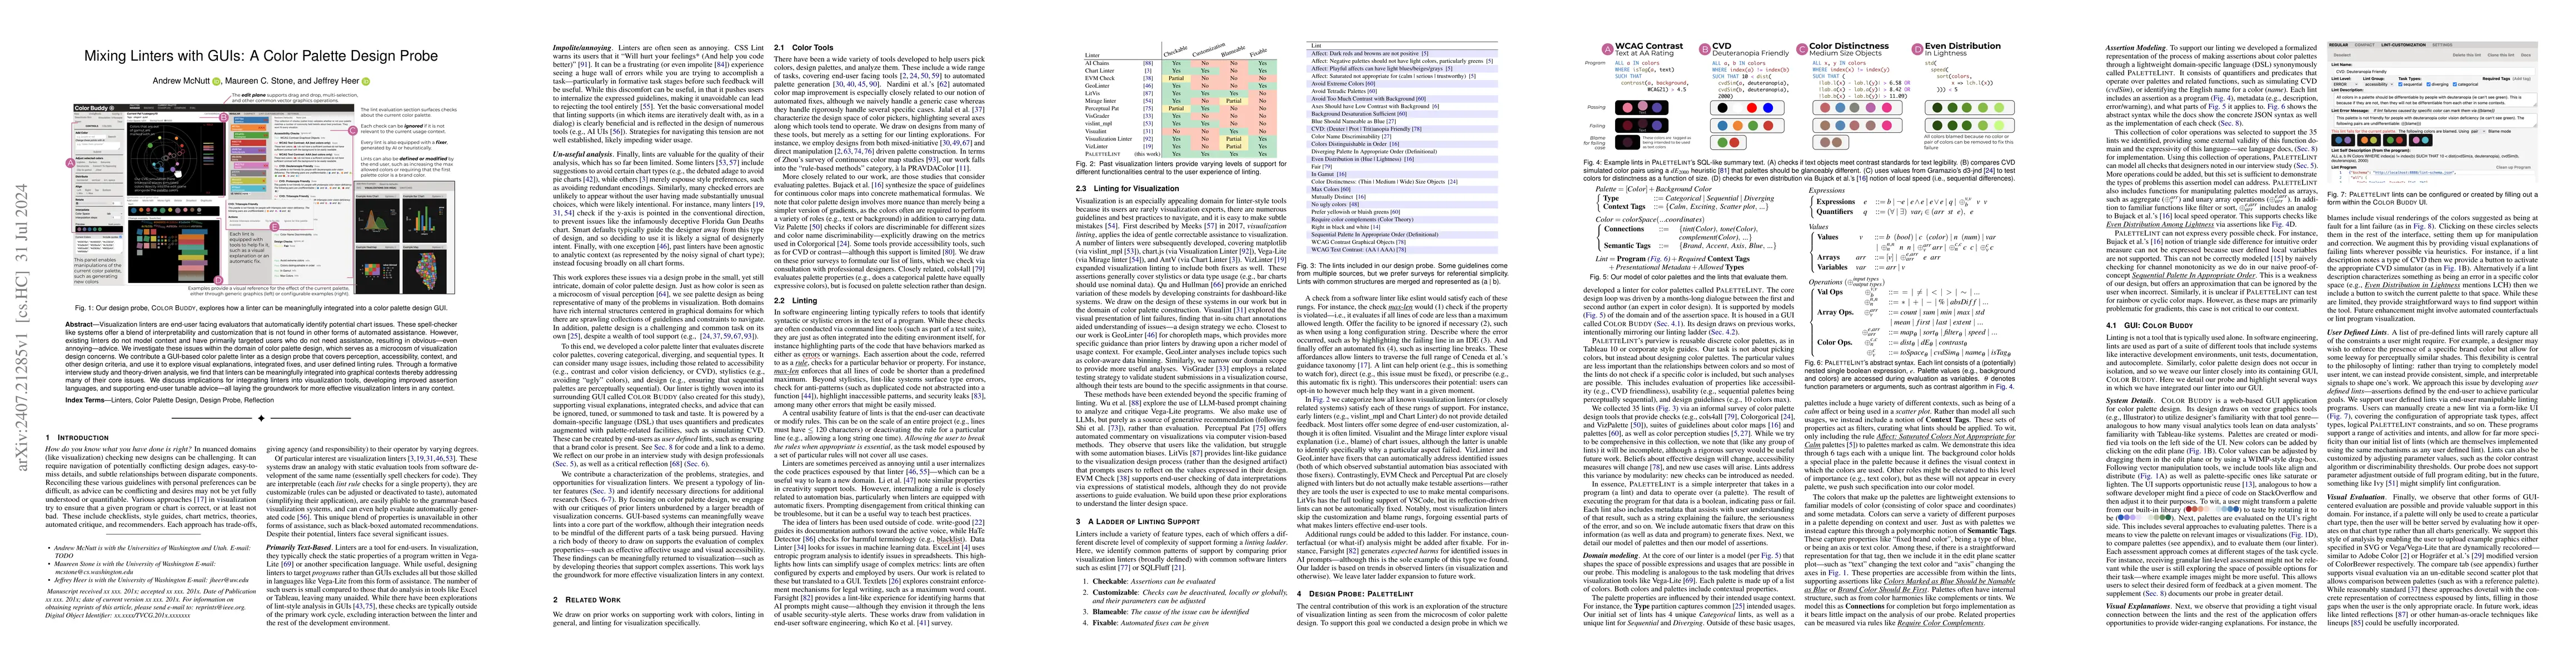
Visualization linters are end-user facing evaluators that automatically identify potential chart issues. These spell-checker like systems offer a blend of interpretability and customization that is no...
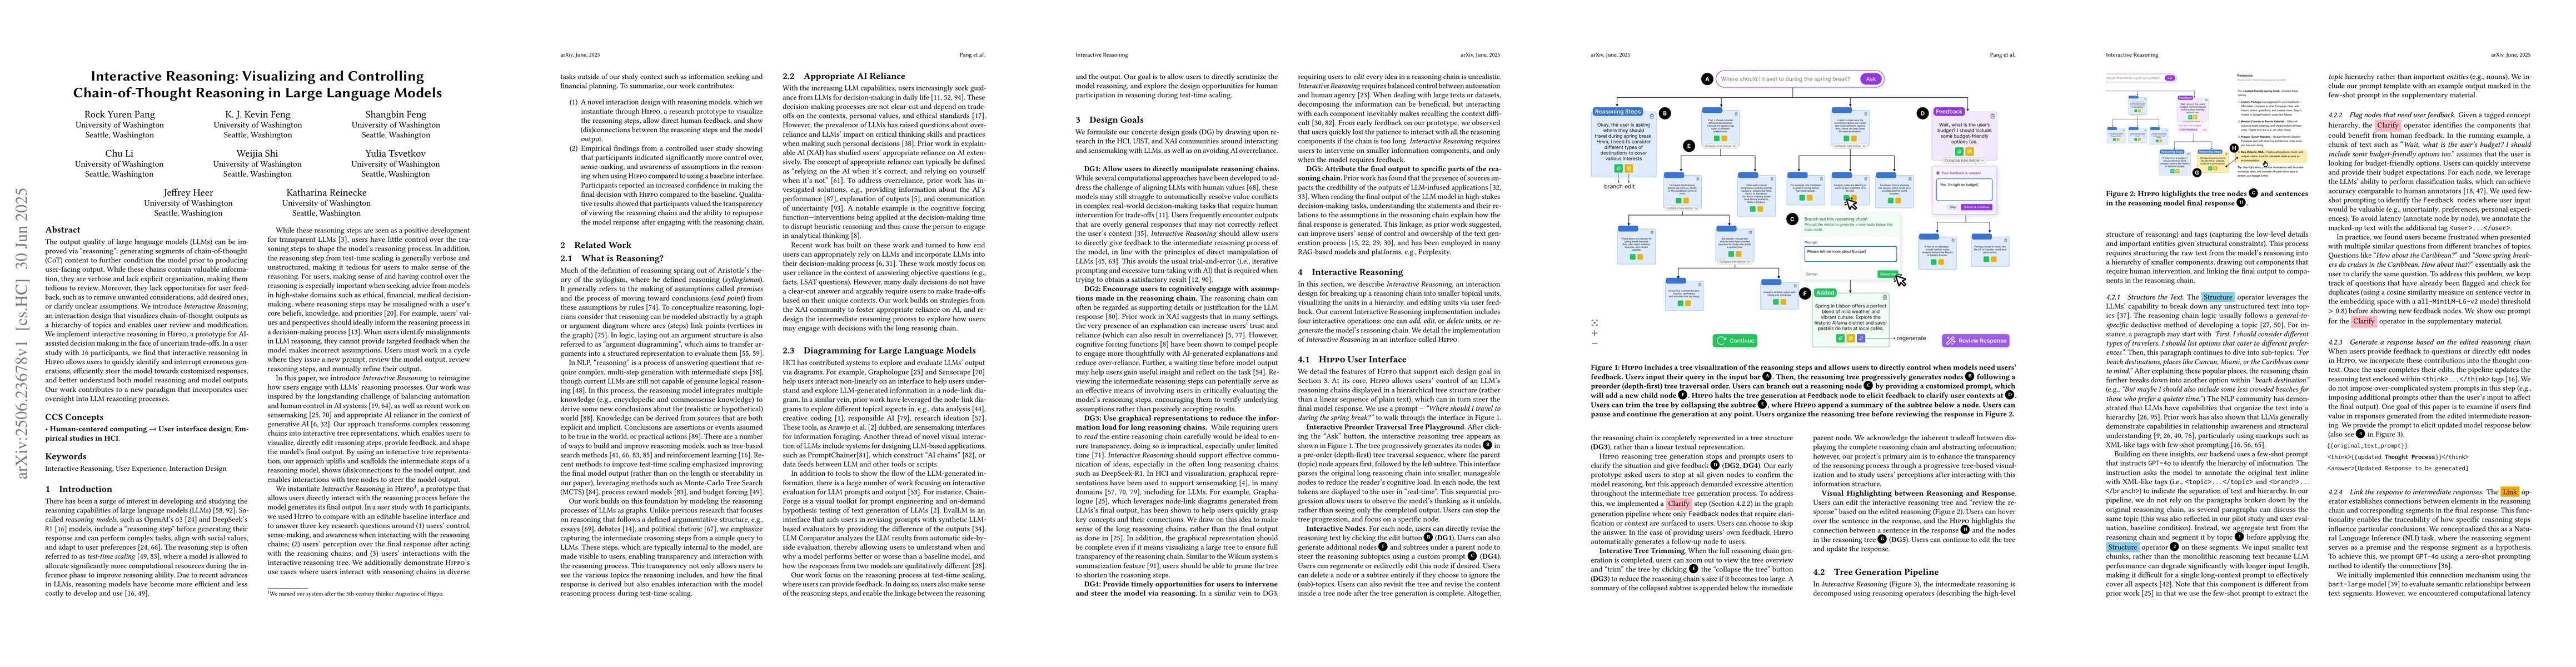
The output quality of large language models (LLMs) can be improved via "reasoning": generating segments of chain-of-thought (CoT) content to further condition the model prior to producing user-facing ...
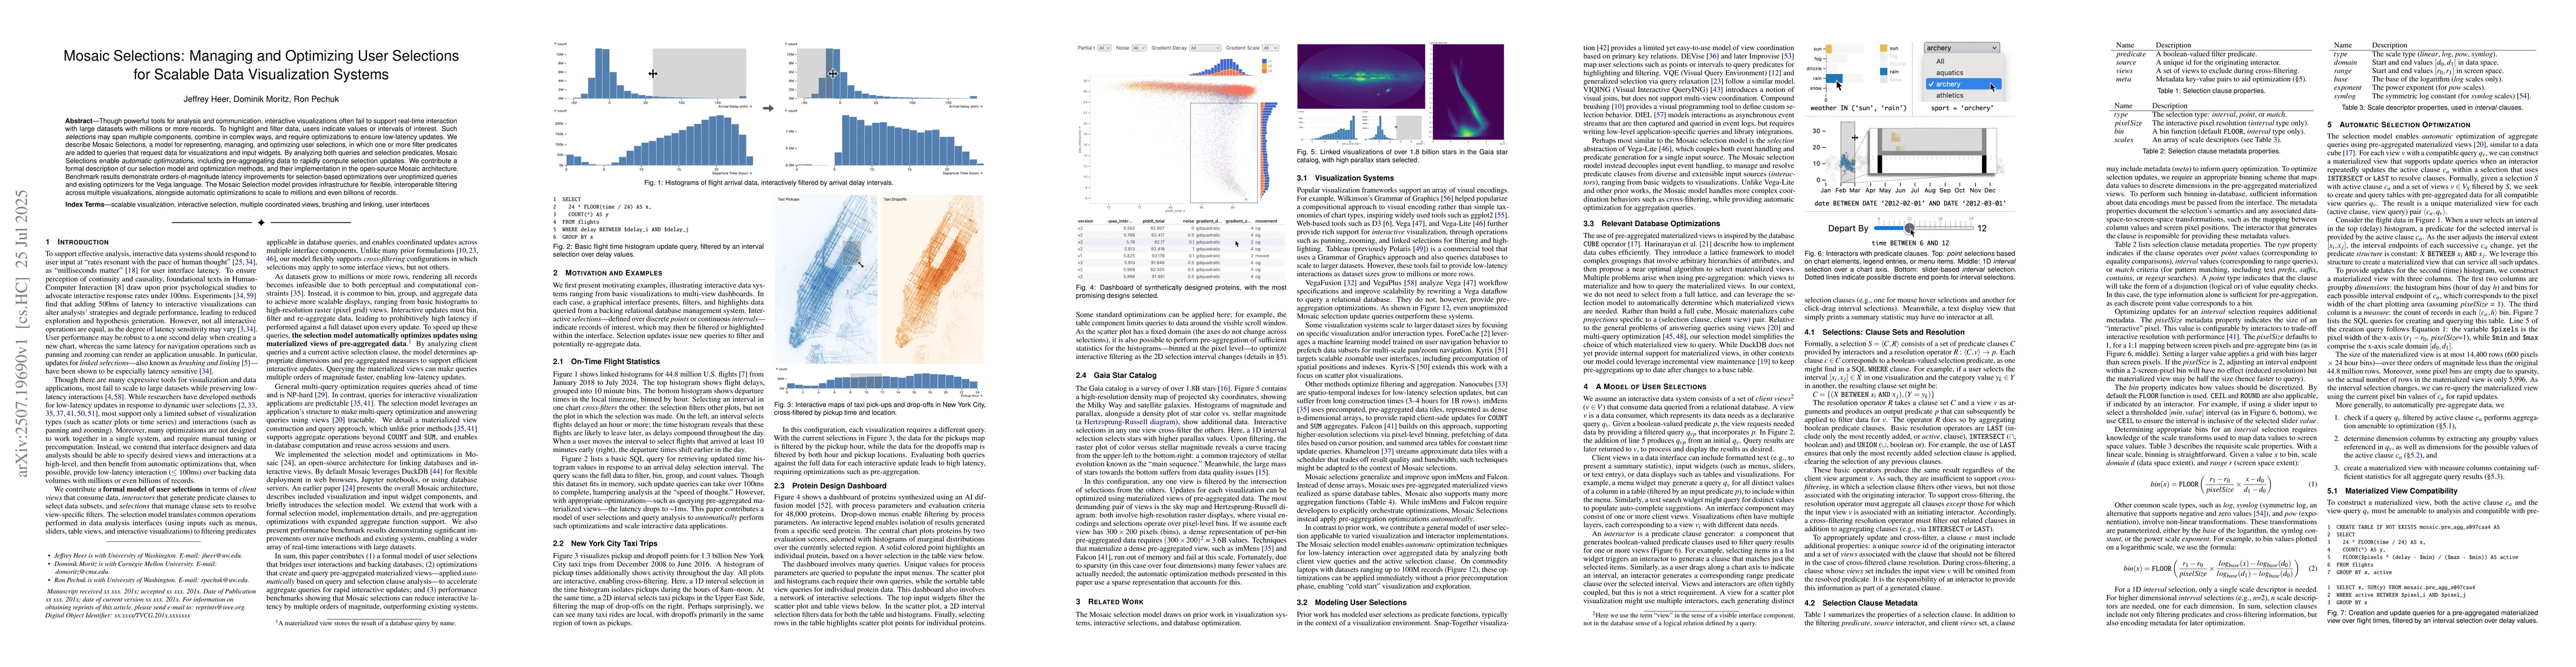
Though powerful tools for analysis and communication, interactive visualizations often fail to support real-time interaction with large datasets with millions or more records. To highlight and filter ...
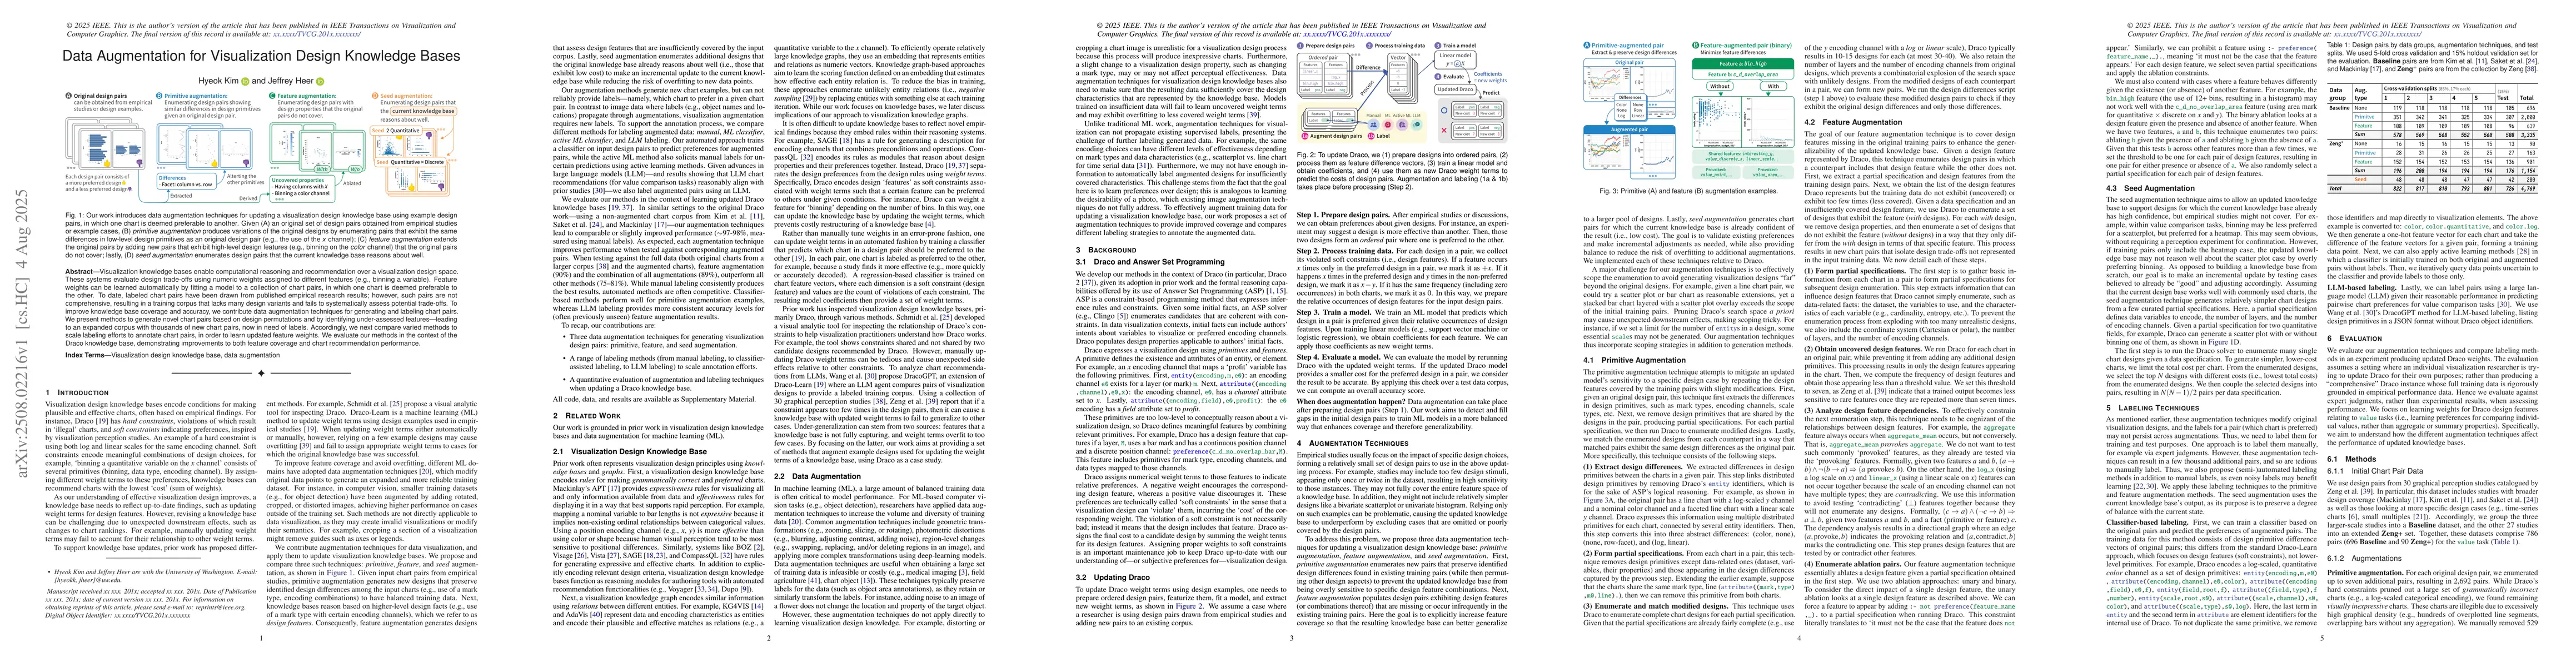
Visualization knowledge bases enable computational reasoning and recommendation over a visualization design space. These systems evaluate design trade-offs using numeric weights assigned to different ...
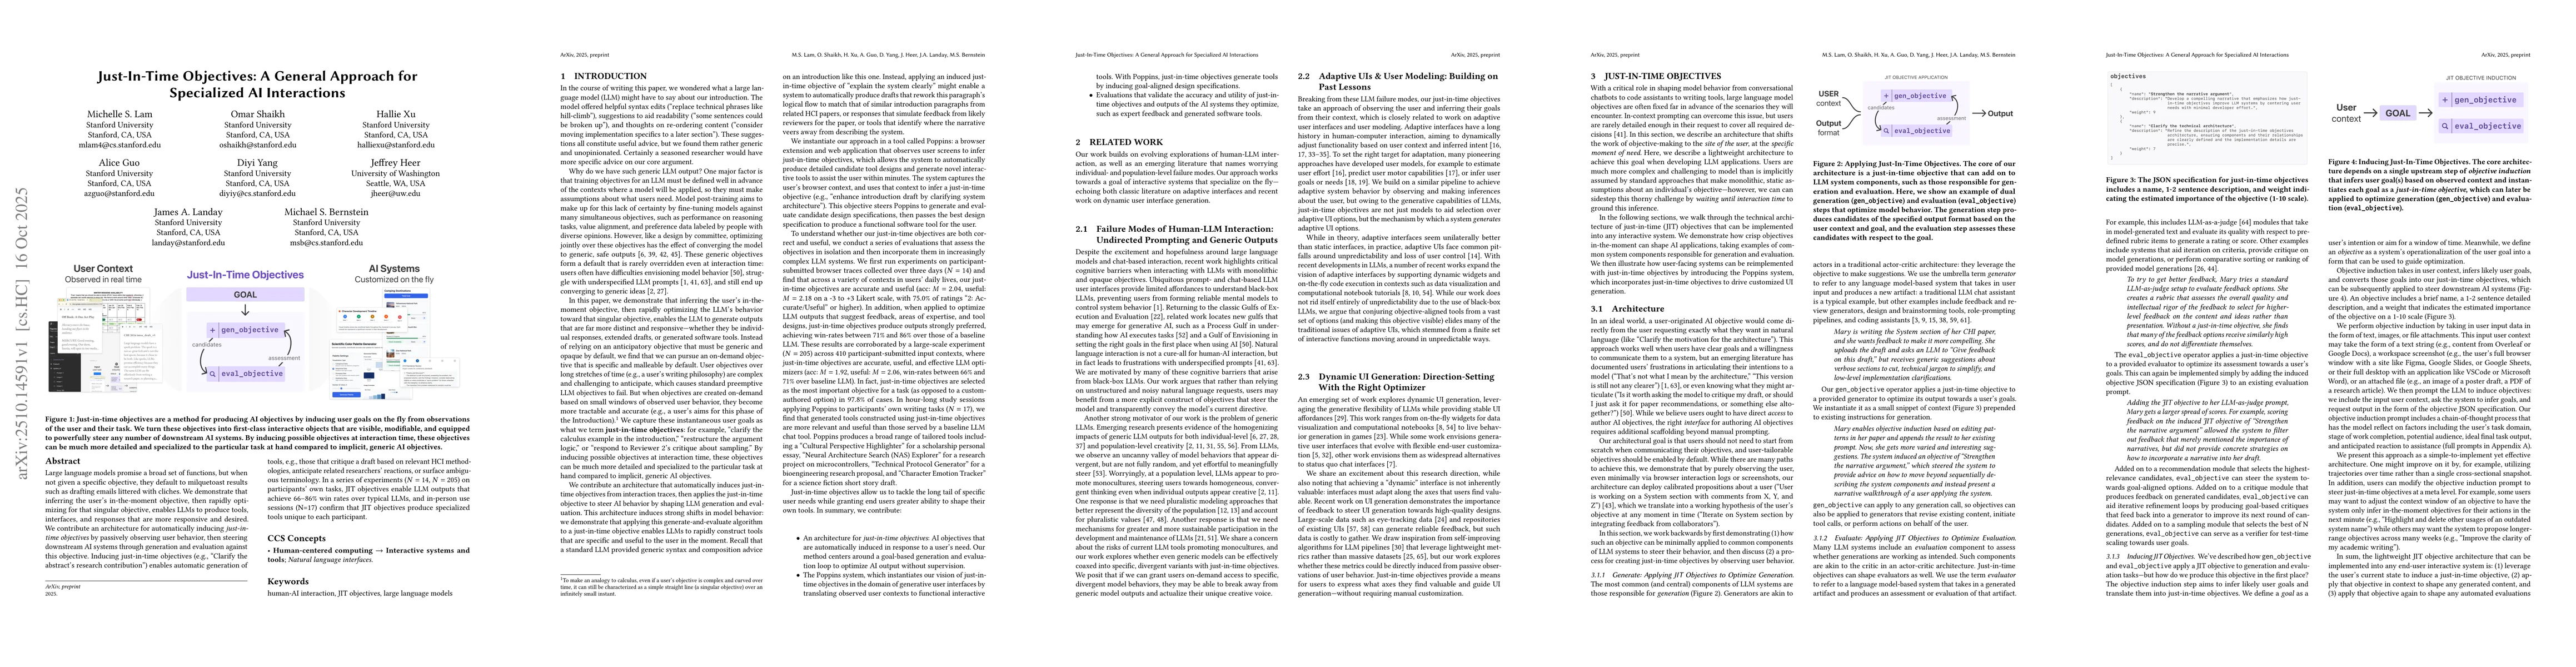
Large language models promise a broad set of functions, but when not given a specific objective, they default to milquetoast results such as drafting emails littered with cliches. We demonstrate that ...
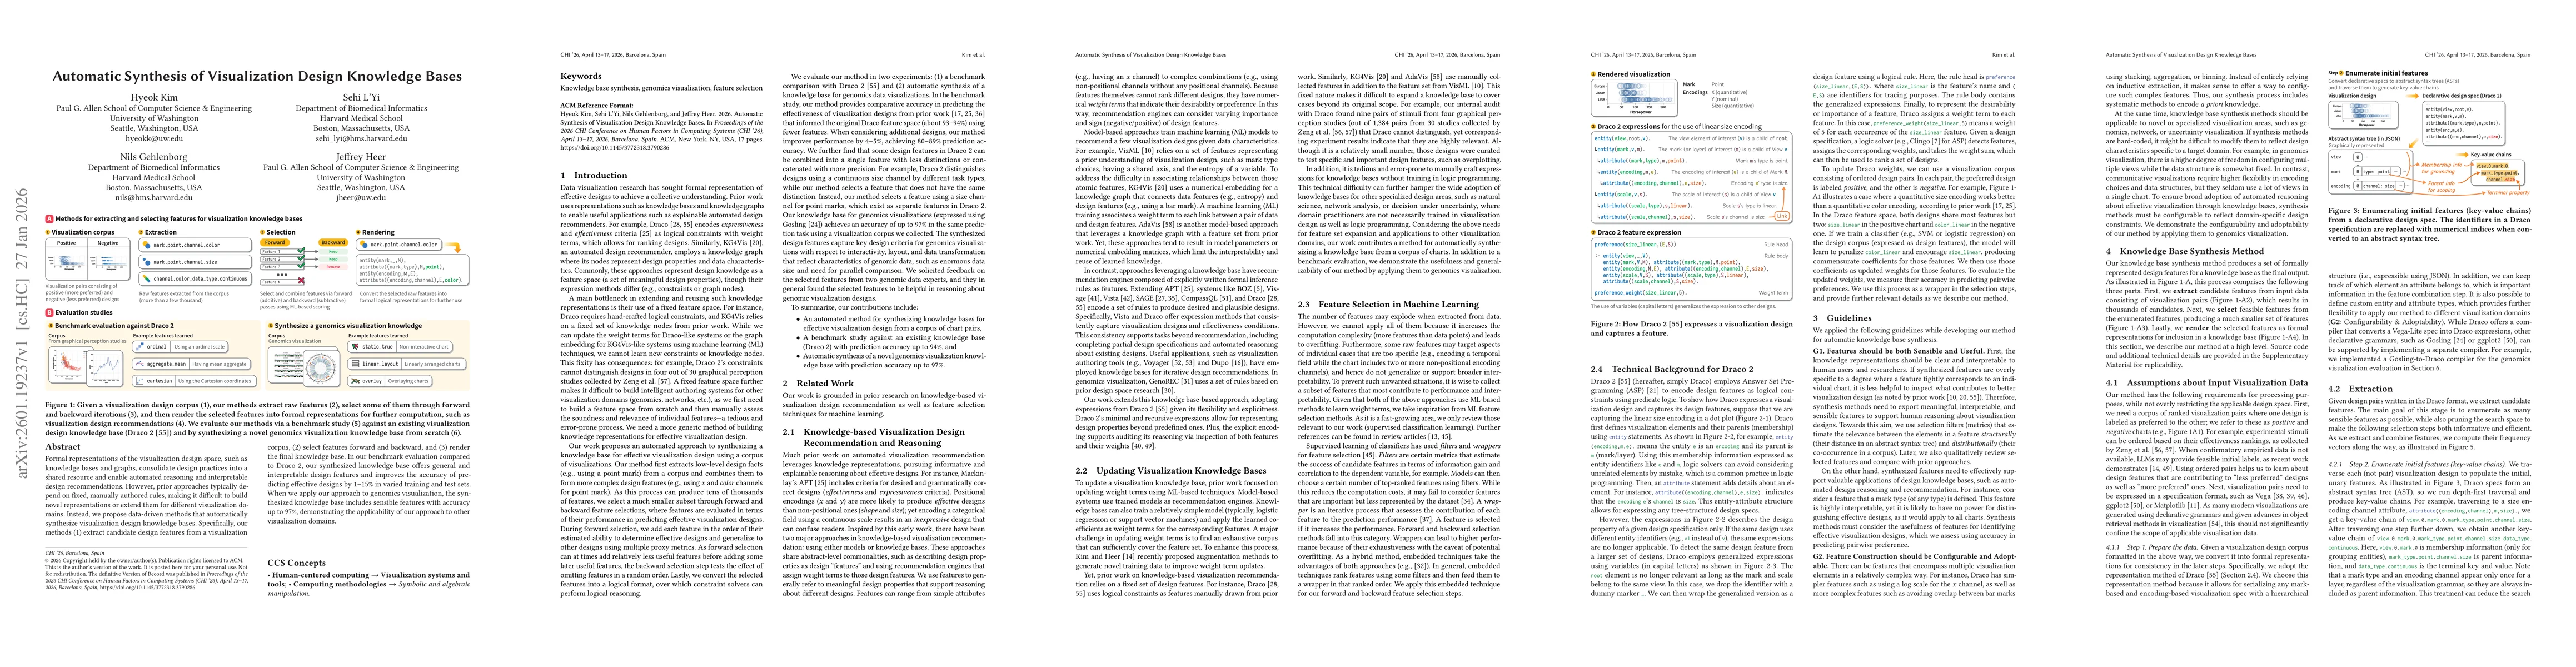
Formal representations of the visualization design space, such as knowledge bases and graphs, consolidate design practices into a shared resource and enable automated reasoning and interpretable desig...
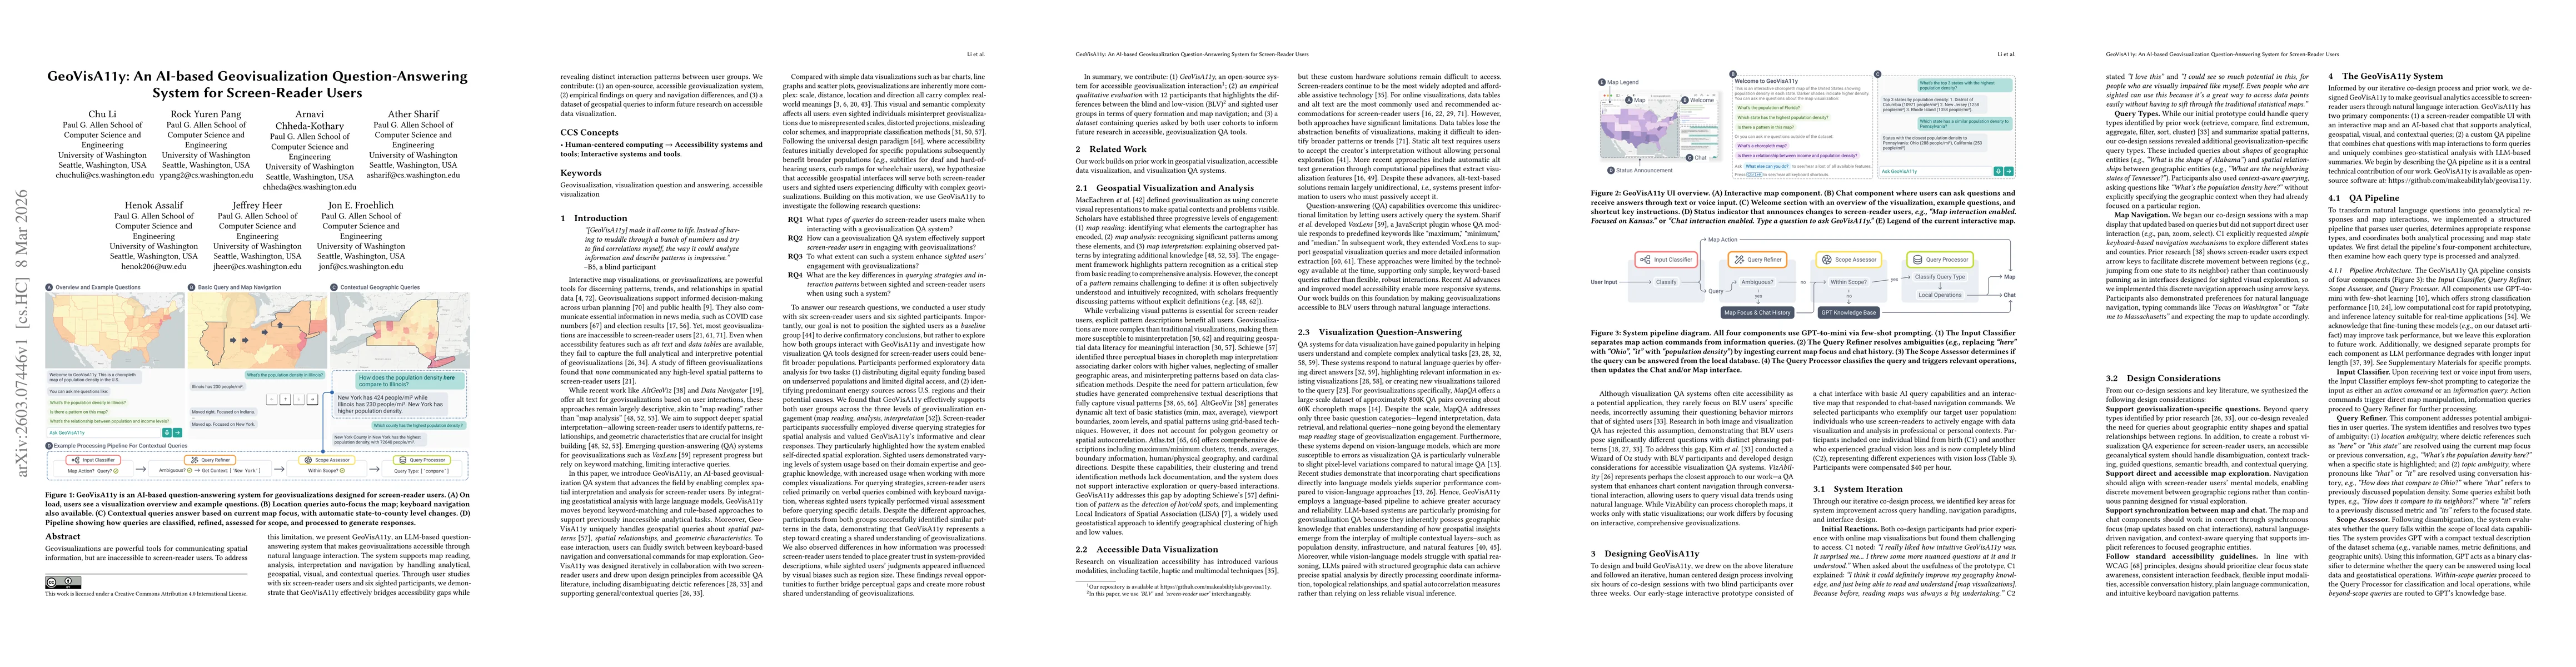
Geovisualizations are powerful tools for communicating spatial information, but are inaccessible to screen-reader users. To address this limitation, we present GeoVisA11y, an LLM-based question-answer...