Quick Summary:

DIVI is a novel approach for dynamically orchestrating interactions across various static visualizations by deconstructing SVG charts to infer content and coordinate user input. It supports dynamic interaction without prior specification through a taxonomy and demonstrates effectiveness in rapid data exploration via a usability study.

Summary

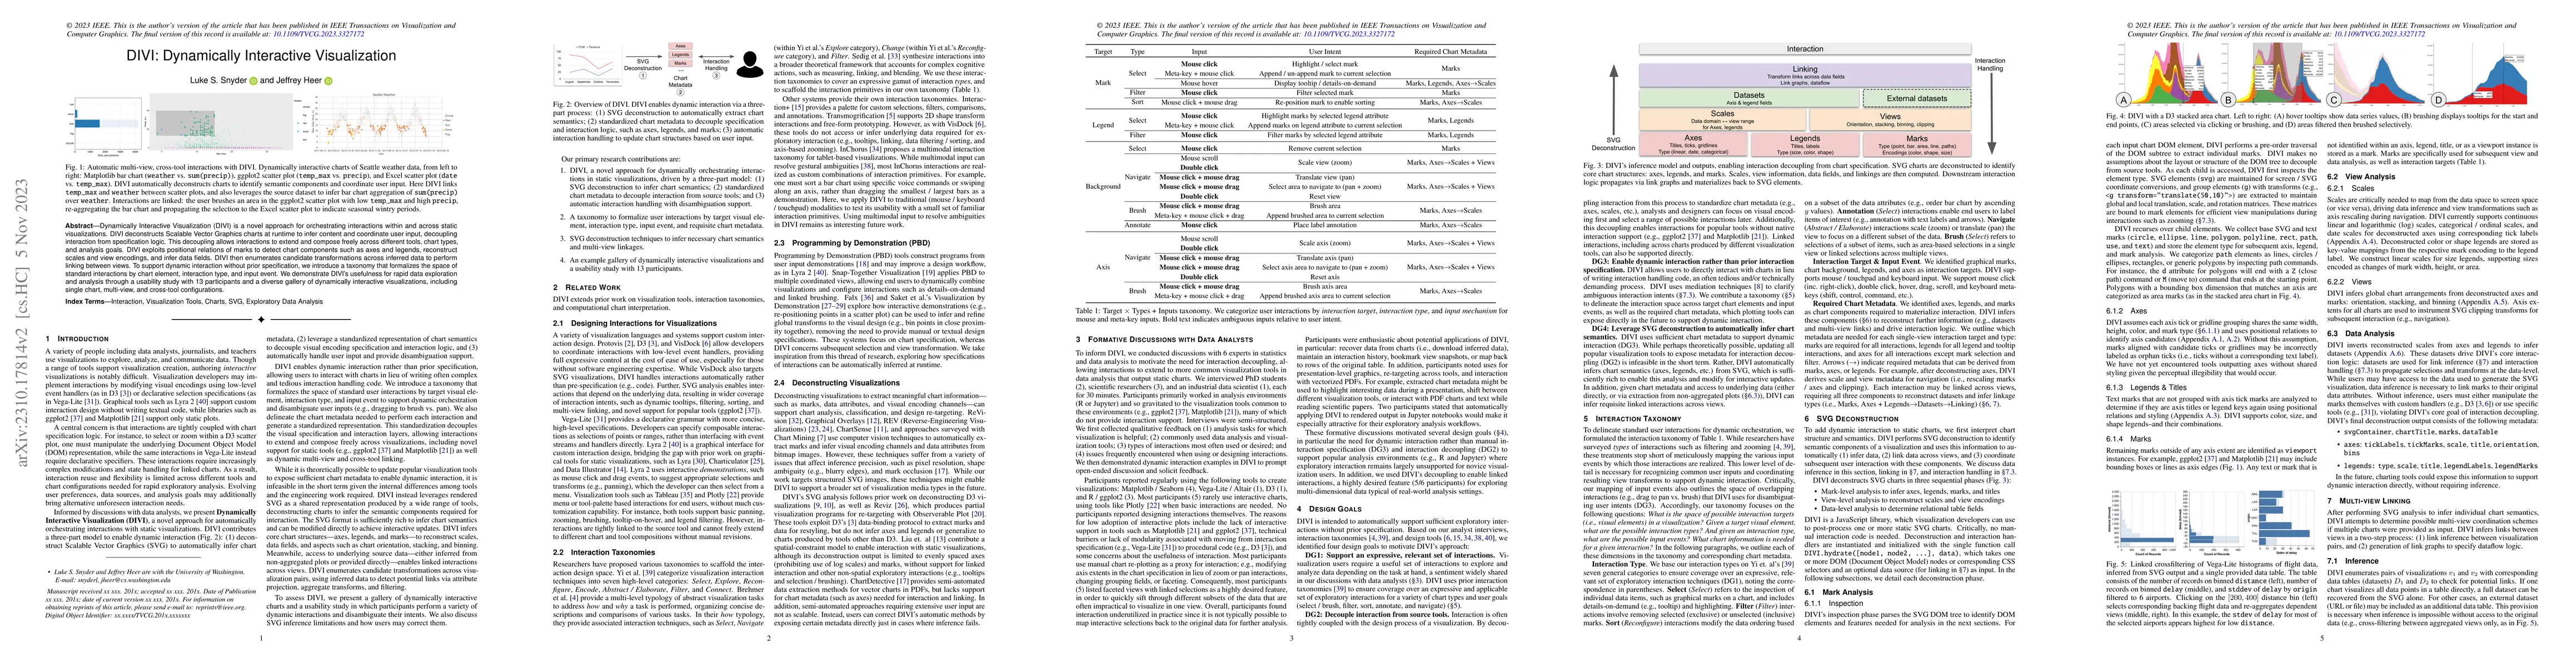
Dynamically Interactive Visualization (DIVI) is a novel approach for orchestrating interactions within and across static visualizations. DIVI deconstructs Scalable Vector Graphics charts at runtime to infer content and coordinate user input, decoupling interaction from specification logic. This decoupling allows interactions to extend and compose freely across different tools, chart types, and analysis goals. DIVI exploits positional relations of marks to detect chart components such as axes and legends, reconstruct scales and view encodings, and infer data fields. DIVI then enumerates candidate transformations across inferred data to perform linking between views. To support dynamic interaction without prior specification, we introduce a taxonomy that formalizes the space of standard interactions by chart element, interaction type, and input event. We demonstrate DIVI's usefulness for rapid data exploration and analysis through a usability study with 13 participants and a diverse gallery of dynamically interactive visualizations, including single chart, multi-view, and cross-tool configurations.

AI Key Findings

Get AI-generated insights about this paper's methodology, results, and significance.

Paper Details

PDF Preview

Download PDF

Key Terms

interactive (0.248)
decoupling (0.244)
specification (0.241)
interactive (0.239)
decoupling (0.226)
infer (0.216)
infer (0.215)
dynamically (0.210)
dynamically (0.200)
interactions (0.186)
view (0.182)
interaction (0.179)
interaction (0.176)
view (0.175)
input (0.160)
input (0.154)
multi view (0.153)
views (0.150)
runtime (0.147)

Citation Network

Current paper (gray), citations (green), references (blue)

Current Paper
Citations
References
Click to view
Title Authors Year Actions
Automated Data Analyser using Generative AI
Nalagarla Chiru Abhinash, Hindumathy. N, Eeda Ramakrishna Reddy, V. Usha
2025
View Paper
DATAWEAVER: Authoring Data-Driven Narratives through the Integrated Composition of Visualization and Text
Yu Fu, Dennis Bromley, V. Setlur
2025
View Paper
VisAnatomy: An SVG Chart Corpus with Fine-Grained Semantic Labels
Chen Chen, Hannah K. Bako, Peihong Yu, John Hooker, Jeffrey Joyal, Simon C. Wang, Samuel Kim, Jessica Wu, Aoxue Ding, Lara Sandeep, Alex Chen, Chayanika Sinha, Zhicheng Liu
2024
View Paper
Use-Coordination: Model, Grammar, and Library for Implementation of Coordinated Multiple Views
M. Keller, Trevor Manz, Nils Gehlenborg
2024
View Paper
Data Playwright: Authoring Data Videos with Annotated Narration
Leixian Shen, Haotian Li, Yun Wang, Tianqi Luo, Yuyu Luo, Huamin Qu
2024
View Paper
DracoGPT: Extracting Visualization Design Preferences from Large Language Models
Huichen Will Wang, Mitchell Gordon, Leilani Battle, Jeffrey Heer
2024
View Paper
Manipulable Semantic Components: A Computational Representation of Data Visualization Scenes
Zhicheng Liu, Chen Chen, John Hooker
2024
View Paper
From Data to Story: Towards Automatic Animated Data Video Creation with LLM-Based Multi-Agent Systems
Leixian Shen, Haotian Li, Yun Wang, Huamin Qu
2024
View Paper
Interaction Techniques for Exploratory Data Visualization on Mobile Devices
Luke S. Snyder, R. Rossi, E. Koh, Jeffrey Heer, J. Hoffswell
2024
View Paper

Comments (0)

This website uses cookies to ensure you get the best experience. Learn more