Academic Profile
Statistics
Similar Authors
Papers on arXiv
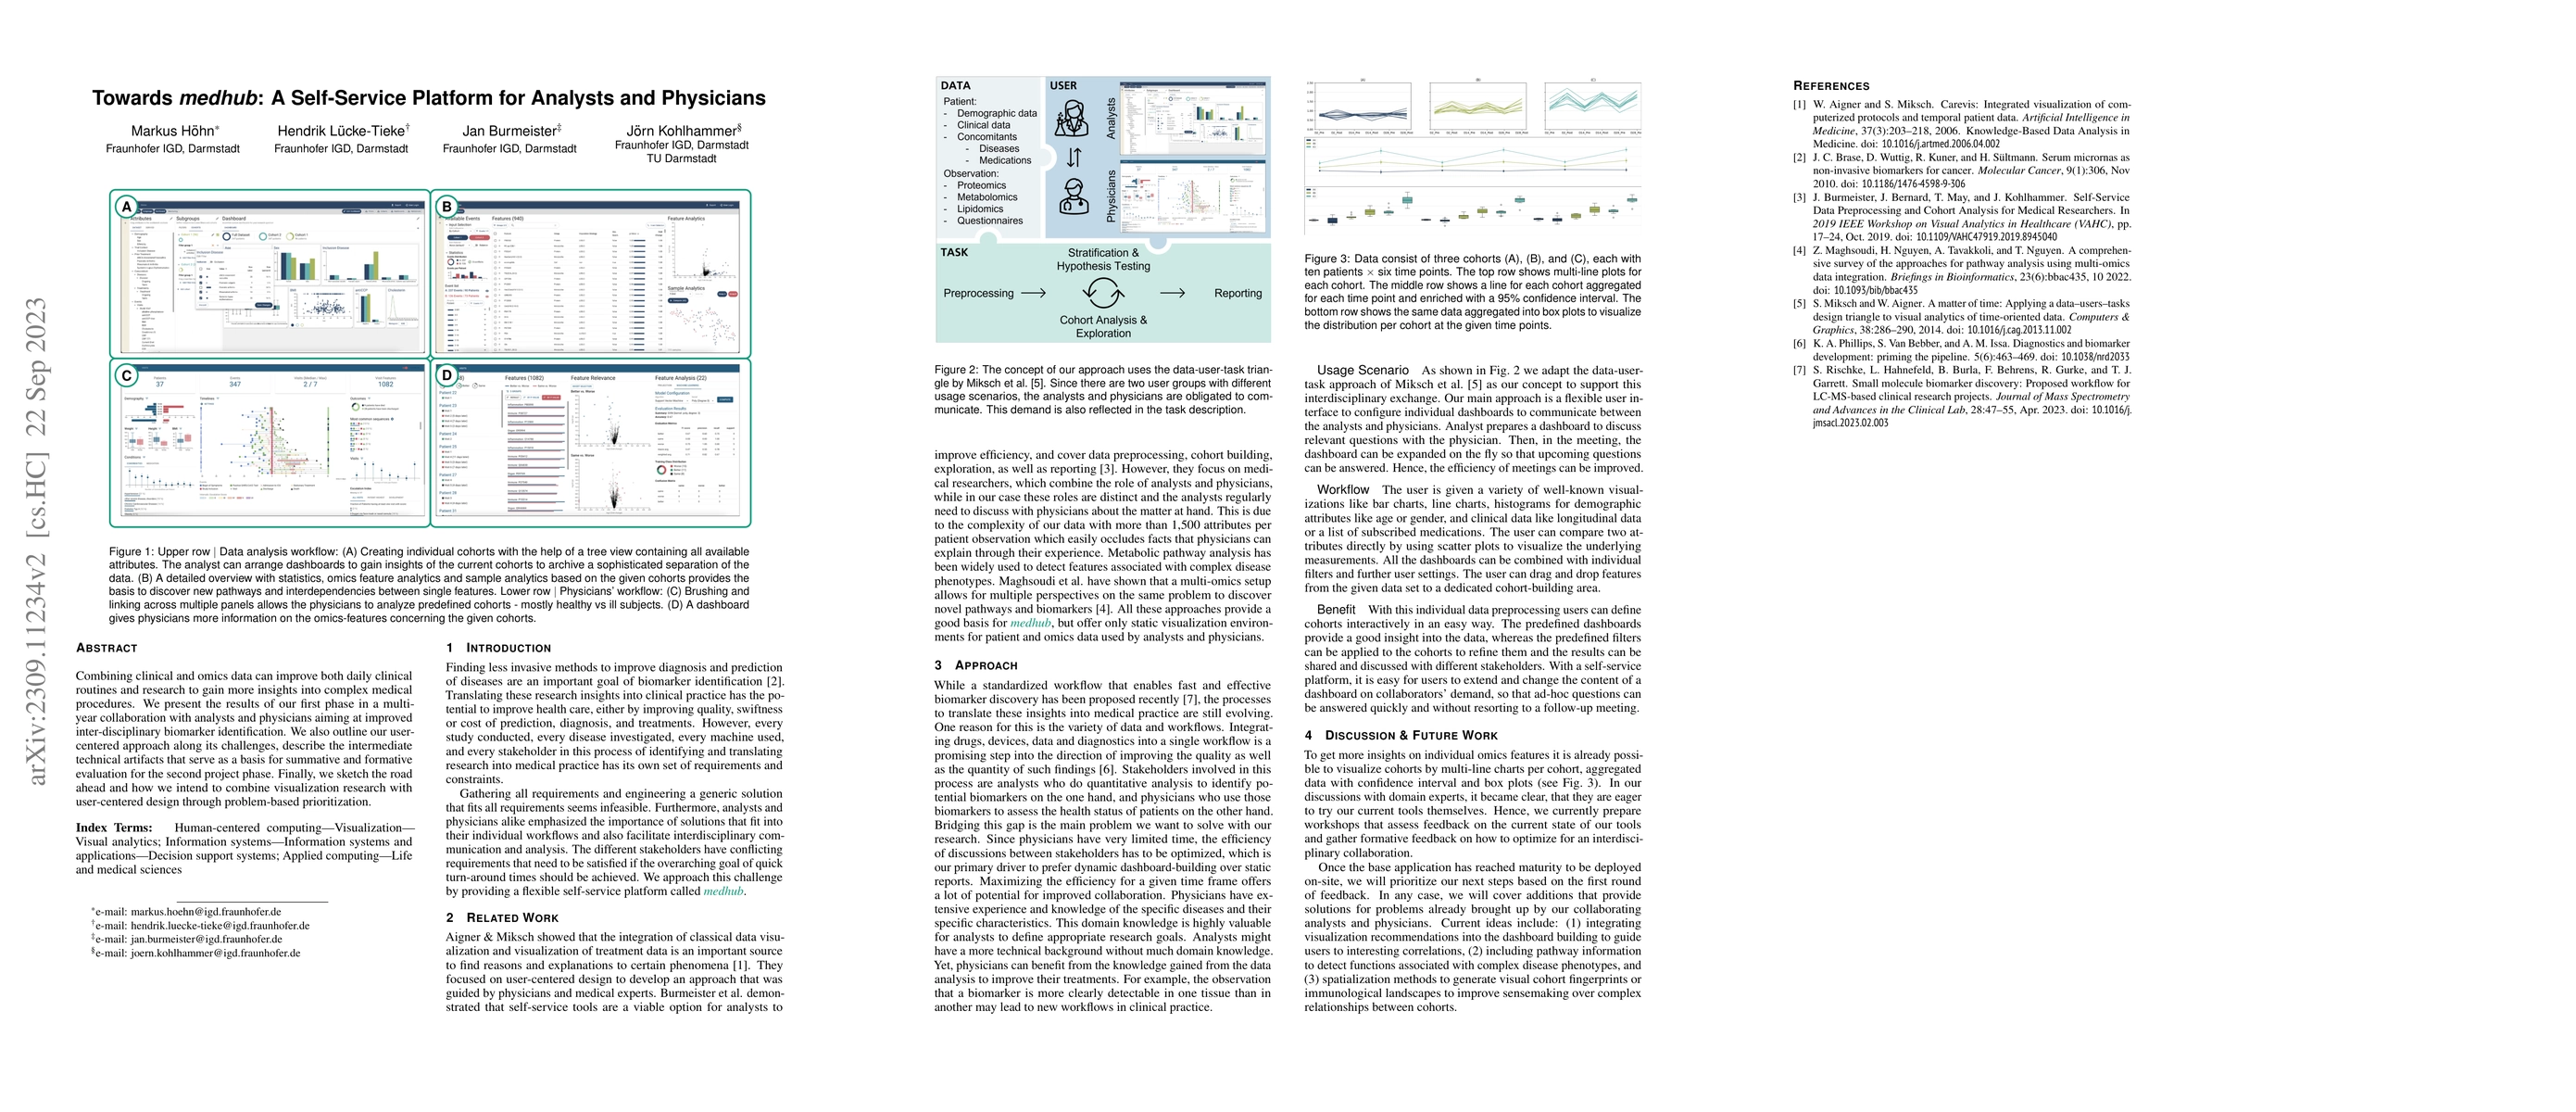
Combining clinical and omics data can improve both daily clinical routines and research to gain more insights into complex medical procedures. We present the results of our first phase in a multi-ye...
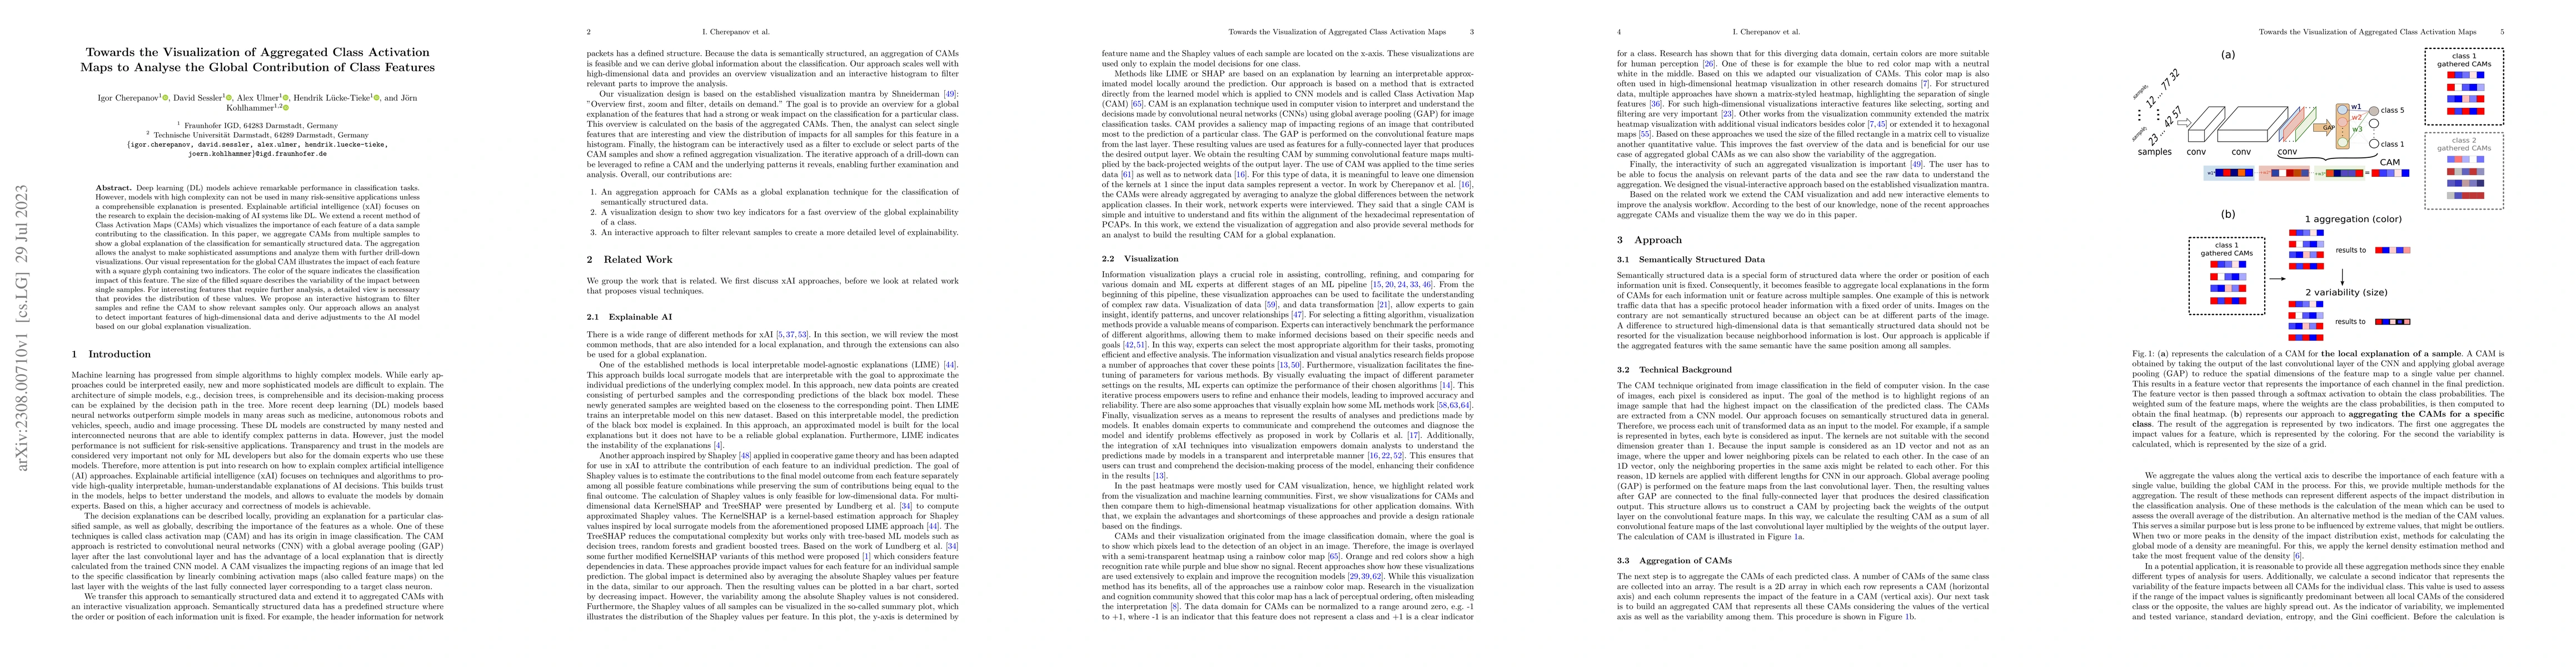
Deep learning (DL) models achieve remarkable performance in classification tasks. However, models with high complexity can not be used in many risk-sensitive applications unless a comprehensible exp...
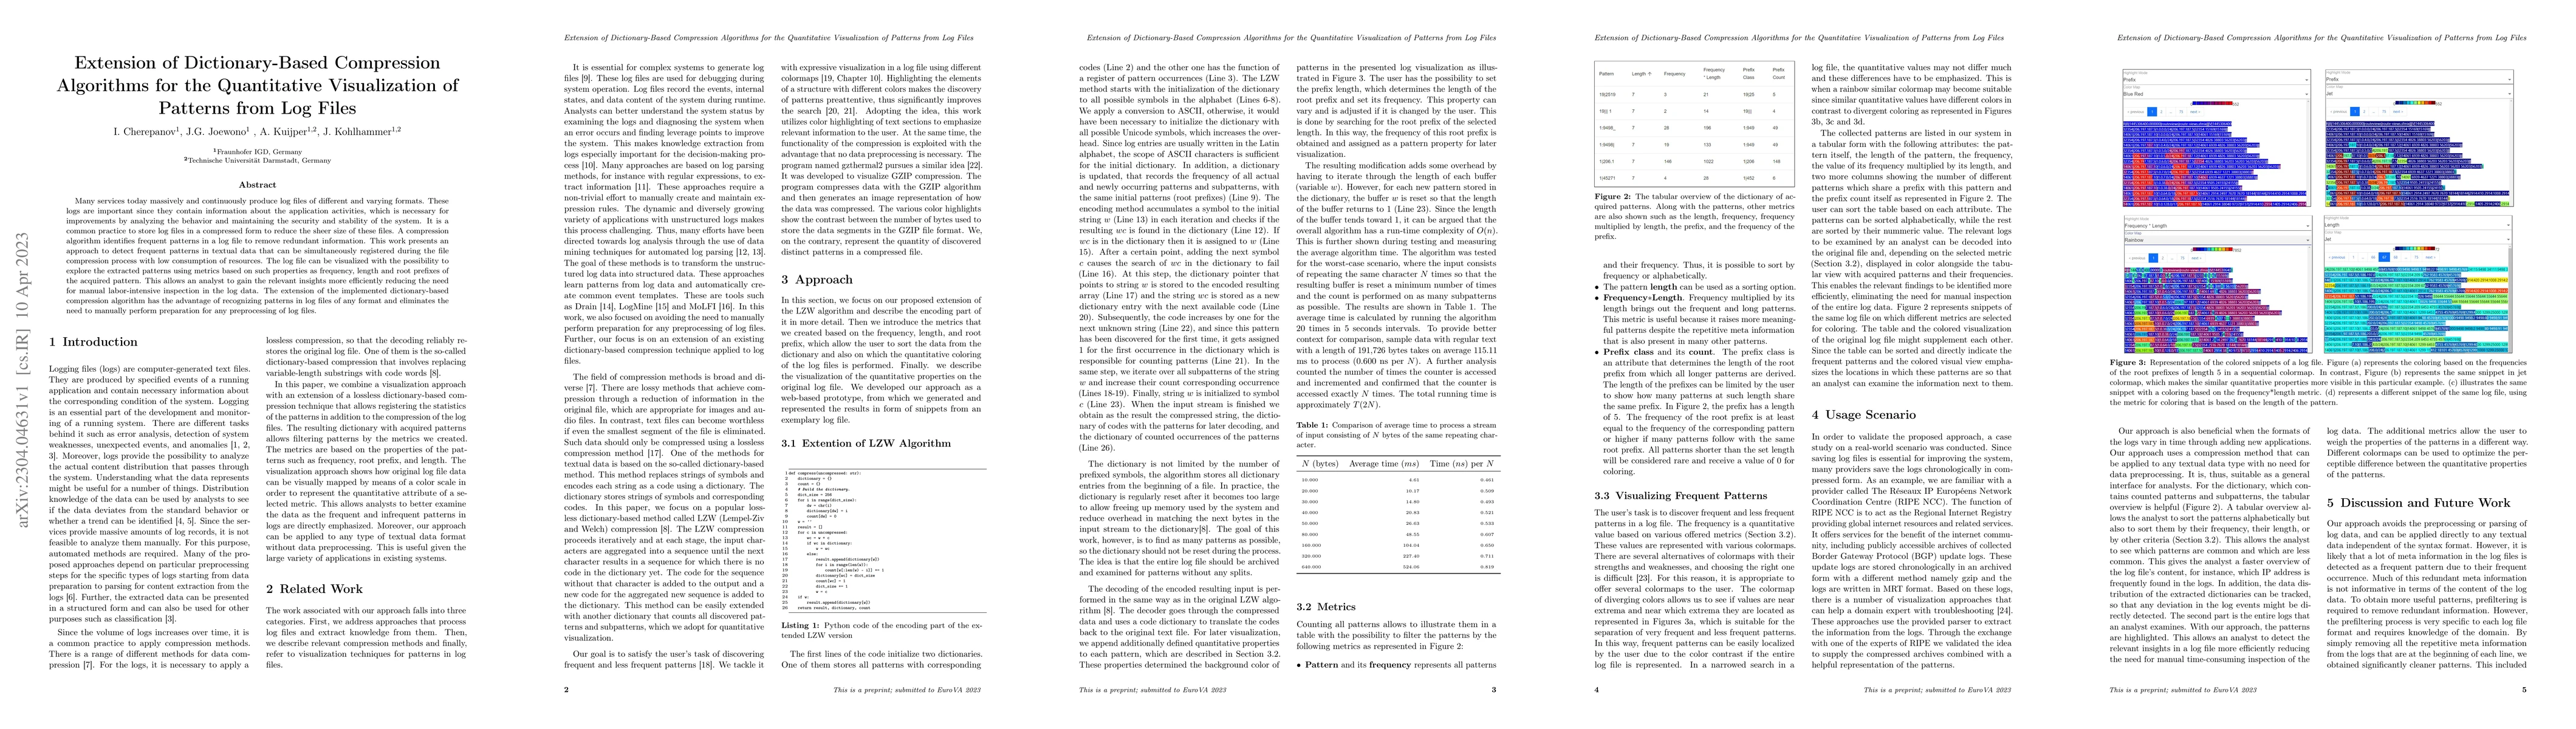
Many services today massively and continuously produce log files of different and varying formats. These logs are important since they contain information about the application activities, which is ...
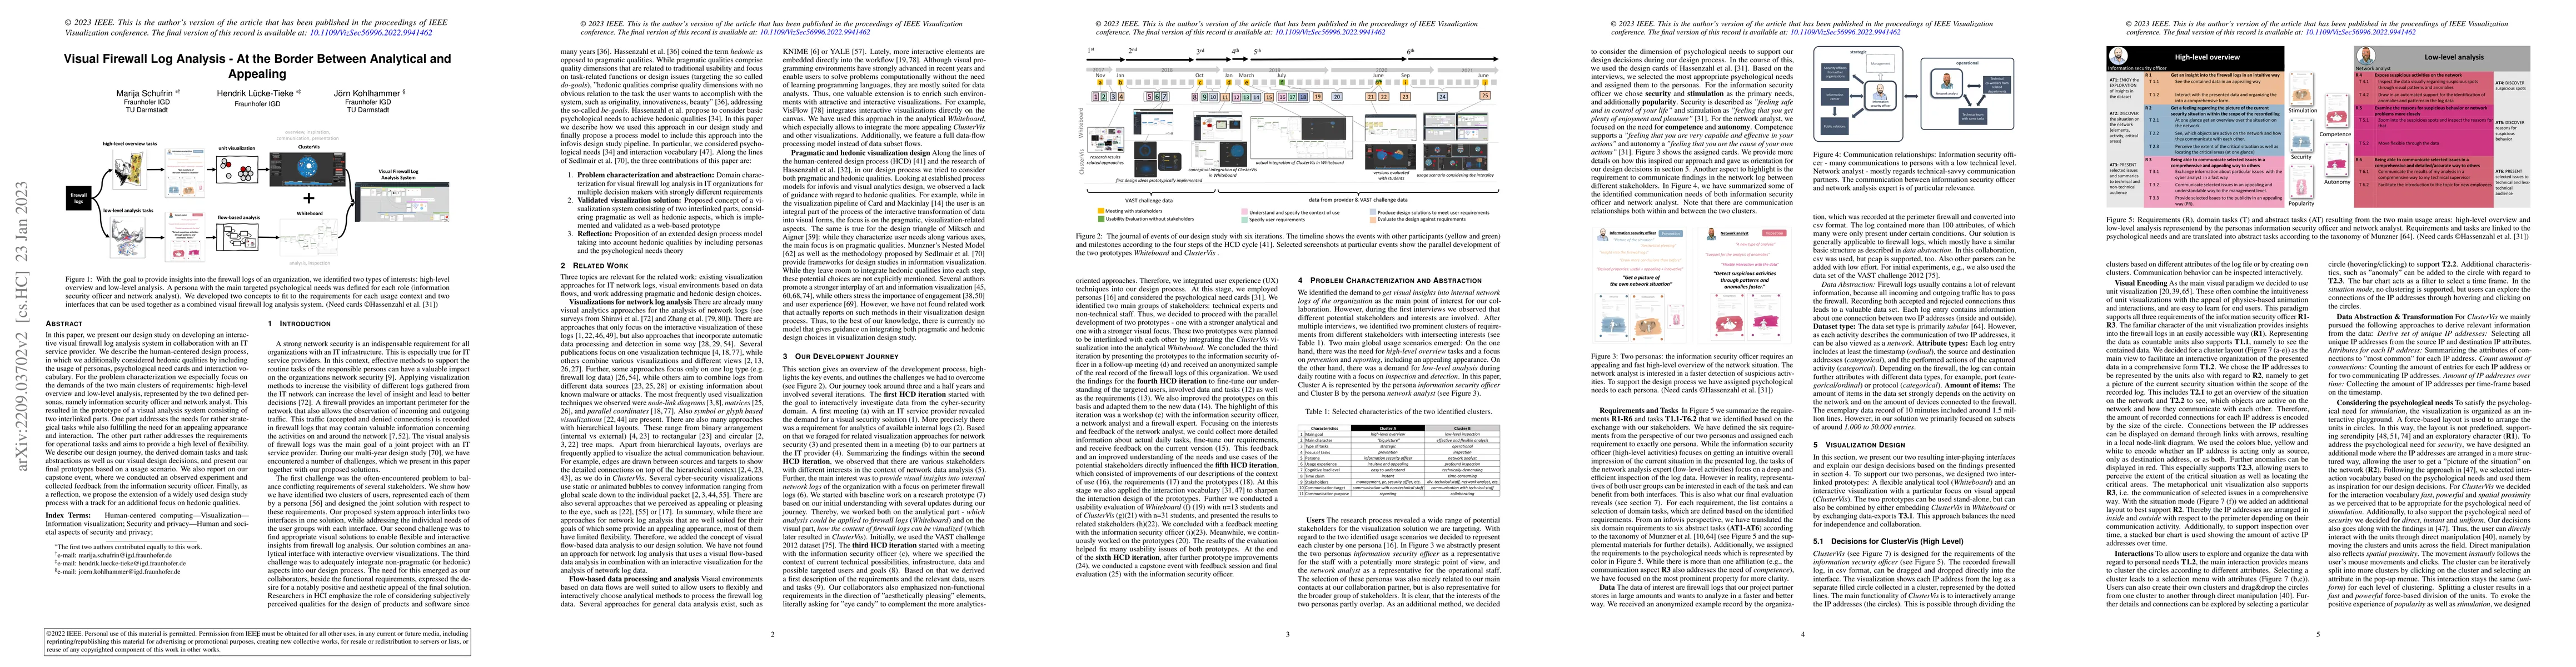
In this paper, we present our design study on developing an interactive visual firewall log analysis system in collaboration with an IT service provider. We describe the human-centered design proces...
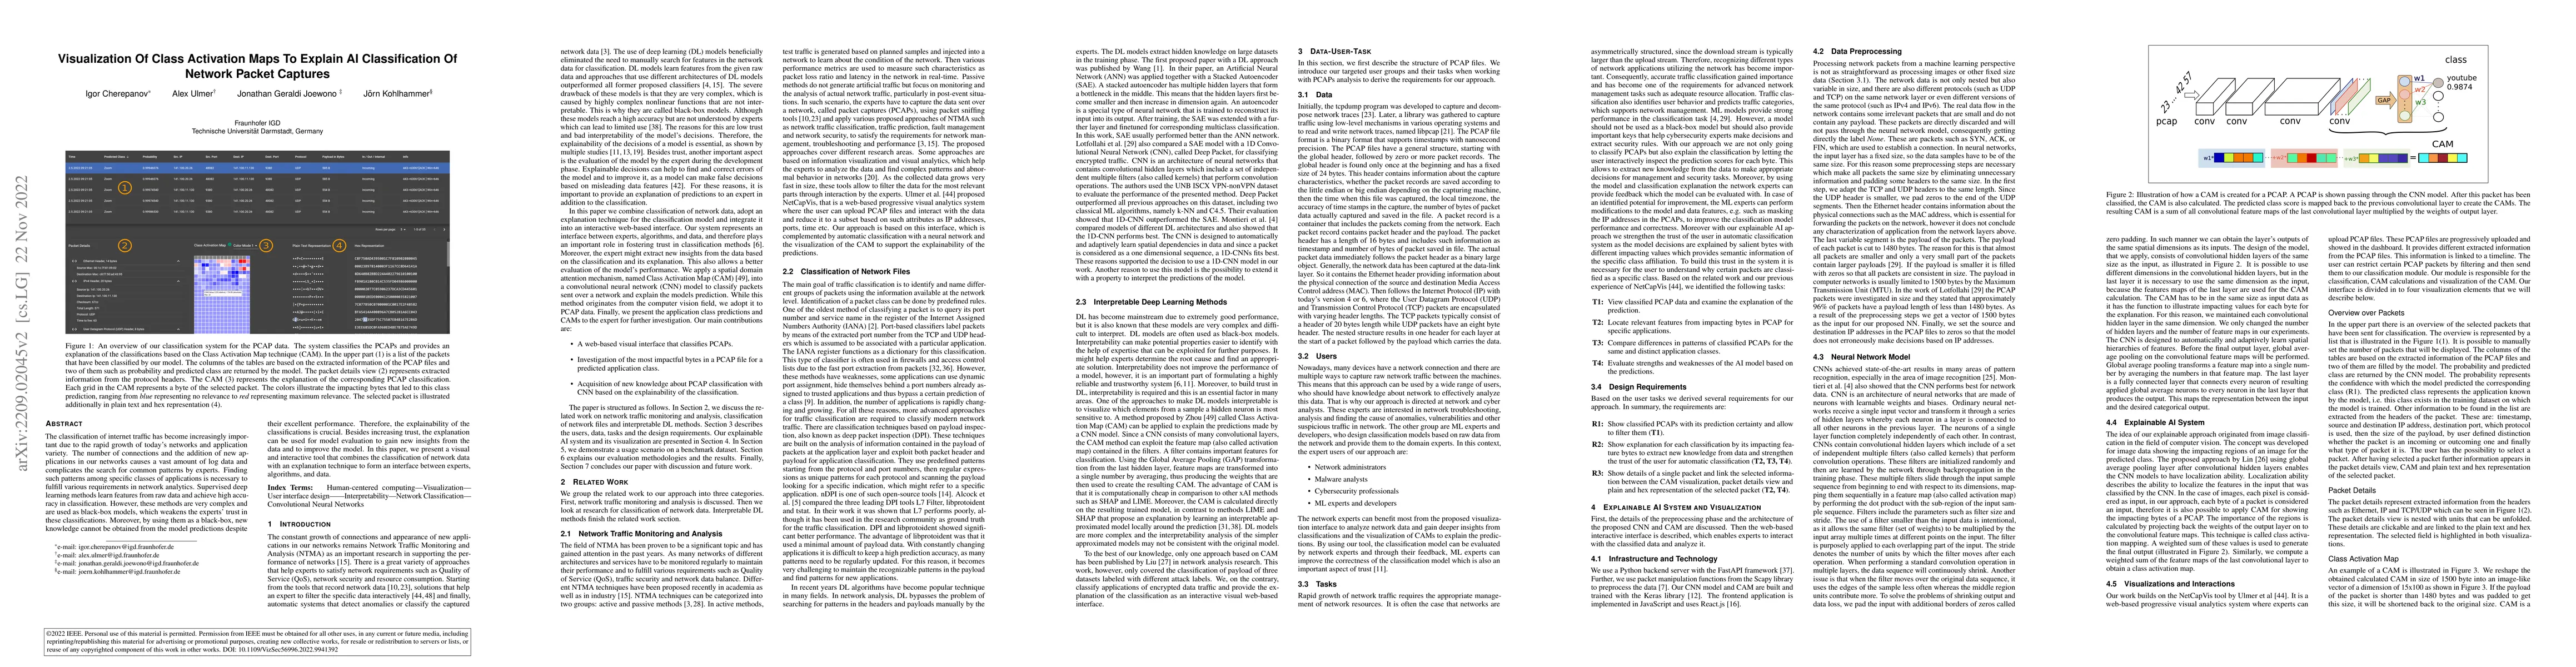
The classification of internet traffic has become increasingly important due to the rapid growth of today's networks and applications. The number of connections and the addition of new applications ...
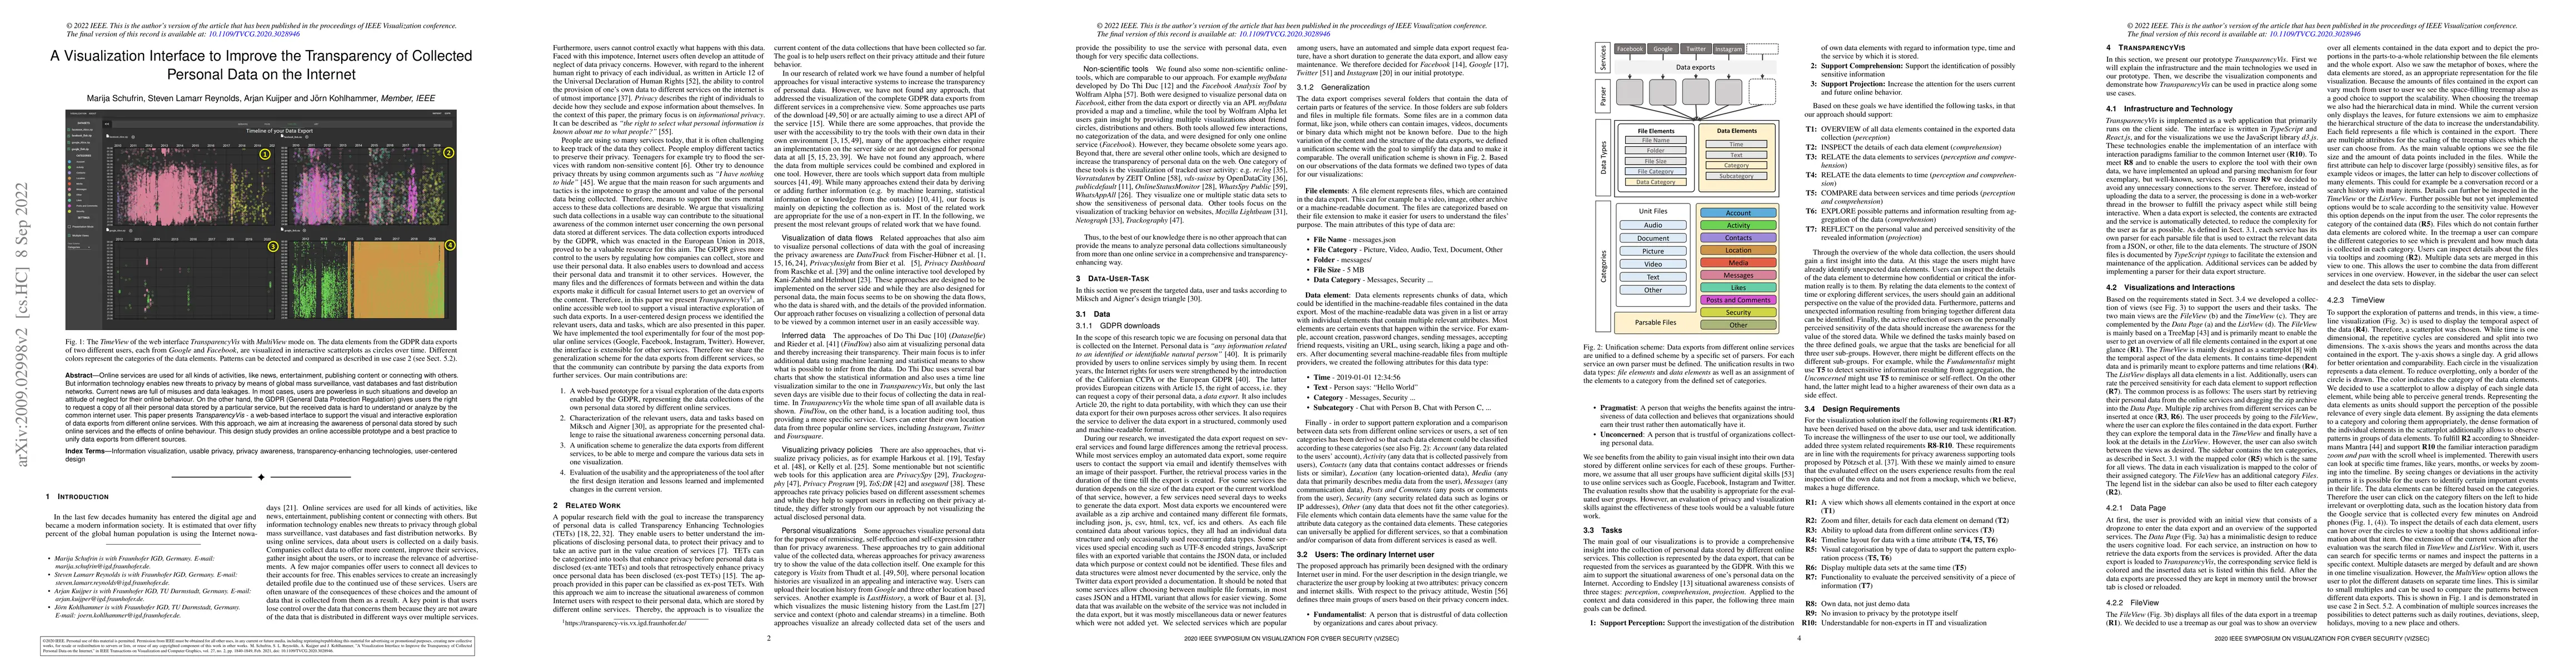
Online services are used for all kinds of activities, like news, entertainment, publishing content or connecting with others. But information technology enables new threats to privacy by means of gl...
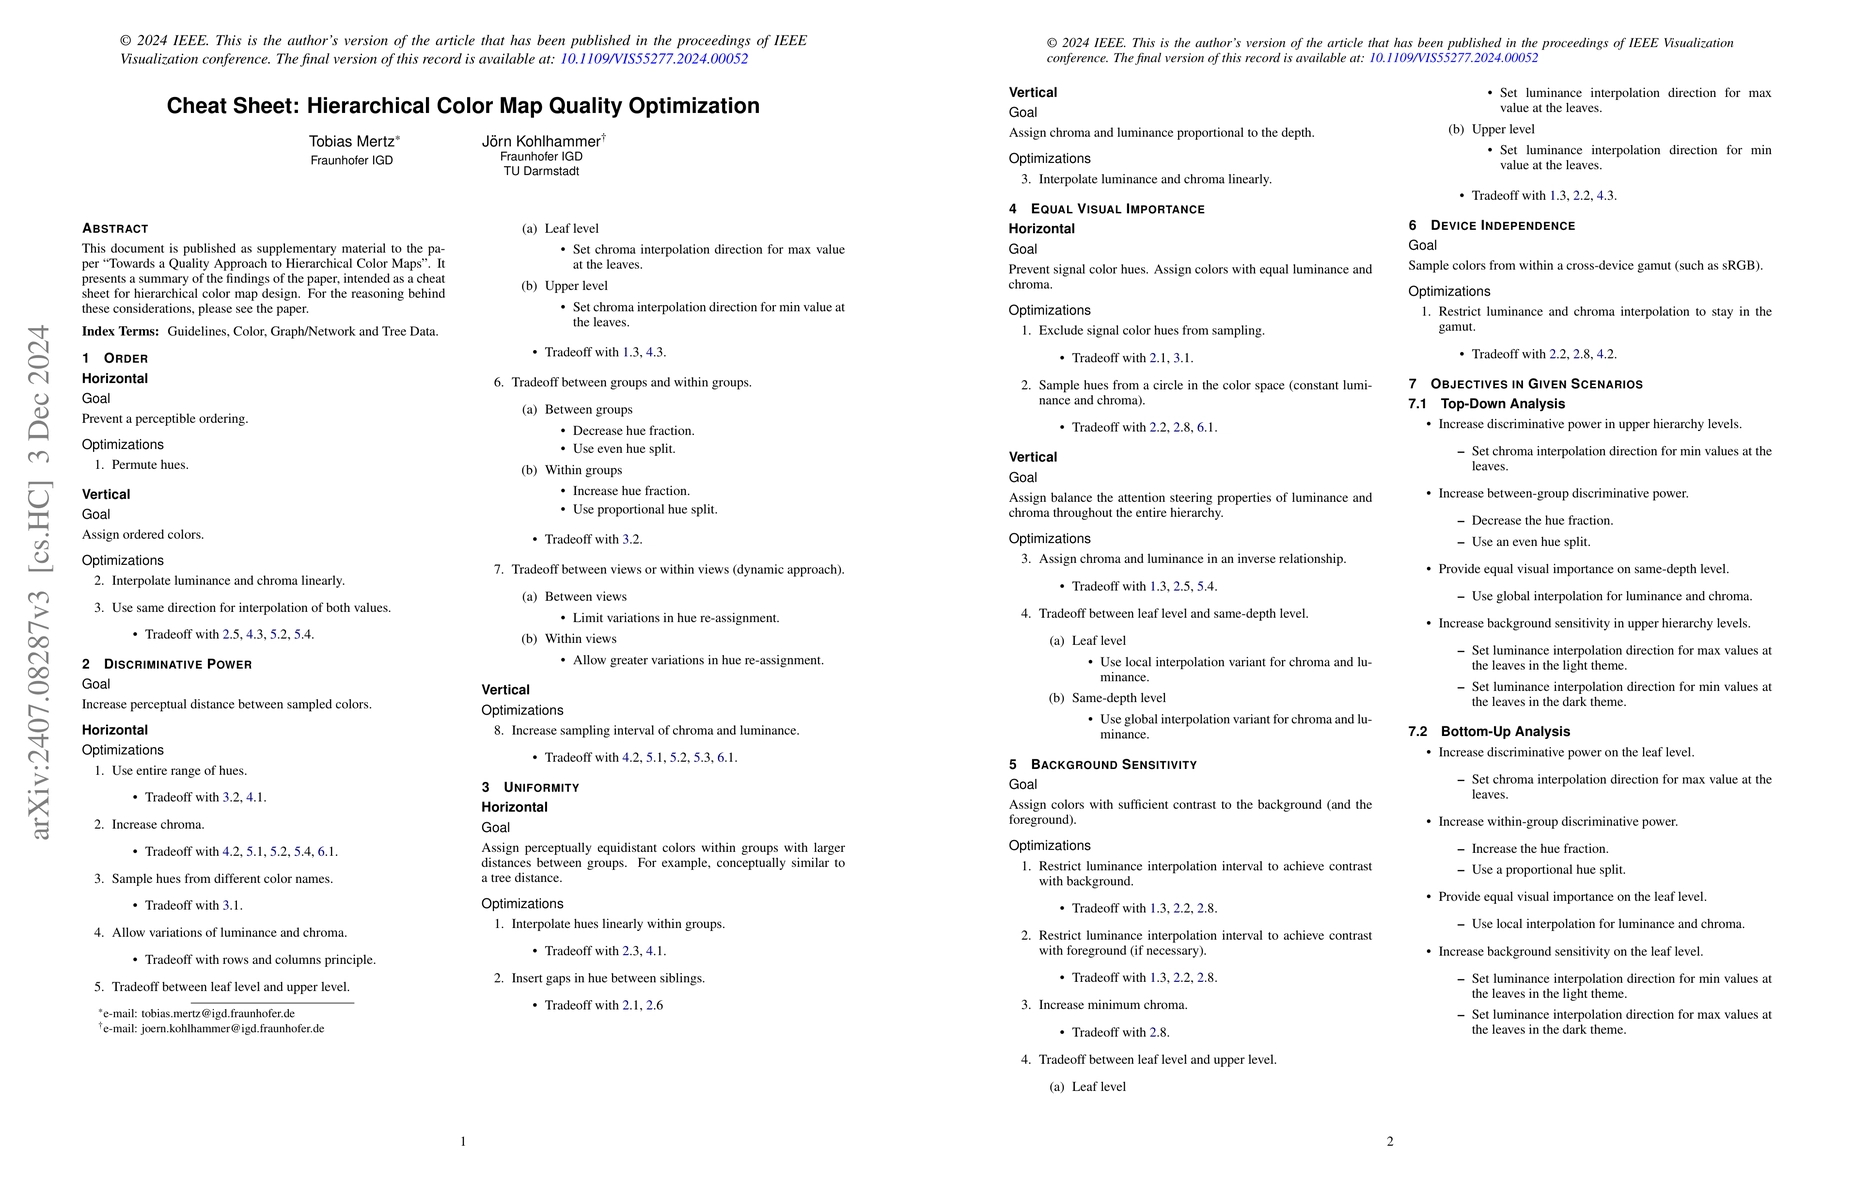
To improve the perception of hierarchical structures in data sets, several color map generation algorithms have been proposed to take this structure into account. But the design of hierarchical color ...
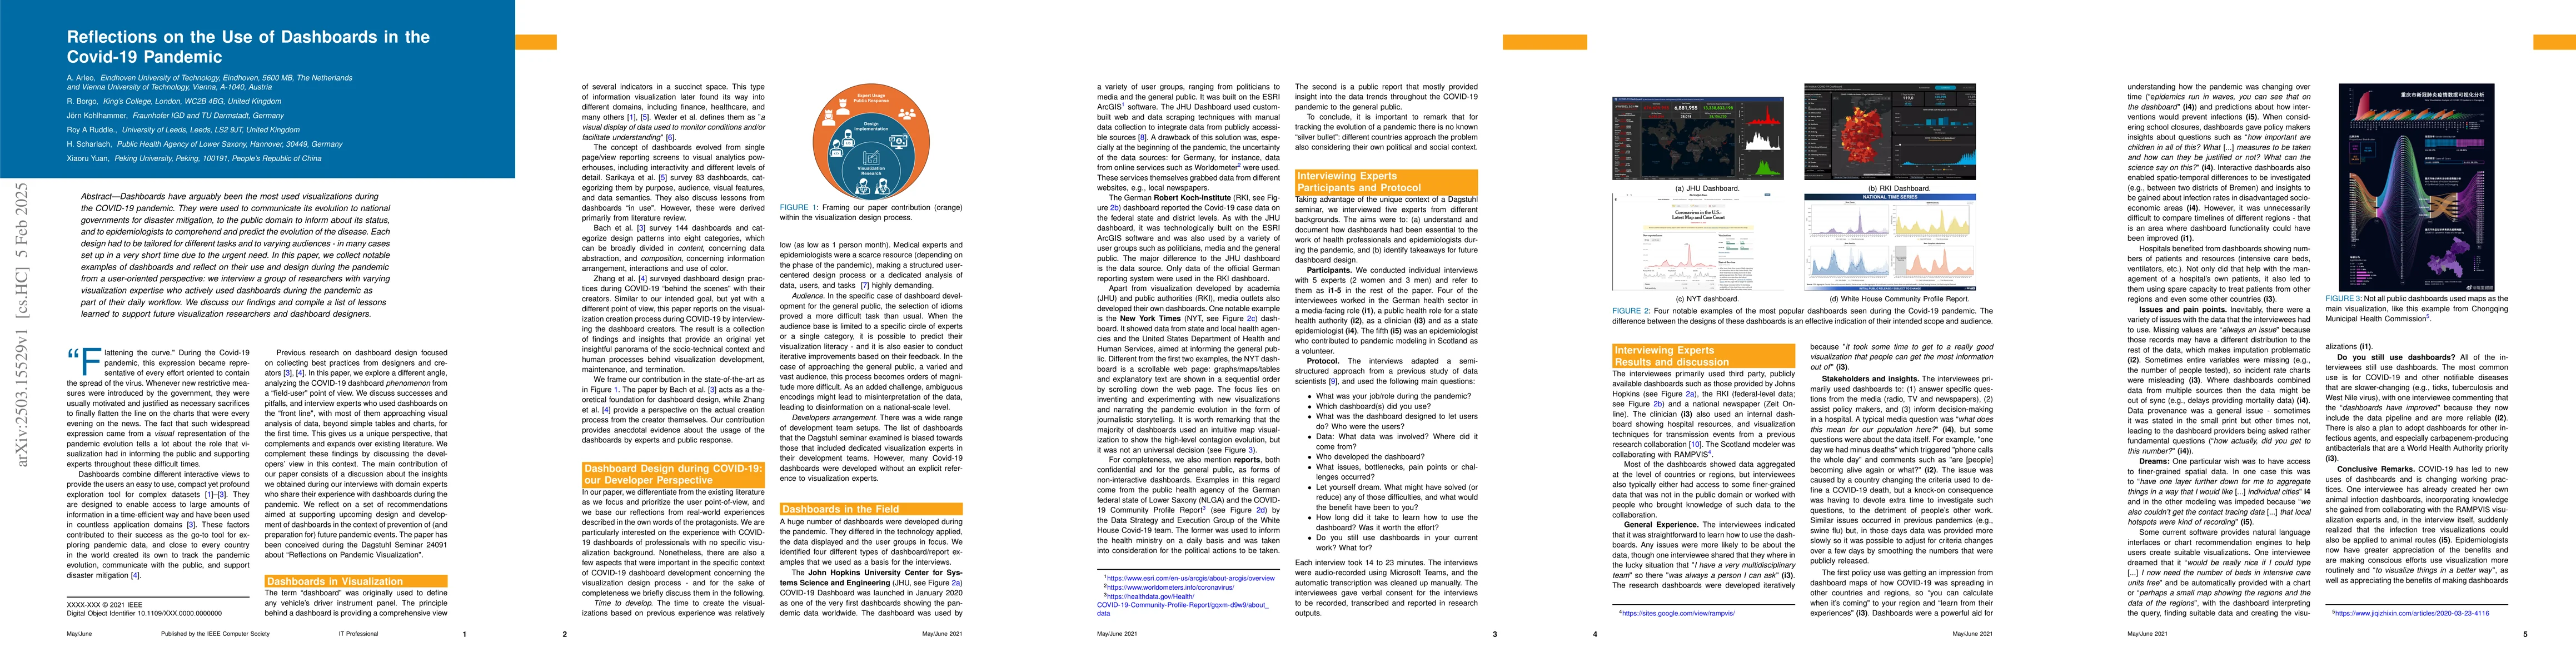
Dashboards have arguably been the most used visualizations during the COVID-19 pandemic. They were used to communicate its evolution to national governments for disaster mitigation, to the public doma...