Publication
Metrics
AI Quick Summary
This paper examines the design of hierarchical color maps to enhance the perception of data hierarchies, contrasting them with traditional tabular color maps. It provides recommendations based on design decisions to improve these maps and lays the groundwork for objective quality criteria for their evaluation.
Paper Preview
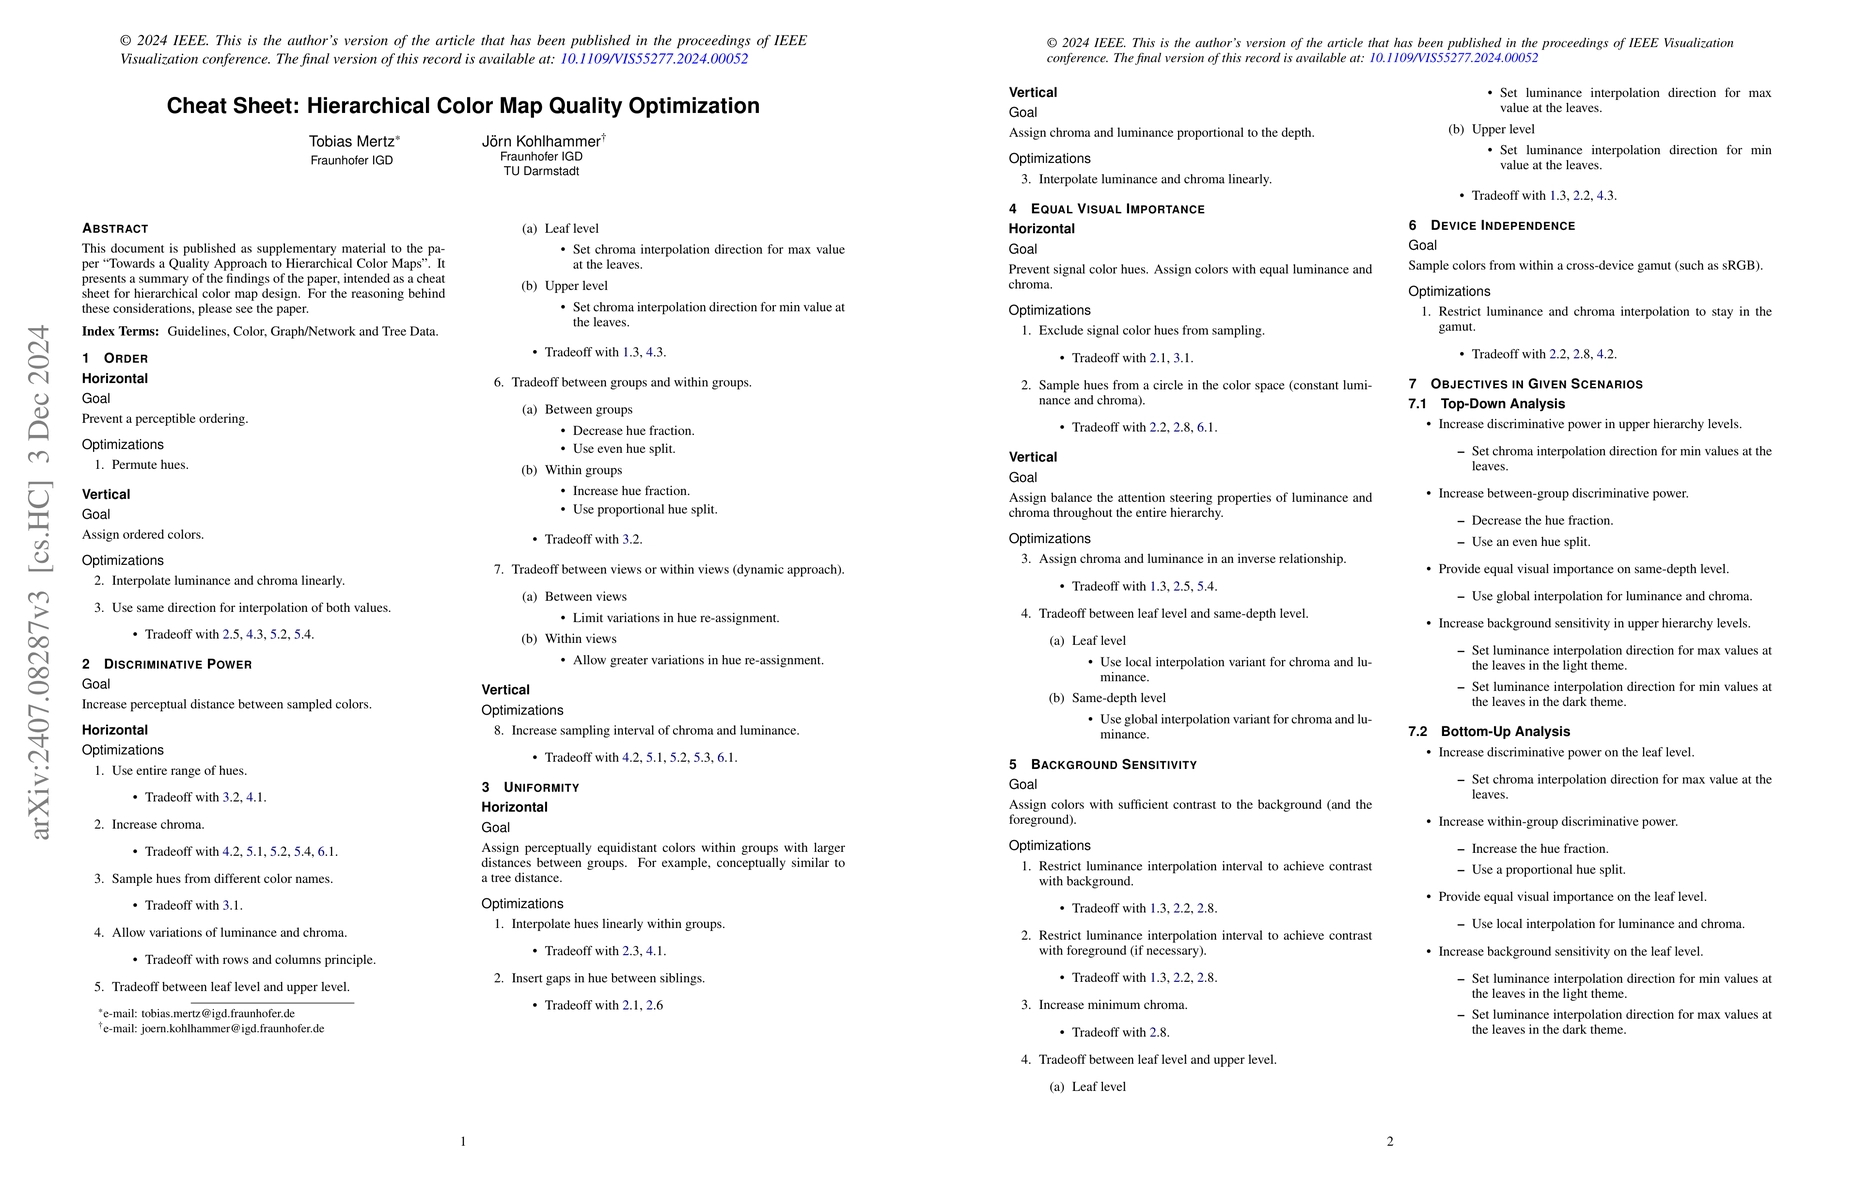
Abstract
To improve the perception of hierarchical structures in data sets, several color map generation algorithms have been proposed to take this structure into account. But the design of hierarchical color maps elicits different requirements to those of color maps for tabular data. Within this paper, we make an initial effort to put design rules from the color map literature into the context of hierarchical color maps. We investigate the impact of several design decisions and provide recommendations for various analysis scenarios. Thus, we lay the foundation for objective quality criteria to evaluate hierarchical color maps.
AI Key Findings
Get AI-generated insights about this paper's methodology, results, significance, and more — seven facets brought into focus.
Impact
Authors
PDF Preview
Citation Network
Current paper (gray), citations (green), references (blue)
Display is limited for performance on very large graphs.
Discussion 0