Academic Profile
Statistics
Similar Authors
Papers on arXiv
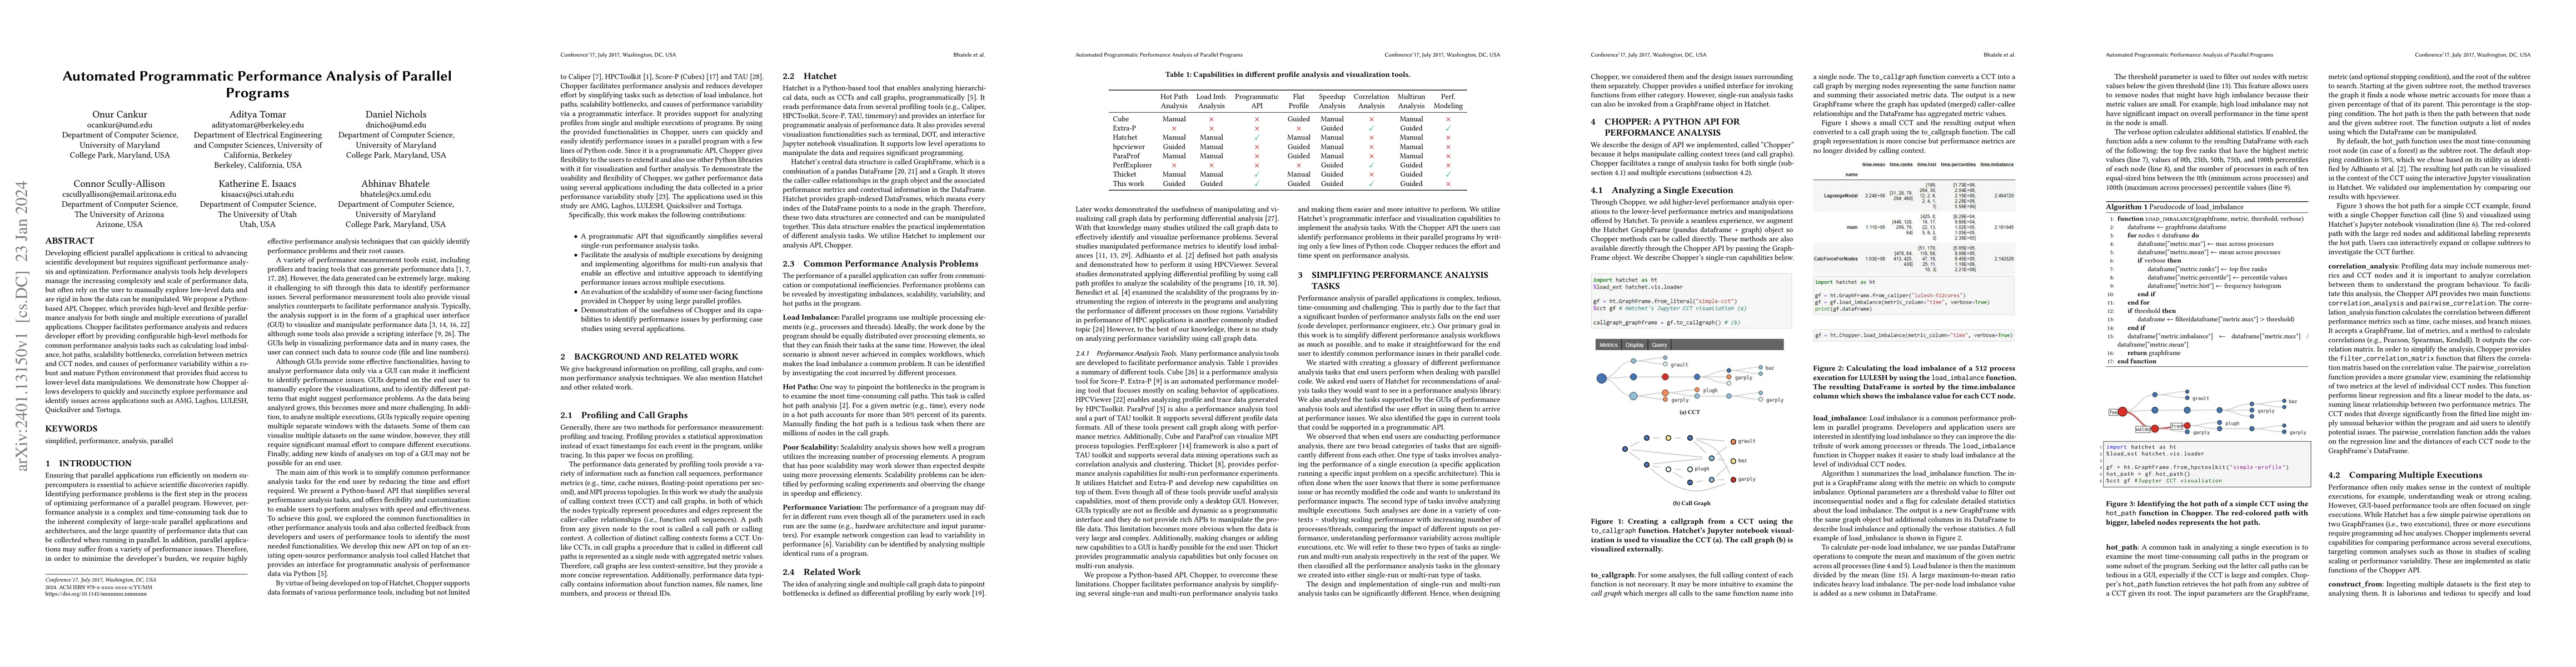
Developing efficient parallel applications is critical to advancing scientific development but requires significant performance analysis and optimization. Performance analysis tools help developers ...
Understanding the behavior of software in execution is a key step in identifying and fixing performance issues. This is especially important in high performance computing contexts where even minor p...
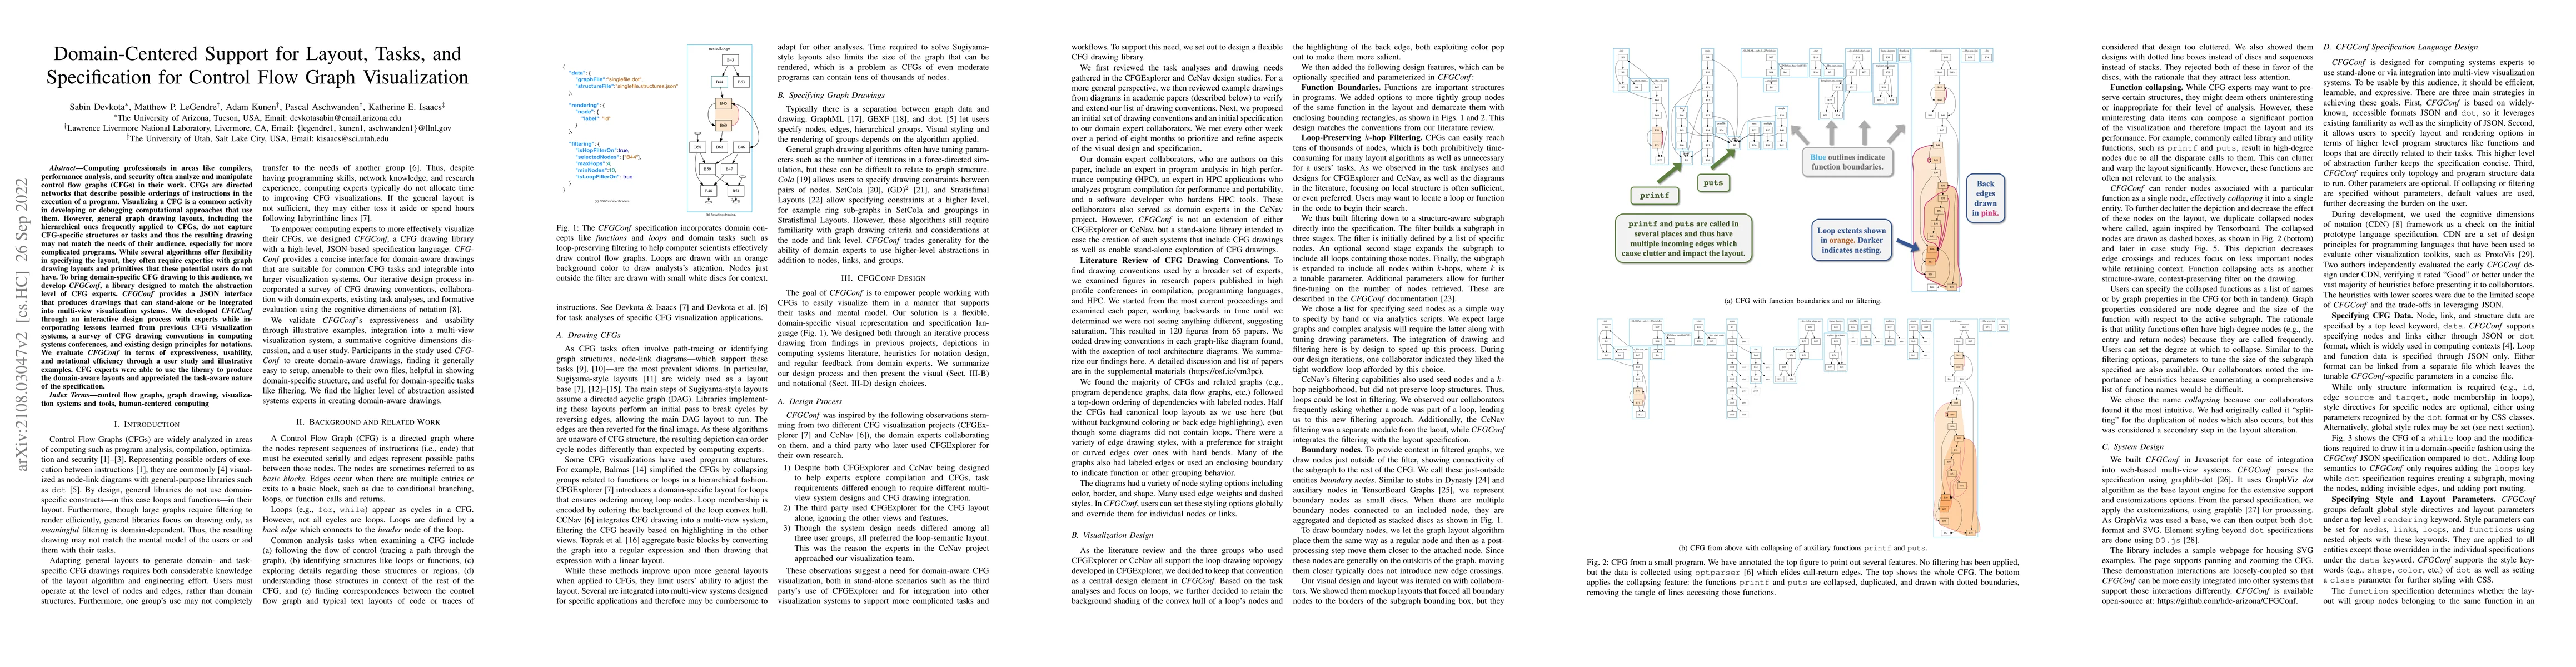
Computing professionals in areas like compilers, performance analysis, and security often analyze and manipulate control flow graphs (CFGs) in their work. CFGs are directed networks that describe po...
Program developers spend significant time on optimizing and tuning programs. During this iterative process, they apply optimizations, analyze the resulting code, and modify the compilation until the...

Many data abstraction types, such as networks or set relationships, remain unfamiliar to data workers beyond the visualization research community. We conduct a survey and series of interviews about ...
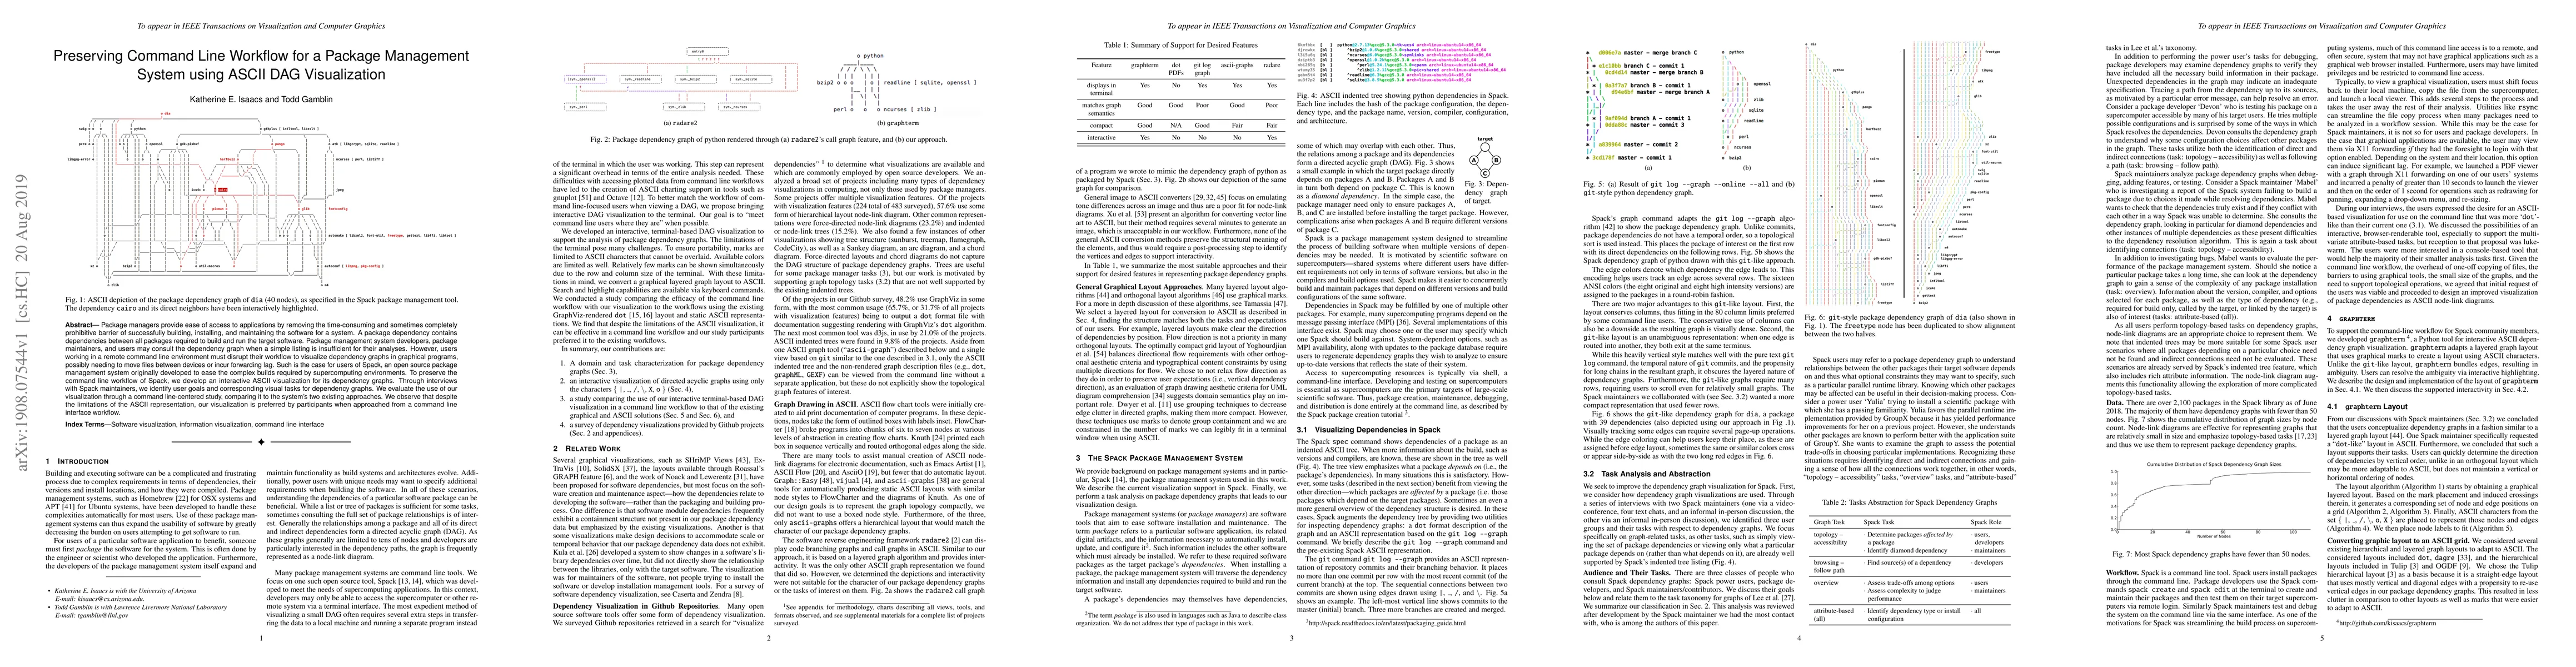
Package managers provide ease of access to applications by removing the time-consuming and sometimes completely prohibitive barrier of successfully building, installing, and maintaining the software...
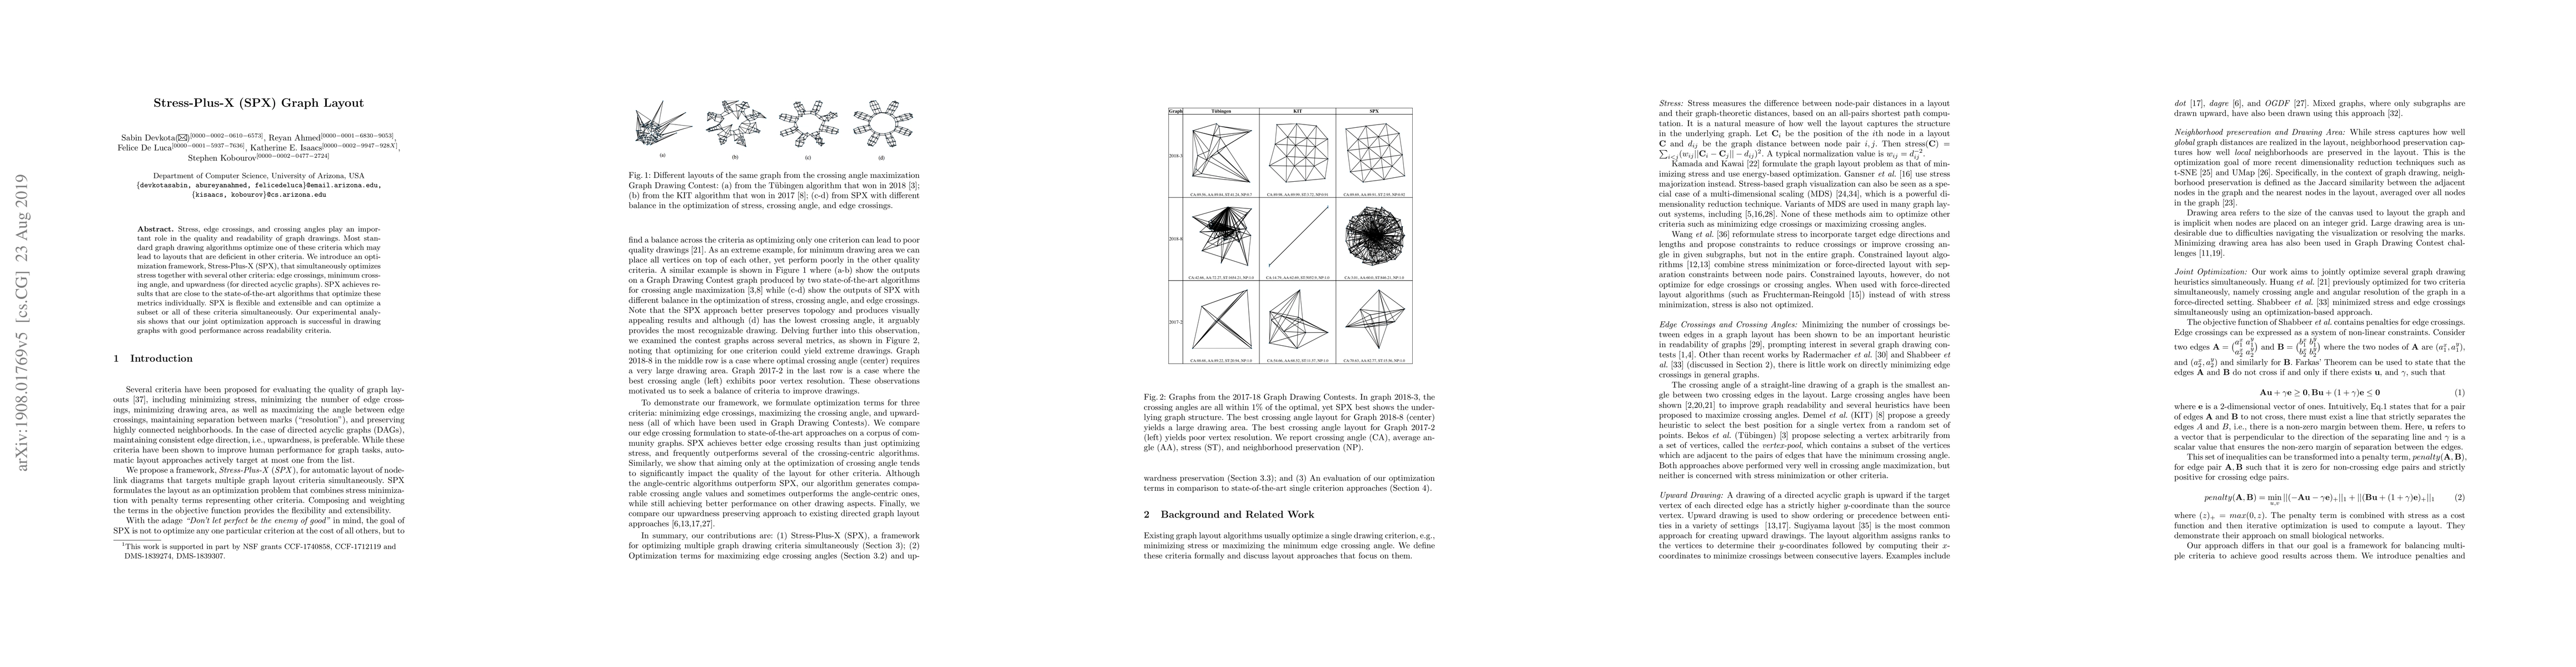
Stress, edge crossings, and crossing angles play an important role in the quality and readability of graph drawings. Most standard graph drawing algorithms optimize one of these criteria which may l...
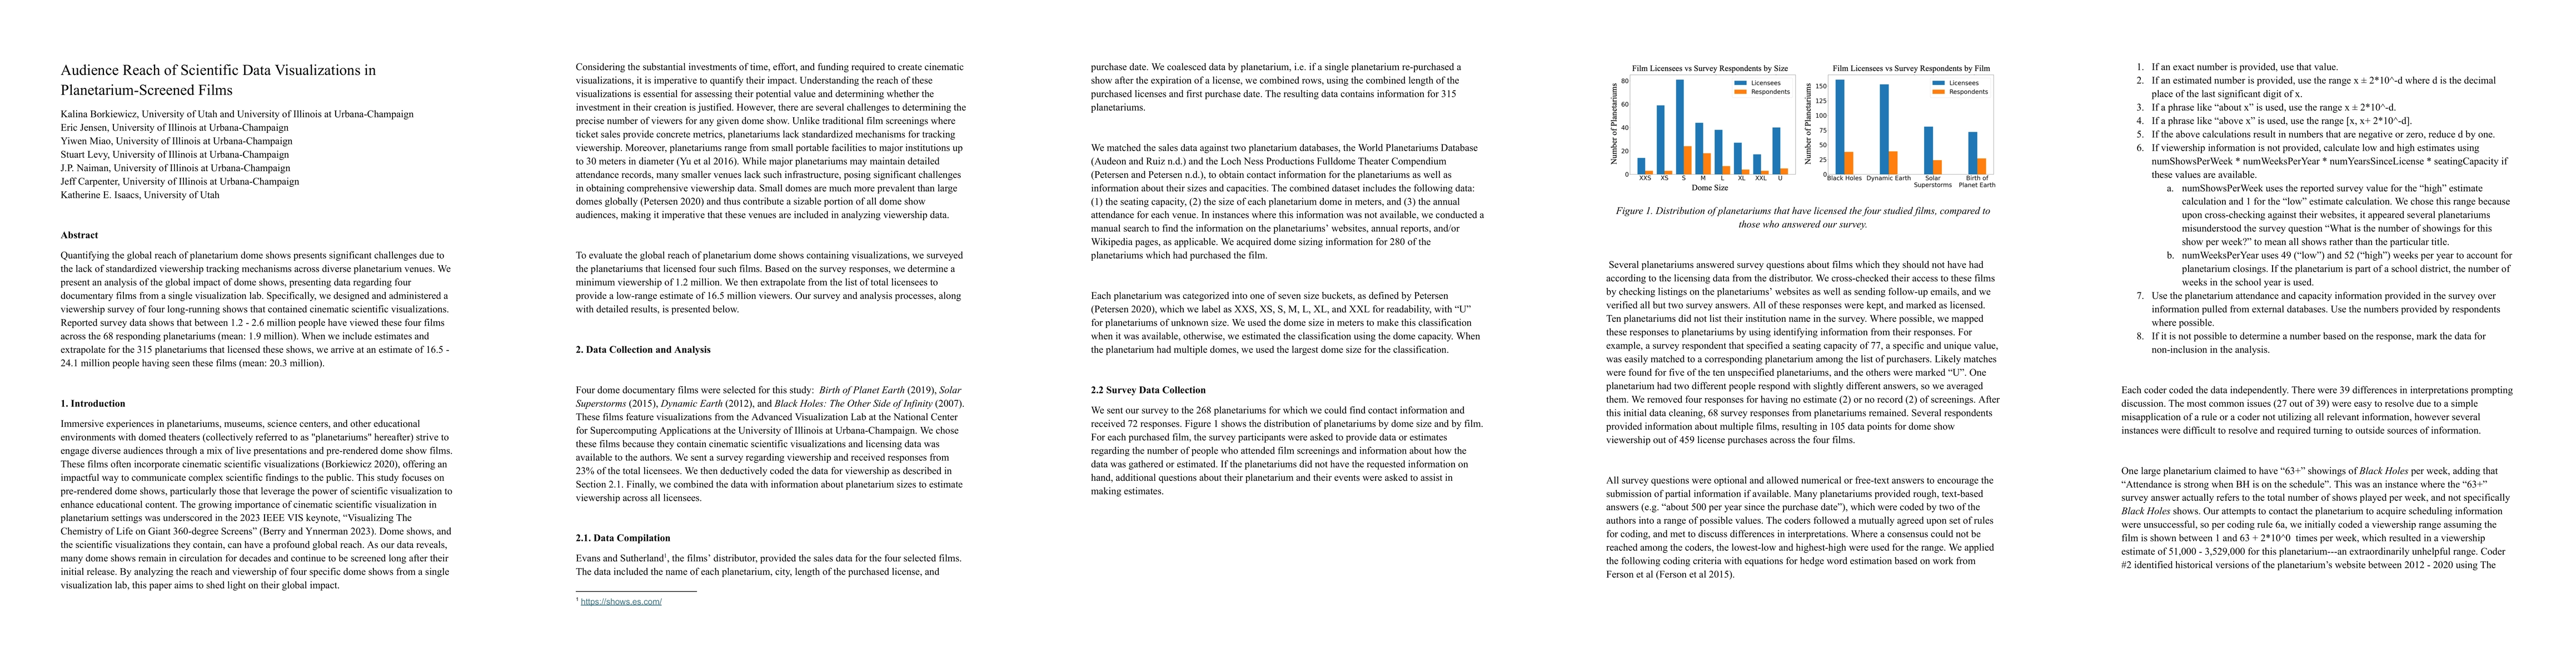
Quantifying the global reach of planetarium dome shows presents significant challenges due to the lack of standardized viewership tracking mechanisms across diverse planetarium venues. We present an a...
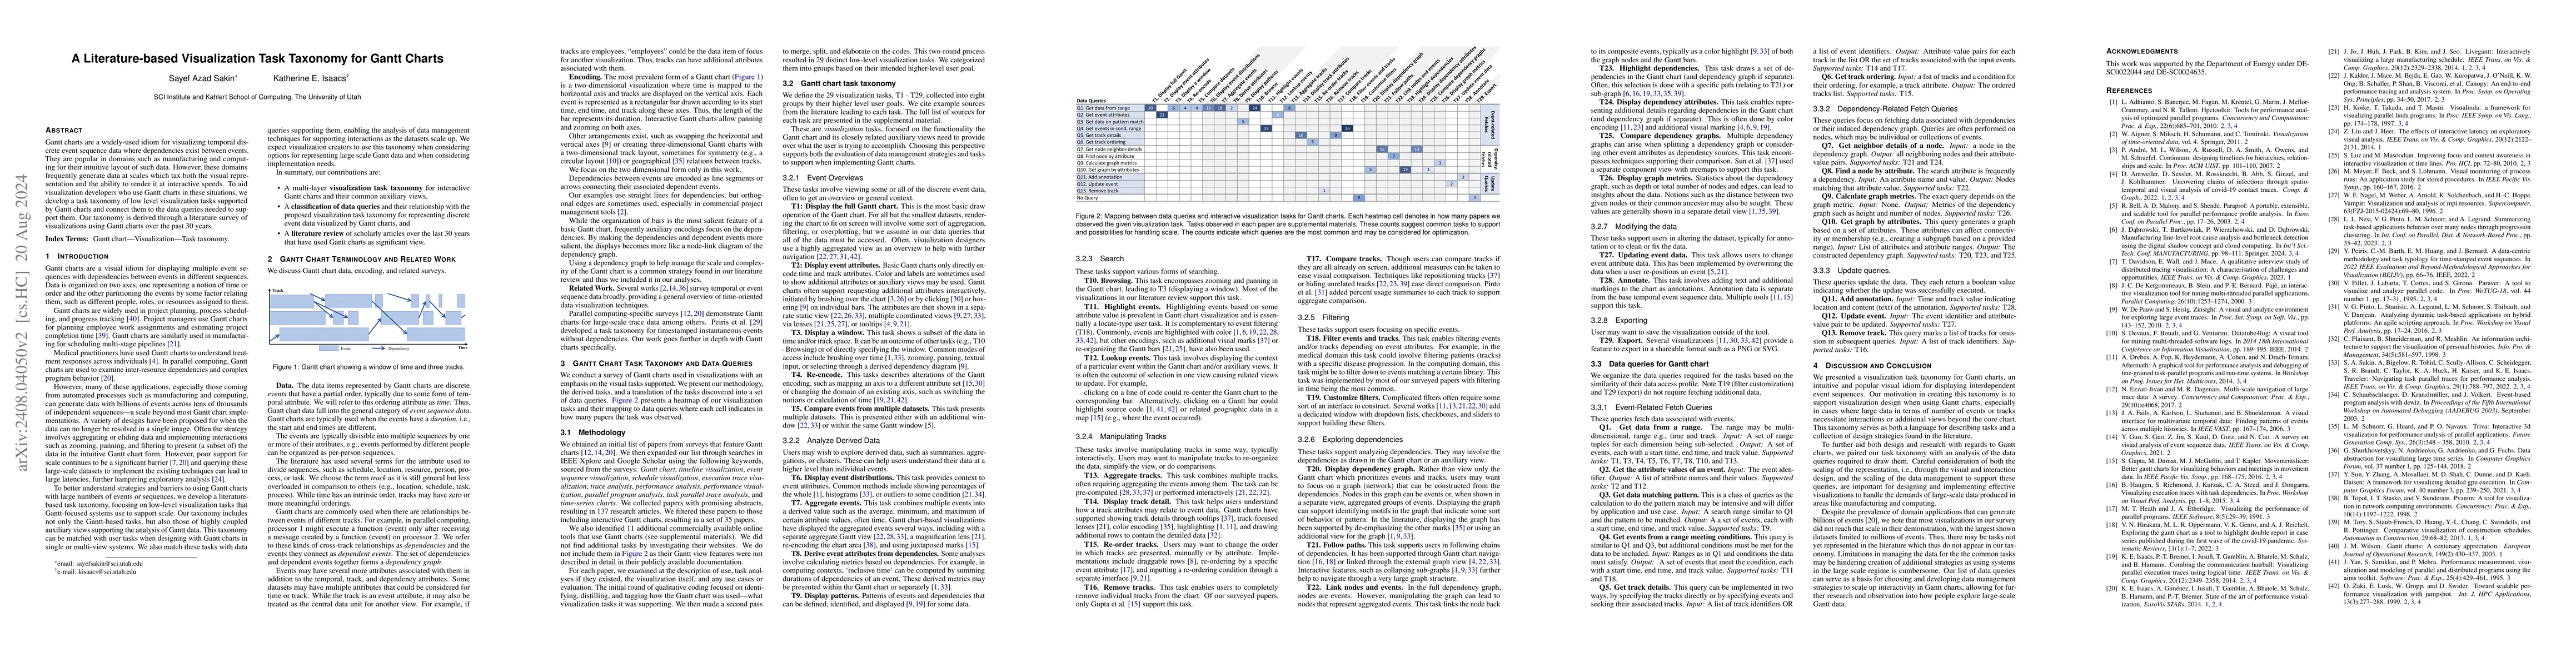
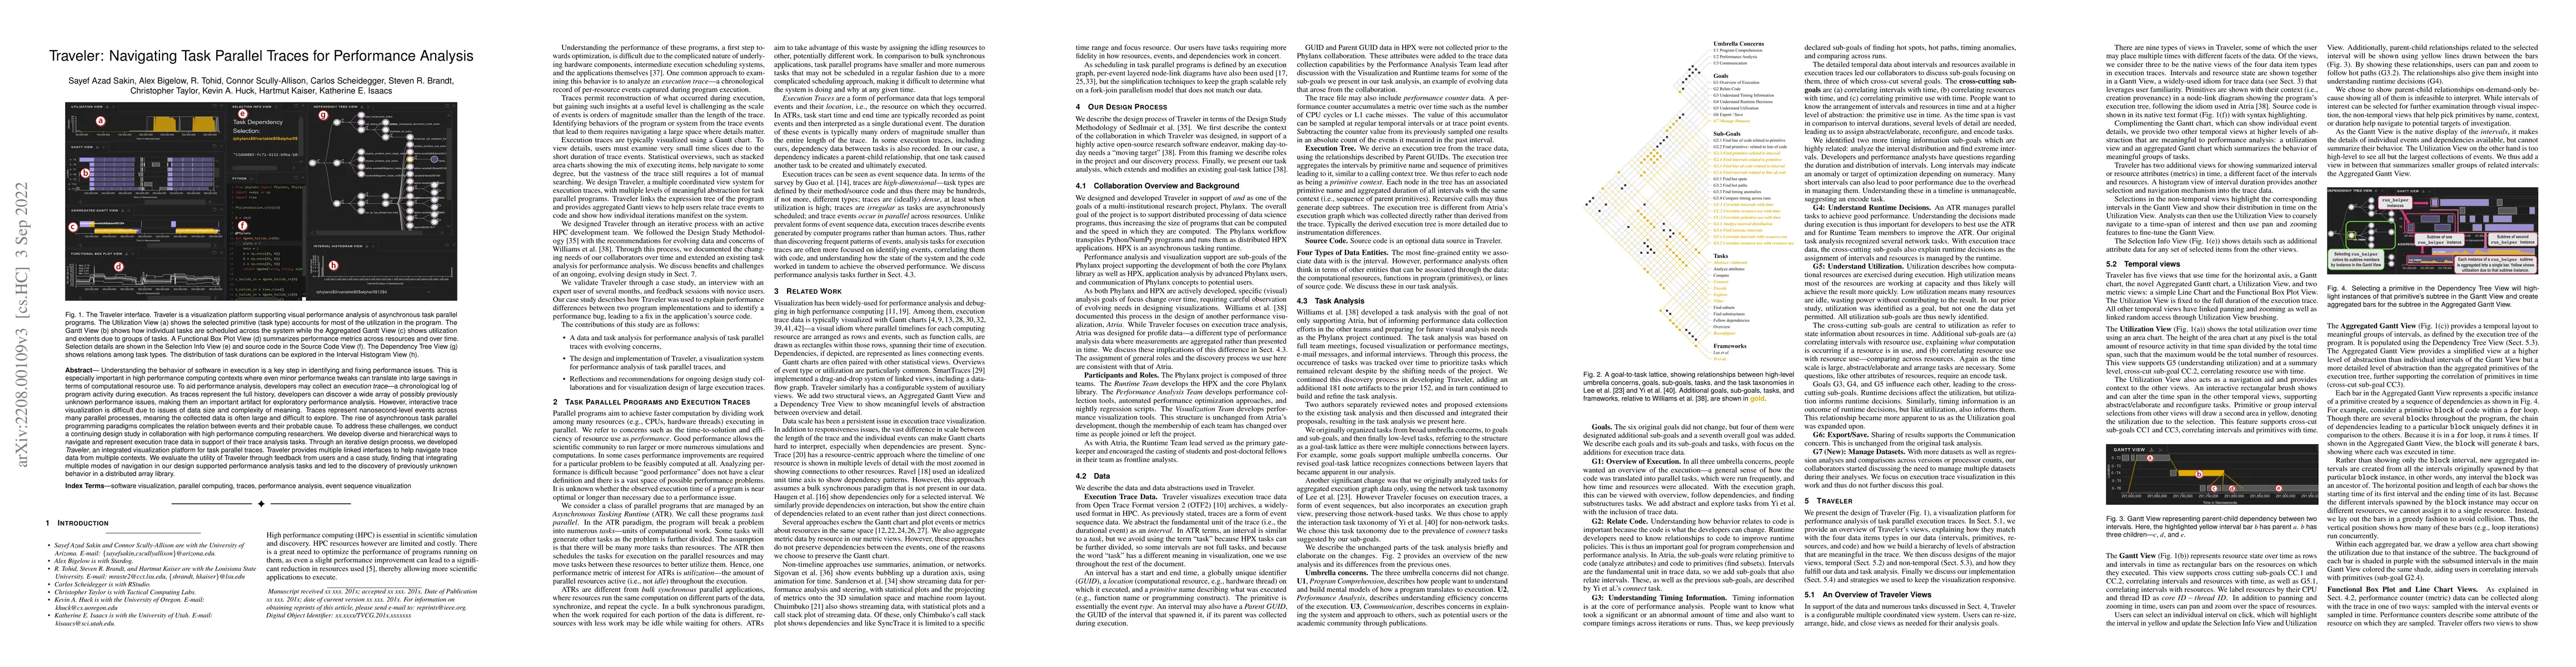
Gantt charts are a widely-used idiom for visualizing temporal discrete event sequence data where dependencies exist between events. They are popular in domains such as manufacturing and computing for ...
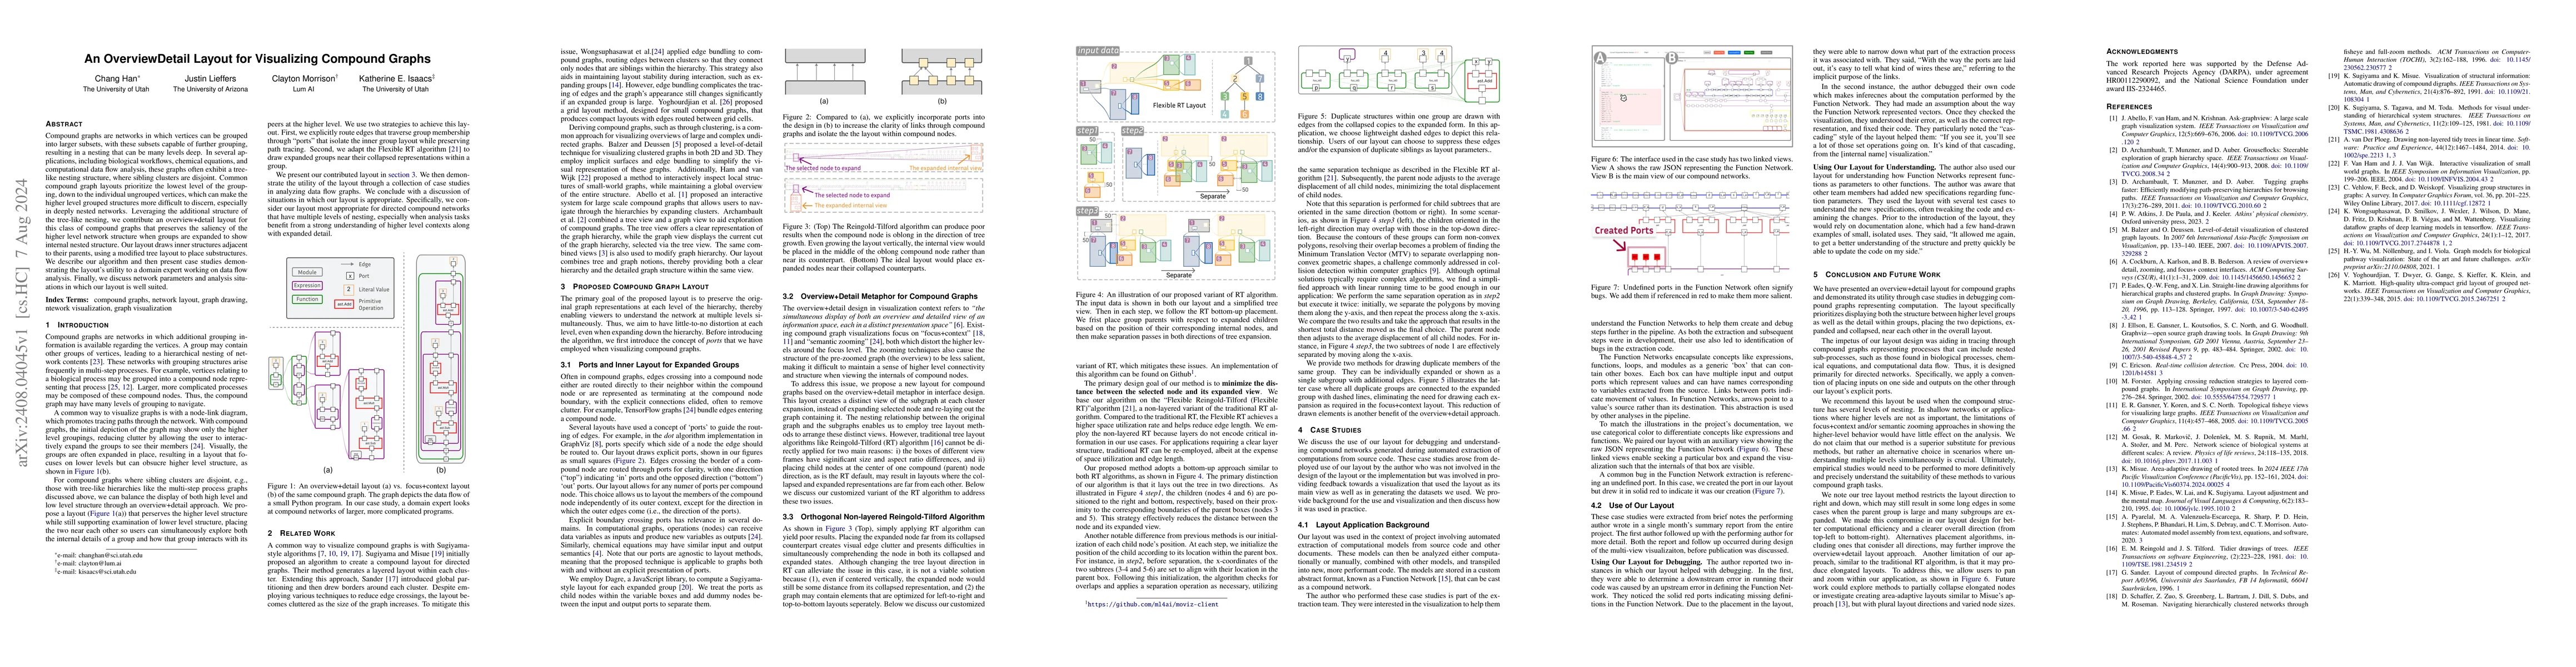
Compound graphs are networks in which vertices can be grouped into larger subsets, with these subsets capable of further grouping, resulting in a nesting that can be many levels deep. In several appli...
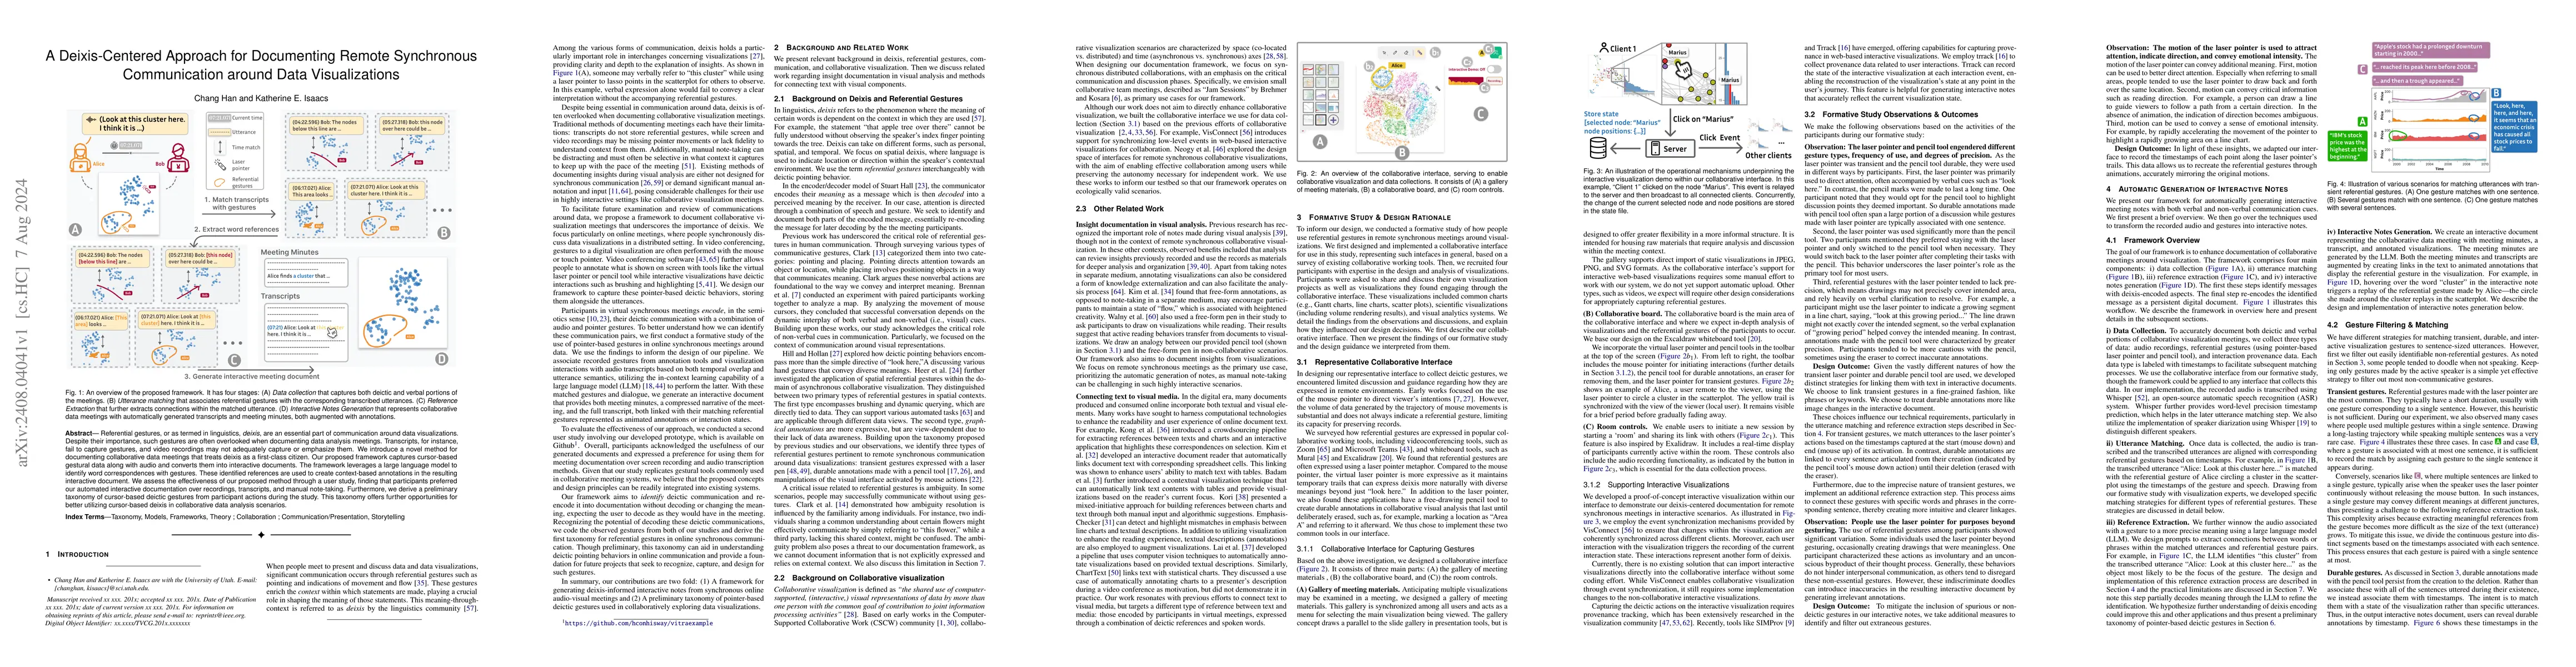
Referential gestures, or as termed in linguistics, deixis, are an essential part of communication around data visualizations. Despite their importance, such gestures are often overlooked when document...
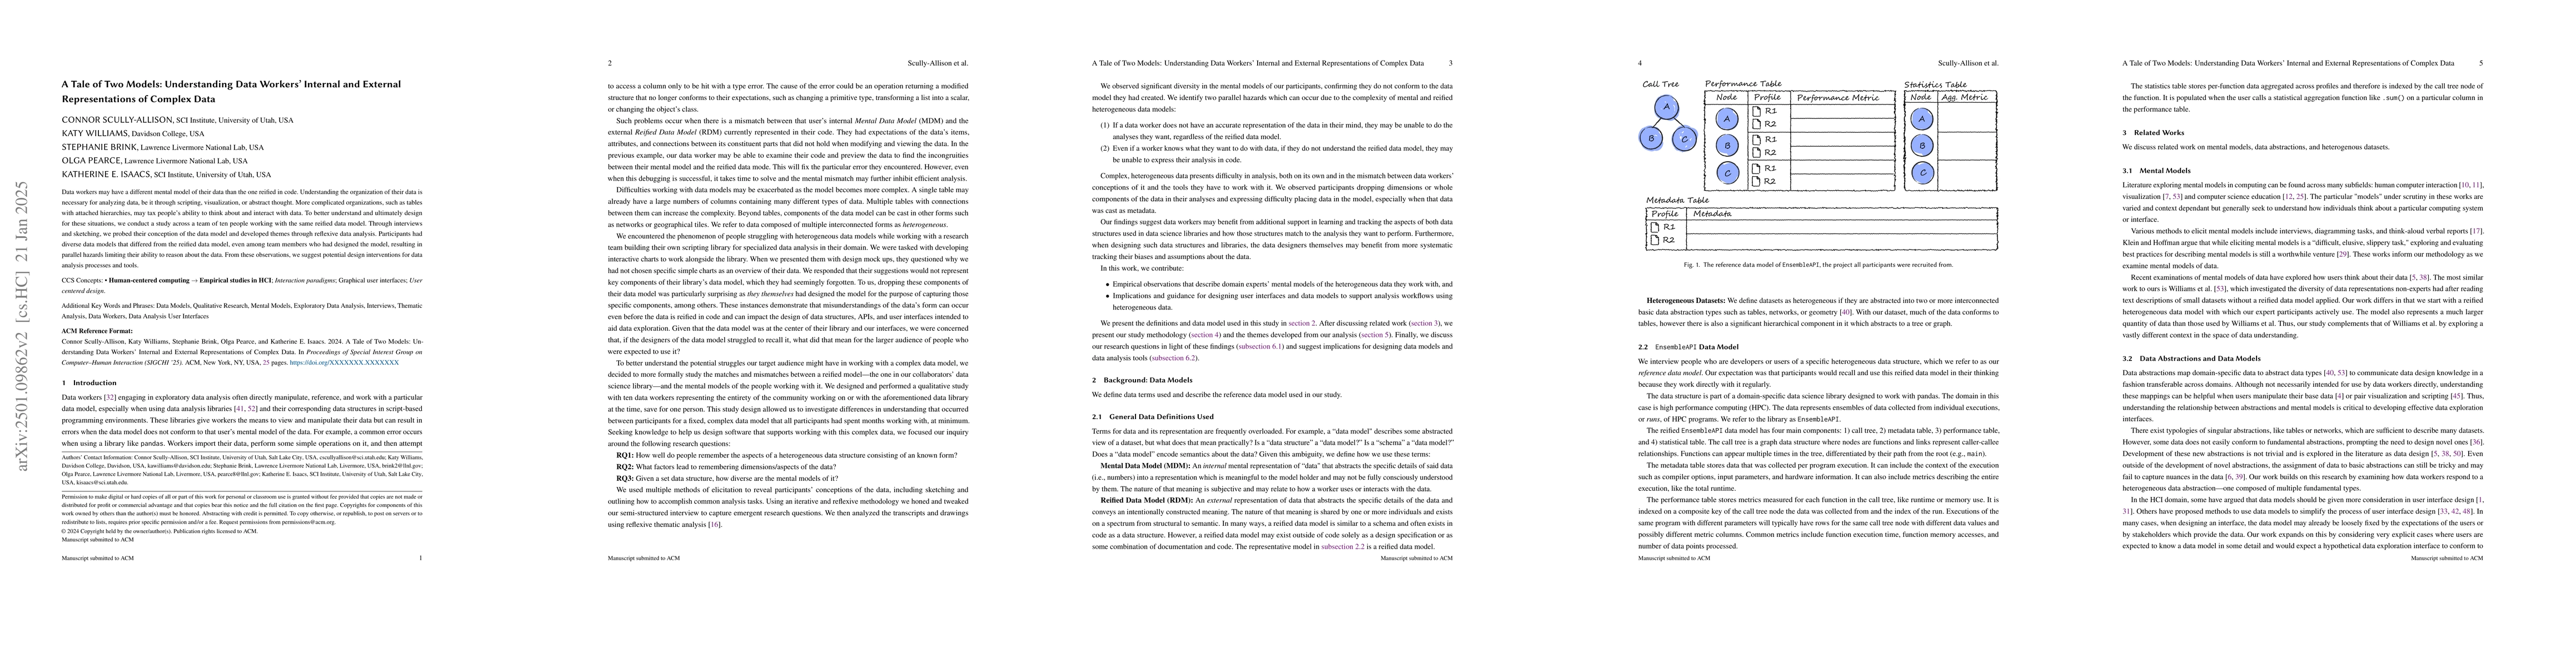
Data workers may have a a different mental model of their data that the one reified in code. Understanding the organization of their data is necessary for analyzing data, be it through scripting, visu...
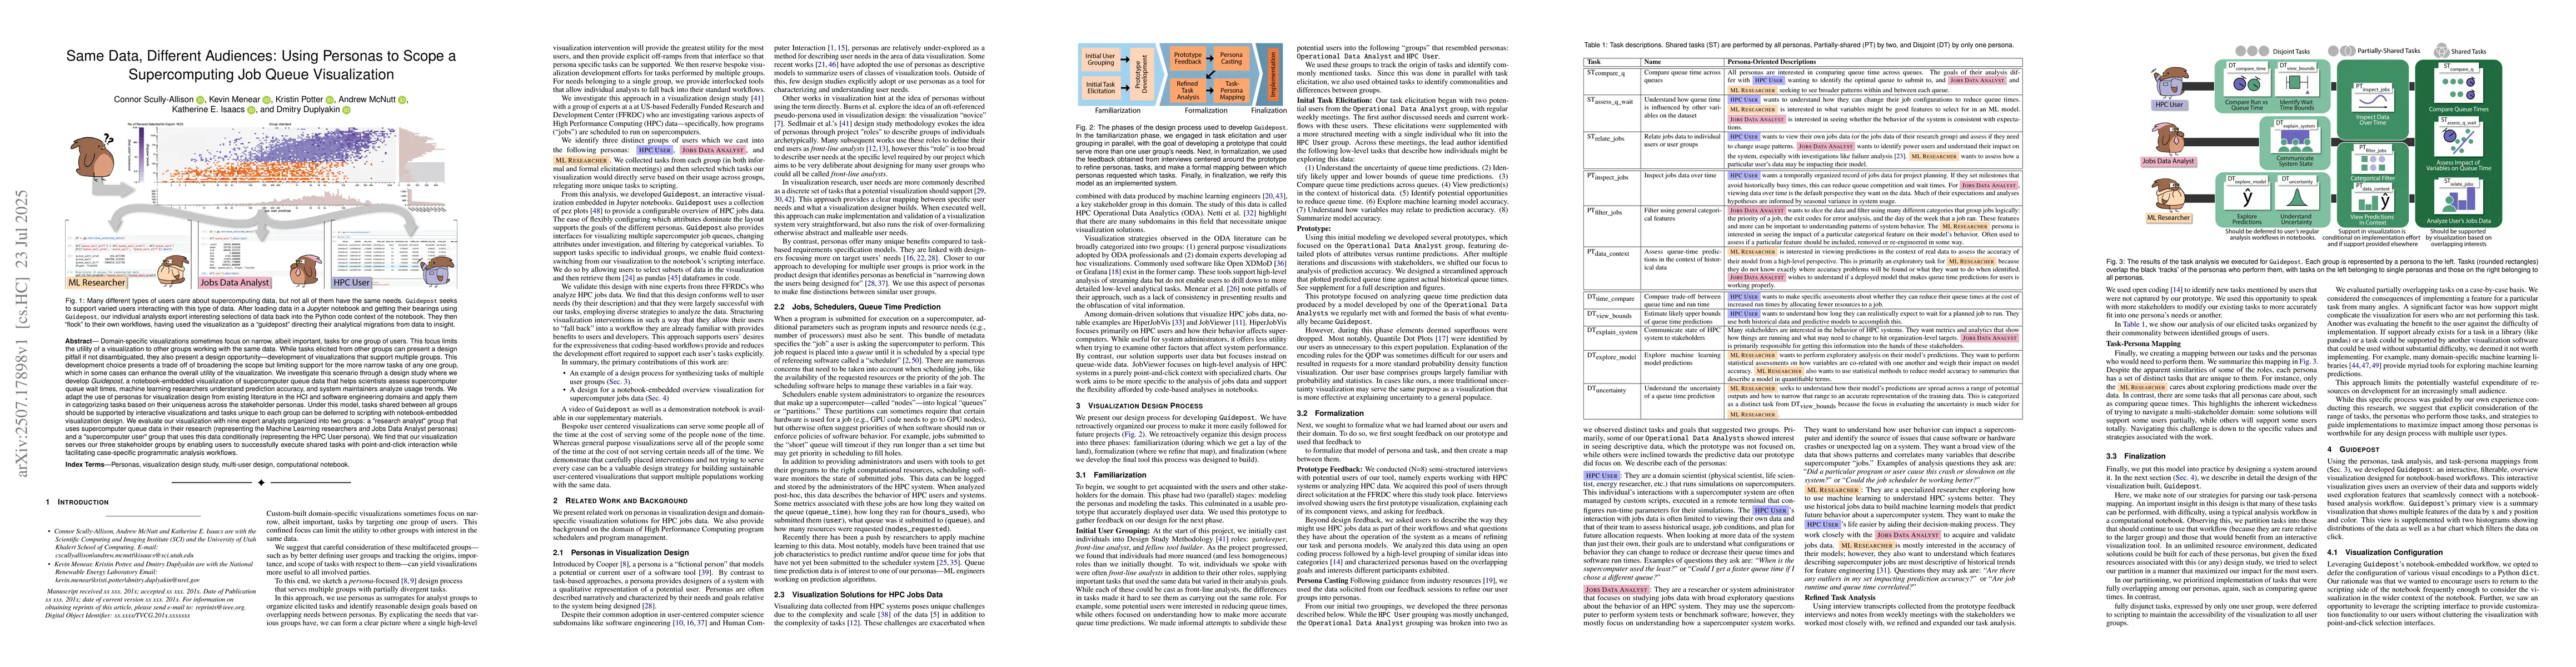
Domain-specific visualizations sometimes focus on narrow, albeit important, tasks for one group of users. This focus limits the utility of a visualization to other groups working with the same data. W...
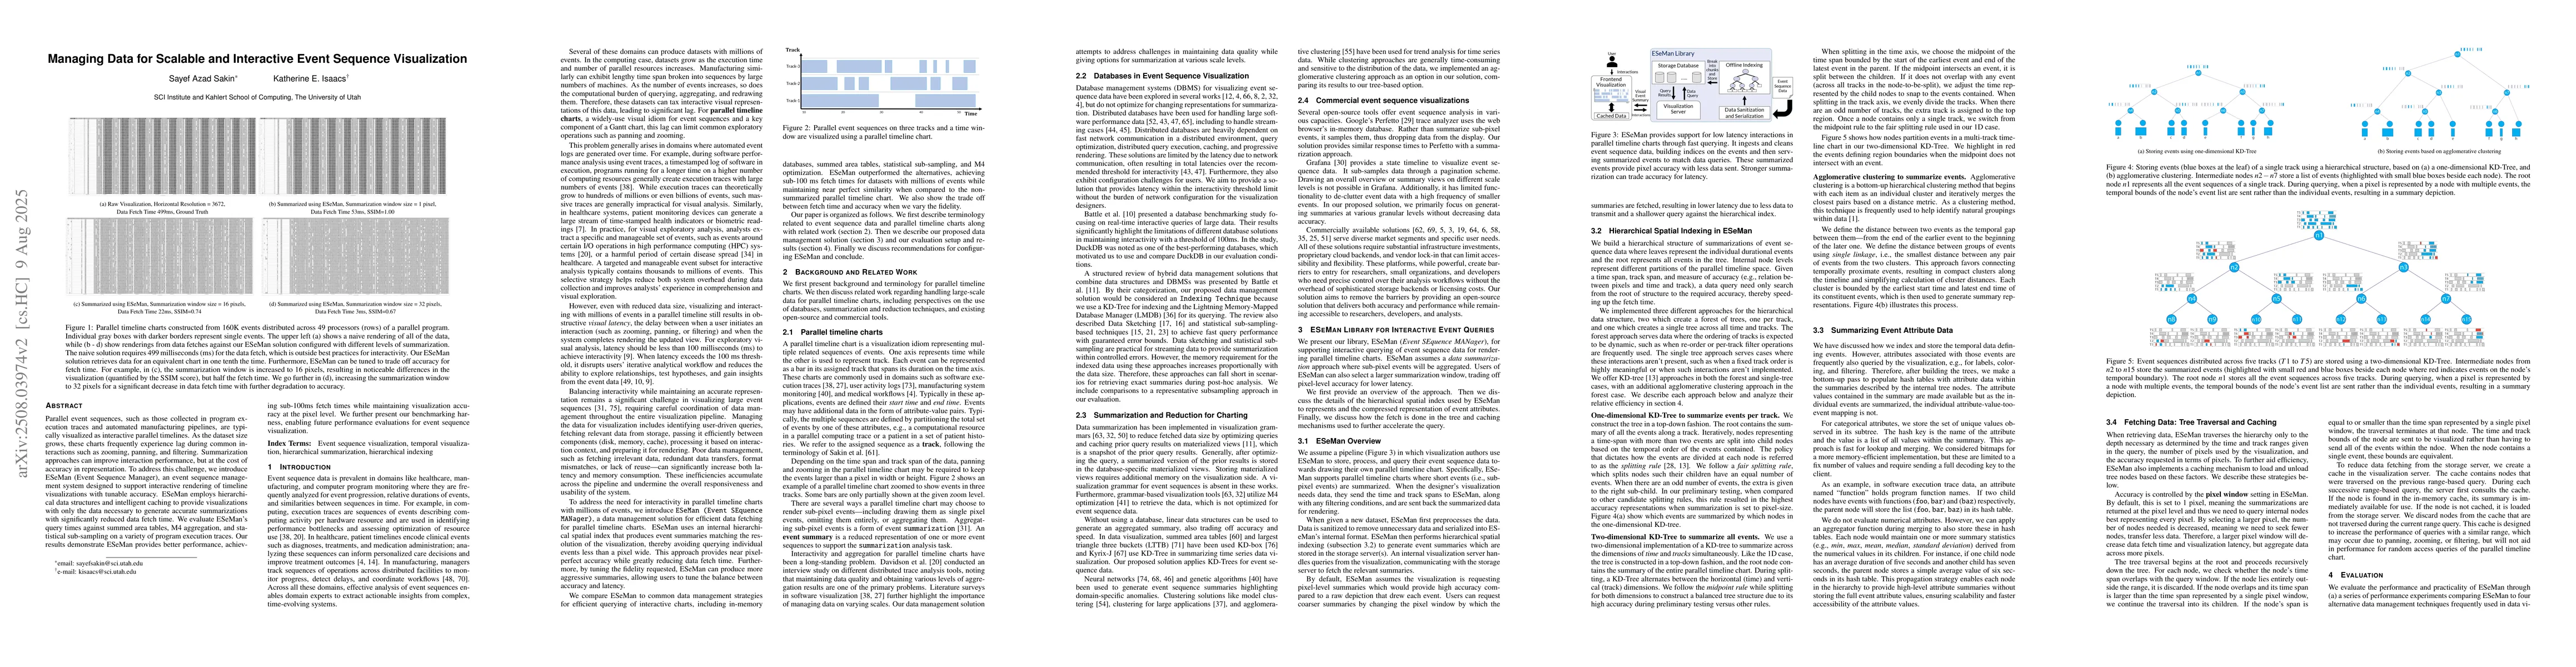
Parallel event sequences, such as those collected in program execution traces and automated manufacturing pipelines, are typically visualized as interactive parallel timelines. As the dataset size gro...
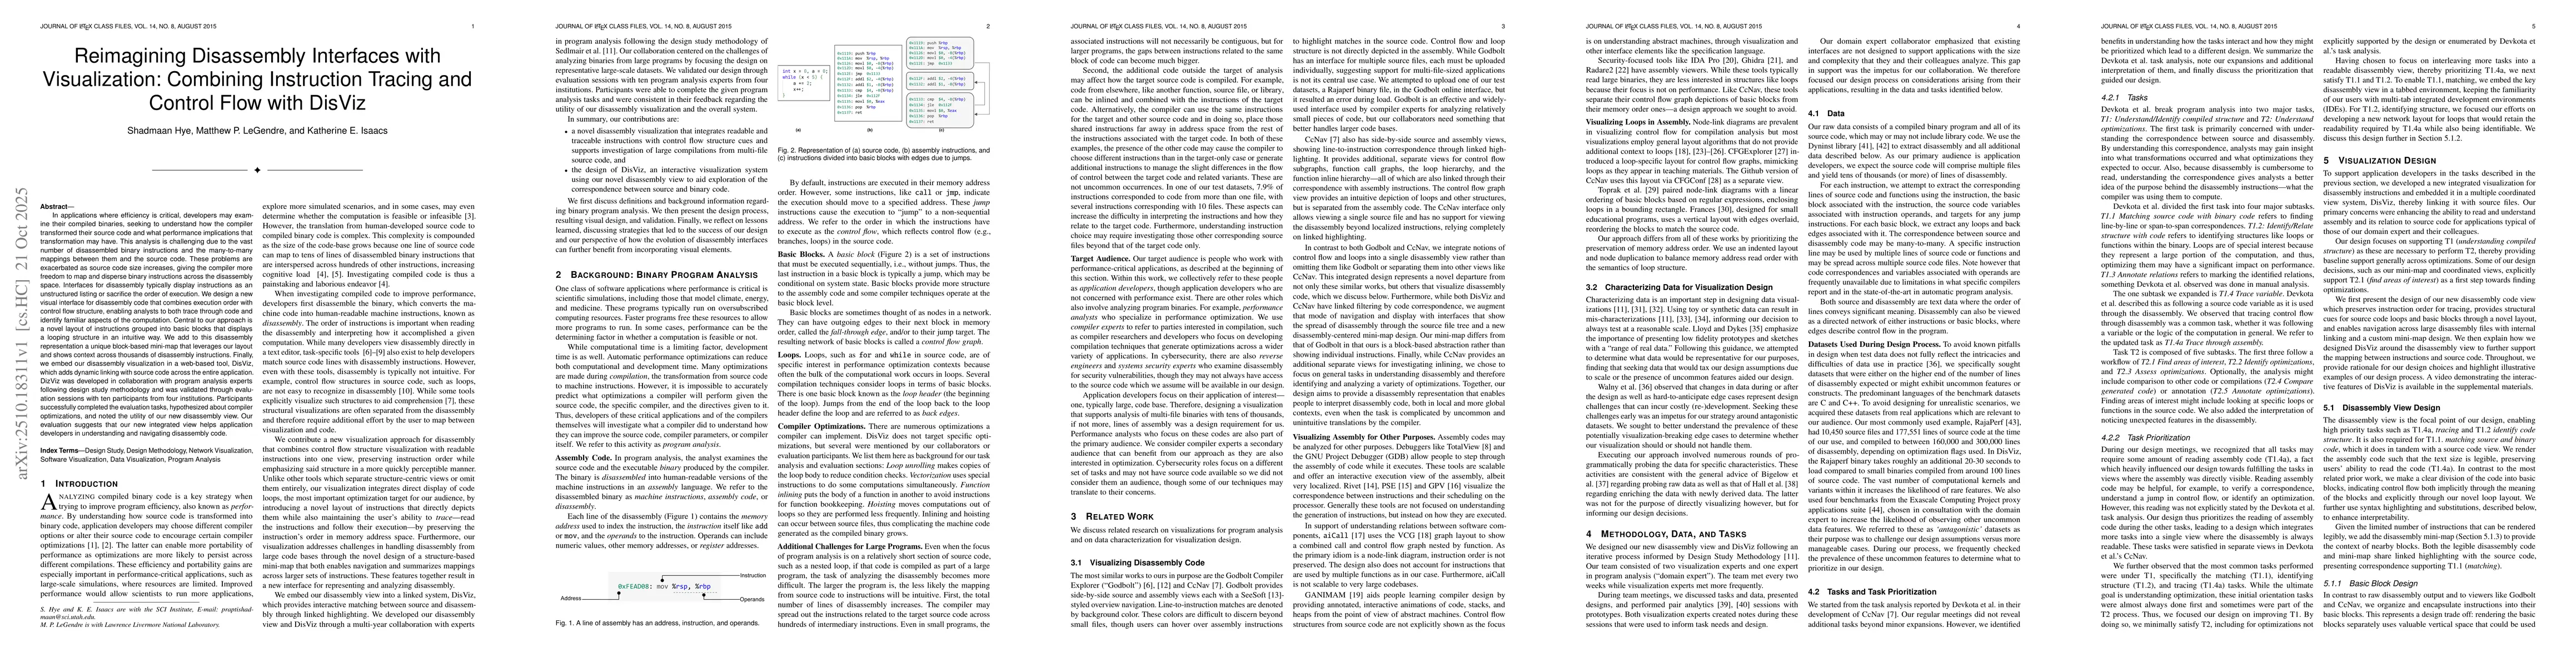
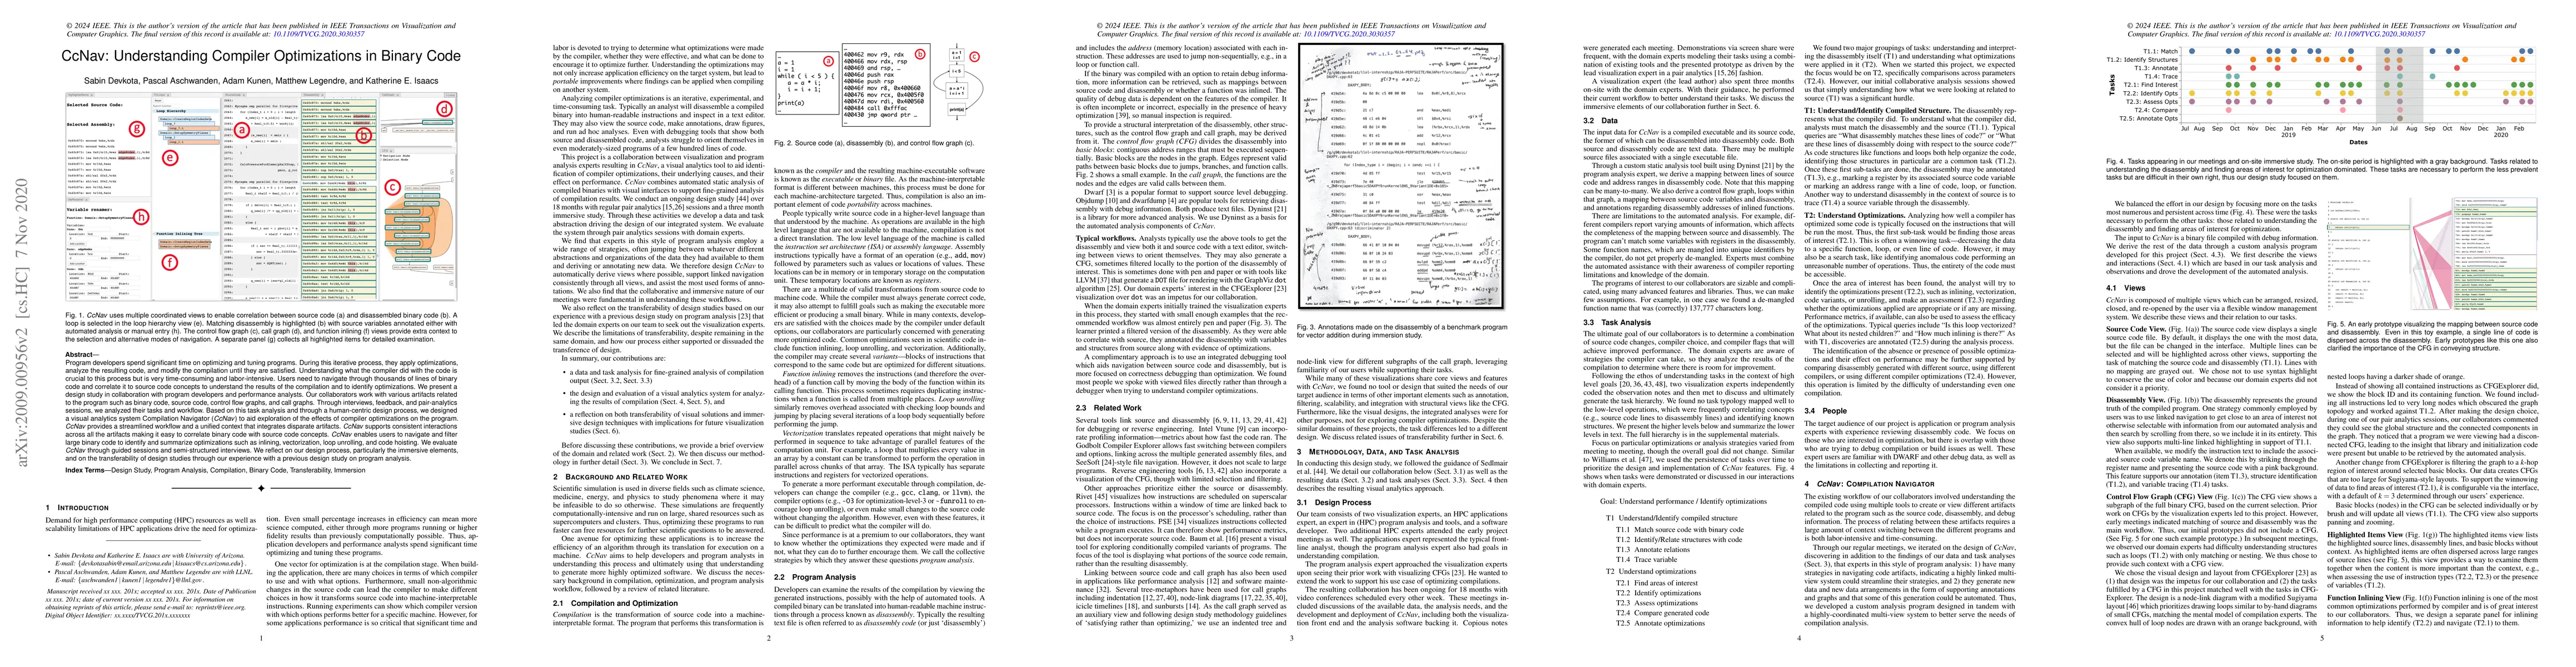
In applications where efficiency is critical, developers may examine their compiled binaries, seeking to understand how the compiler transformed their source code and what performance implications tha...
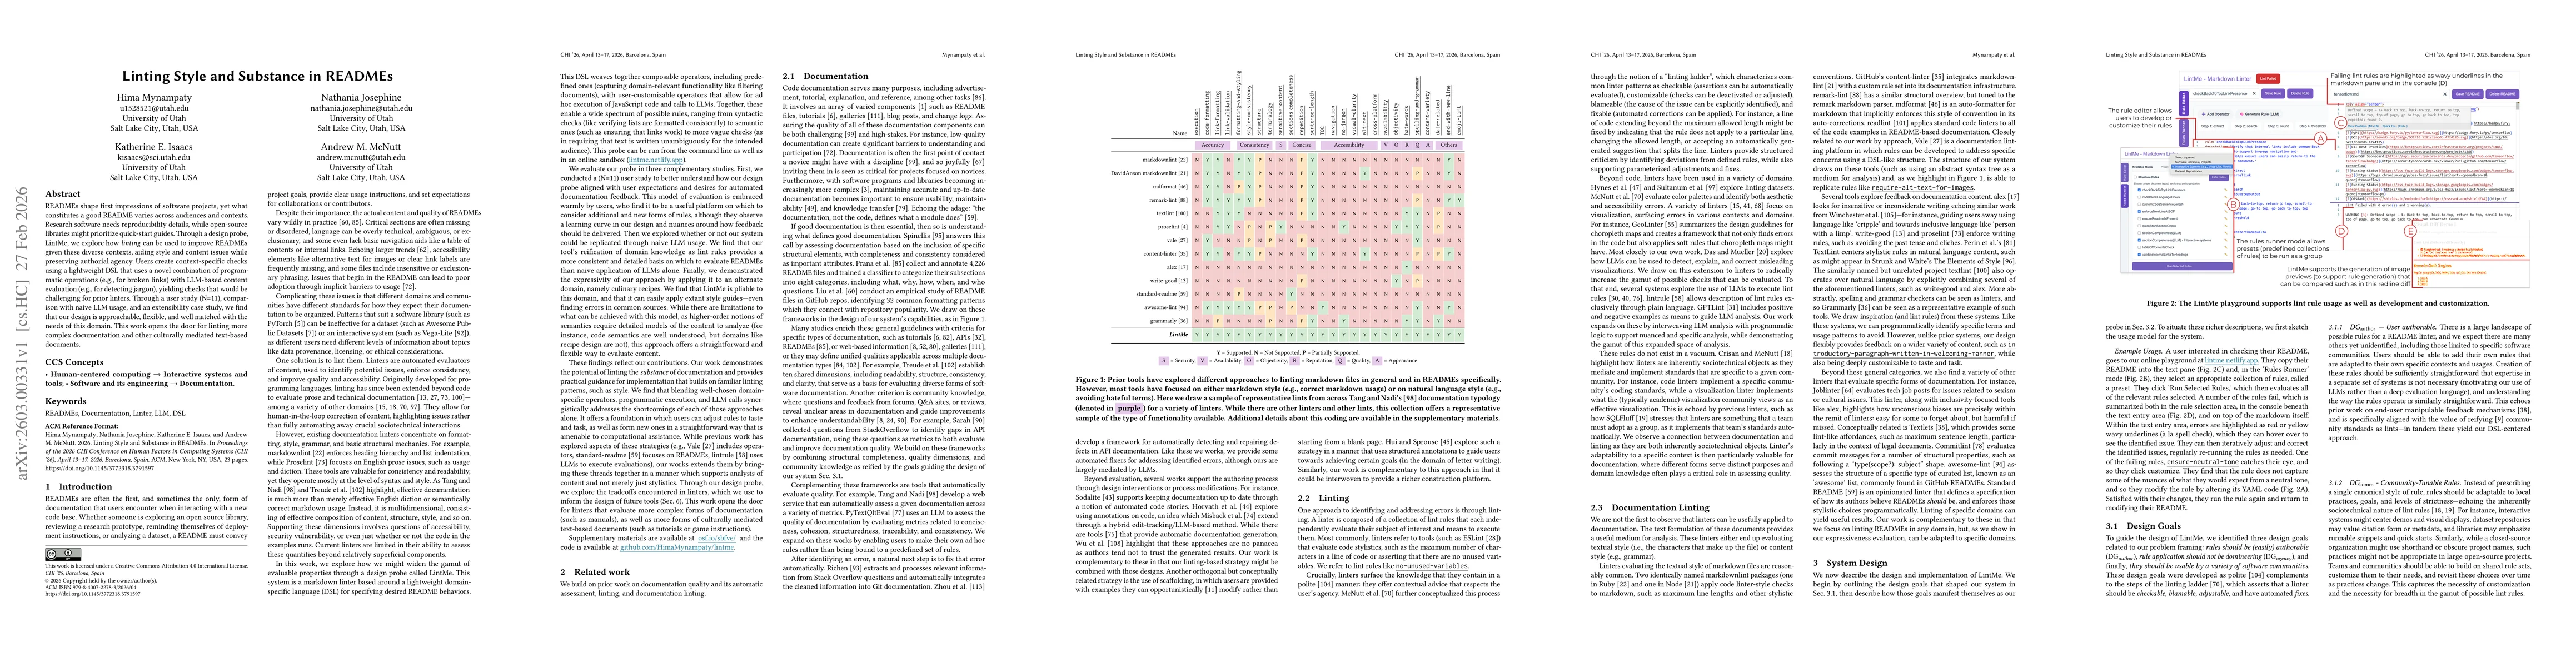
READMEs shape first impressions of software projects, yet what constitutes a good README varies across audiences and contexts. Research software needs reproducibility details, while open-source librar...
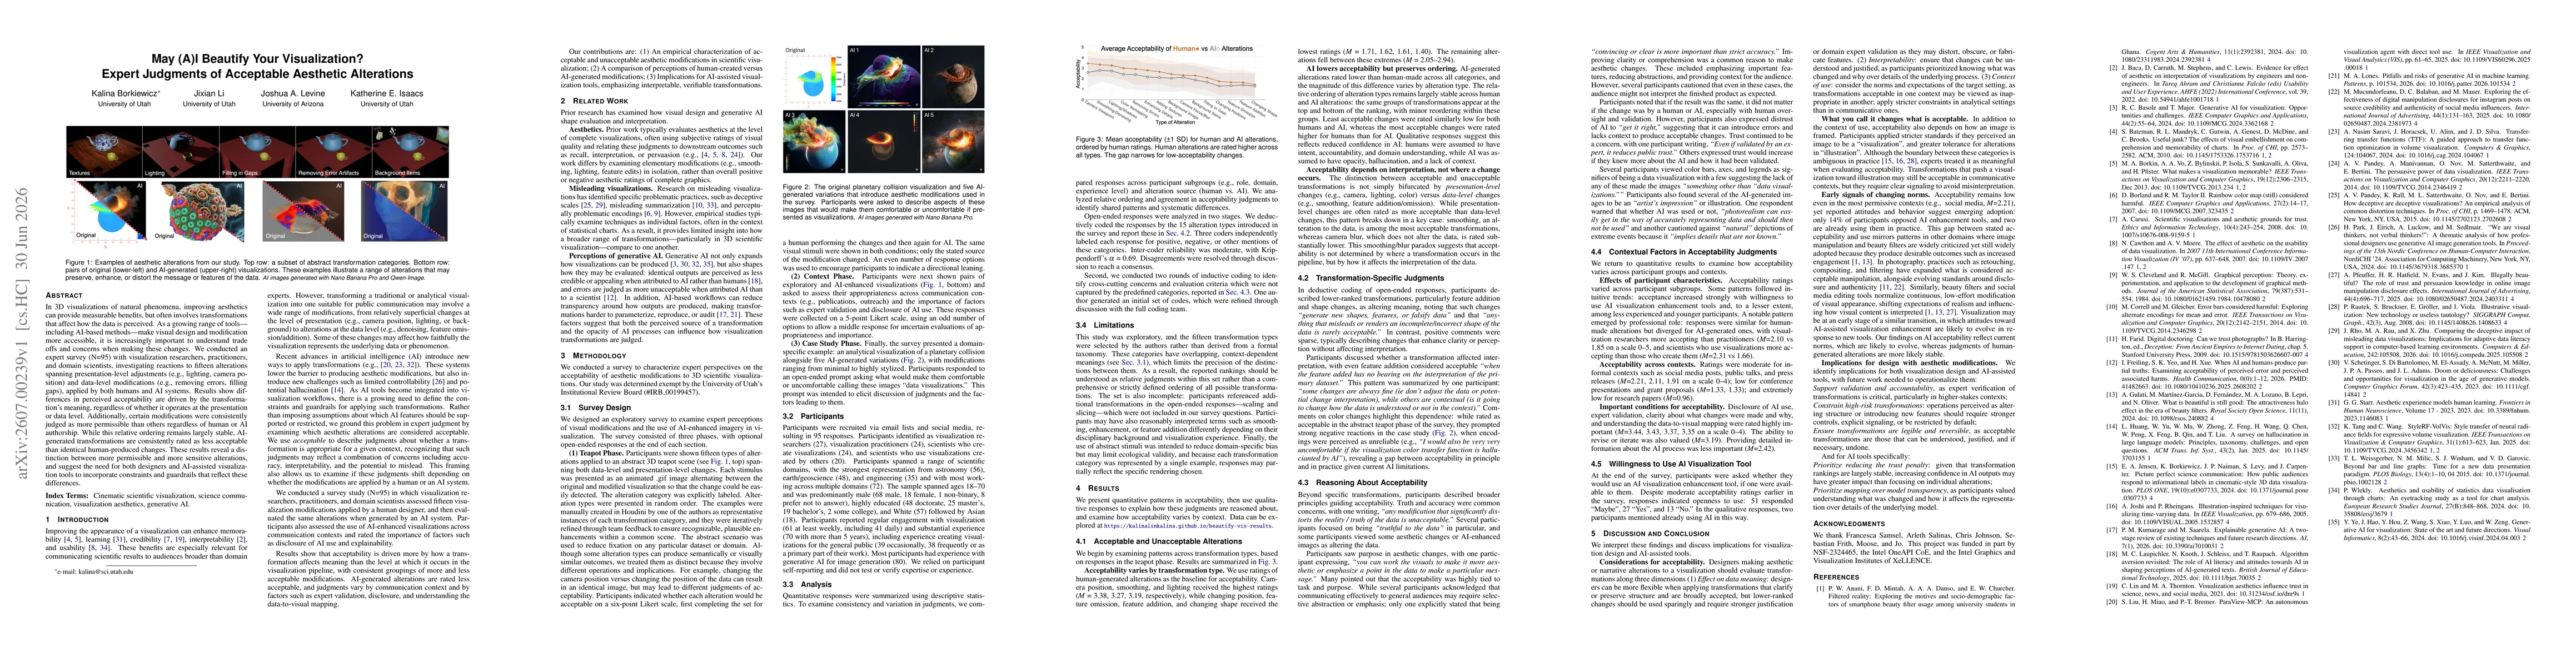
In 3D visualizations of natural phenomena, improving aesthetics can provide measurable benefits, but often involves transformations that affect how the data is perceived. As a growing range of tools -...
Conducting a complete computer architecture simulation study is challenging because configuration, execution, and analysis are often encoded implicitly in scripts or directory conventions rather than ...