A Literature-based Visualization Task Taxonomy for Gantt Charts
Publication
Metrics
AI Quick Summary
This paper presents a taxonomy of low-level visualization tasks supported by Gantt charts, derived from a literature survey, to assist developers in managing large-scale temporal event sequence data efficiently. The taxonomy connects these tasks to relevant data queries for effective and interactive rendering.
Paper Preview
Abstract
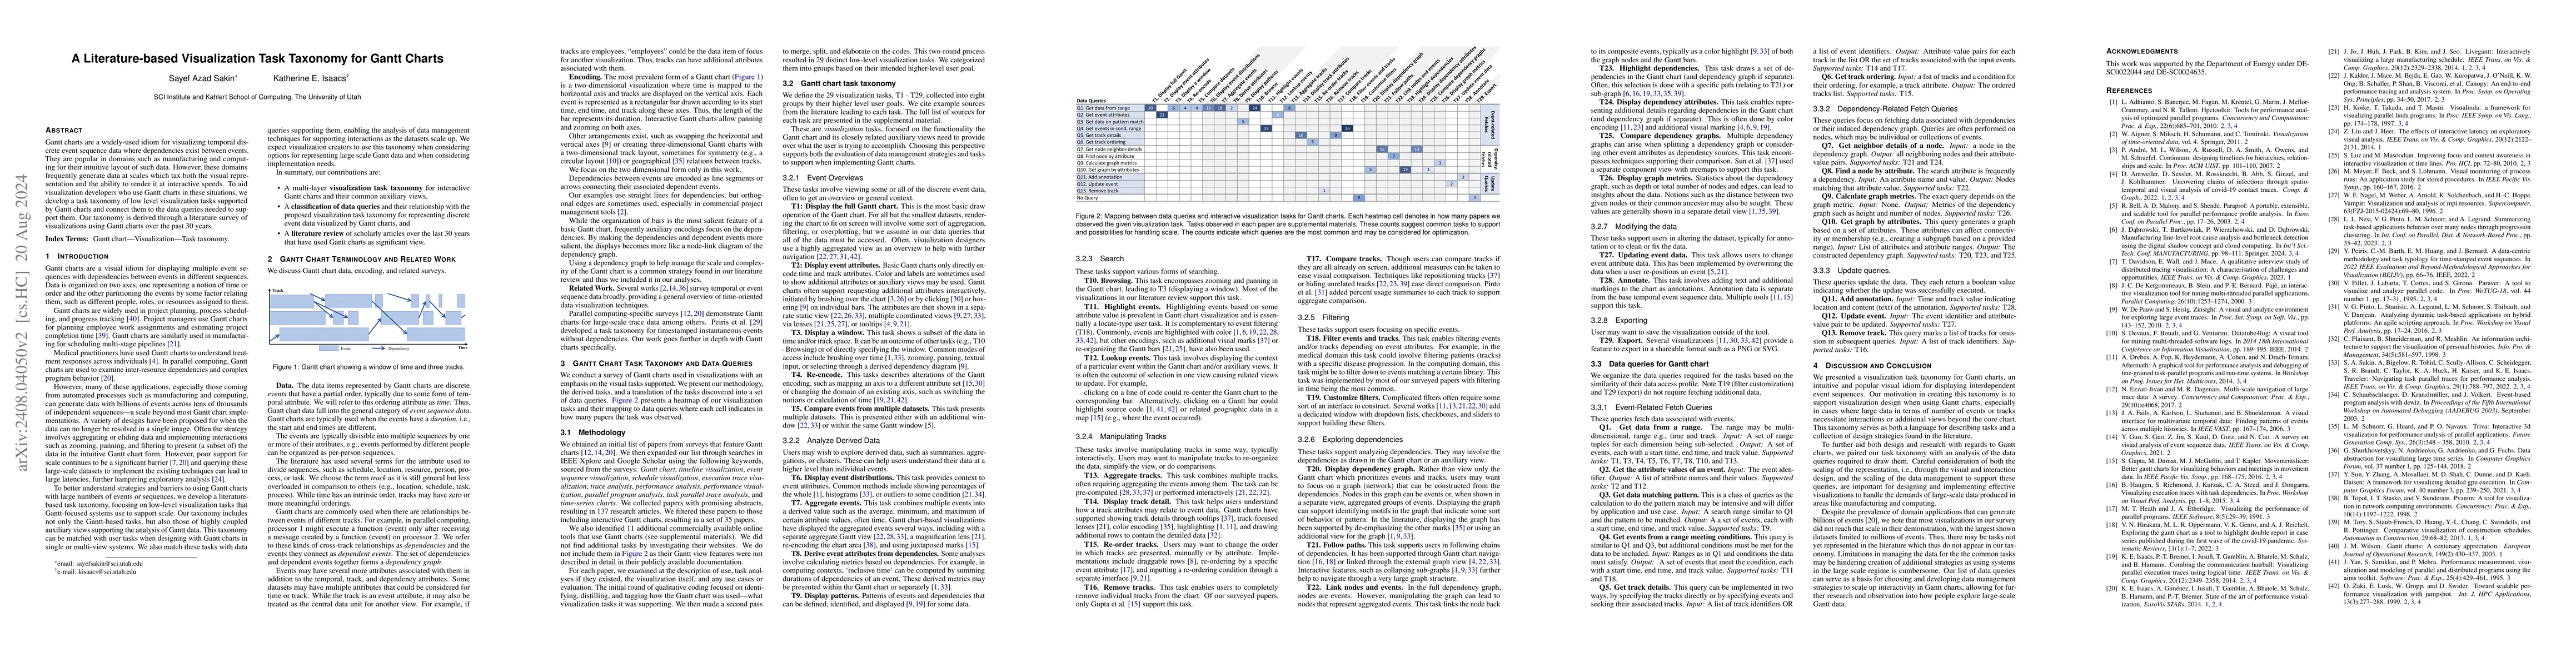
Gantt charts are a widely-used idiom for visualizing temporal discrete event sequence data where dependencies exist between events. They are popular in domains such as manufacturing and computing for their intuitive layout of such data. However, these domains frequently generate data at scales which tax both the visual representation and the ability to render it at interactive speeds. To aid visualization developers who use Gantt charts in these situations, we develop a task taxonomy of low level visualization tasks supported by Gantt charts and connect them to the data queries needed to support them. Our taxonomy is derived through a literature survey of visualizations using Gantt charts over the past 30 years.
AI Key Findings
Get AI-generated insights about this paper's methodology, results, significance, and more — seven facets brought into focus.
Impact
Authors
PDF Preview
Citation Network
Current paper (gray), citations (green), references (blue)
Display is limited for performance on very large graphs.
Discussion 0