This paper aims to enhance graph visualization task taxonomies by defining new group-level tasks that assess comprehension of group, clustering, and hierarchical information in graphs. The authors propose several types of group-level tasks and believe this will improve the utility of the taxonomy for evaluating modern visualization techniques.
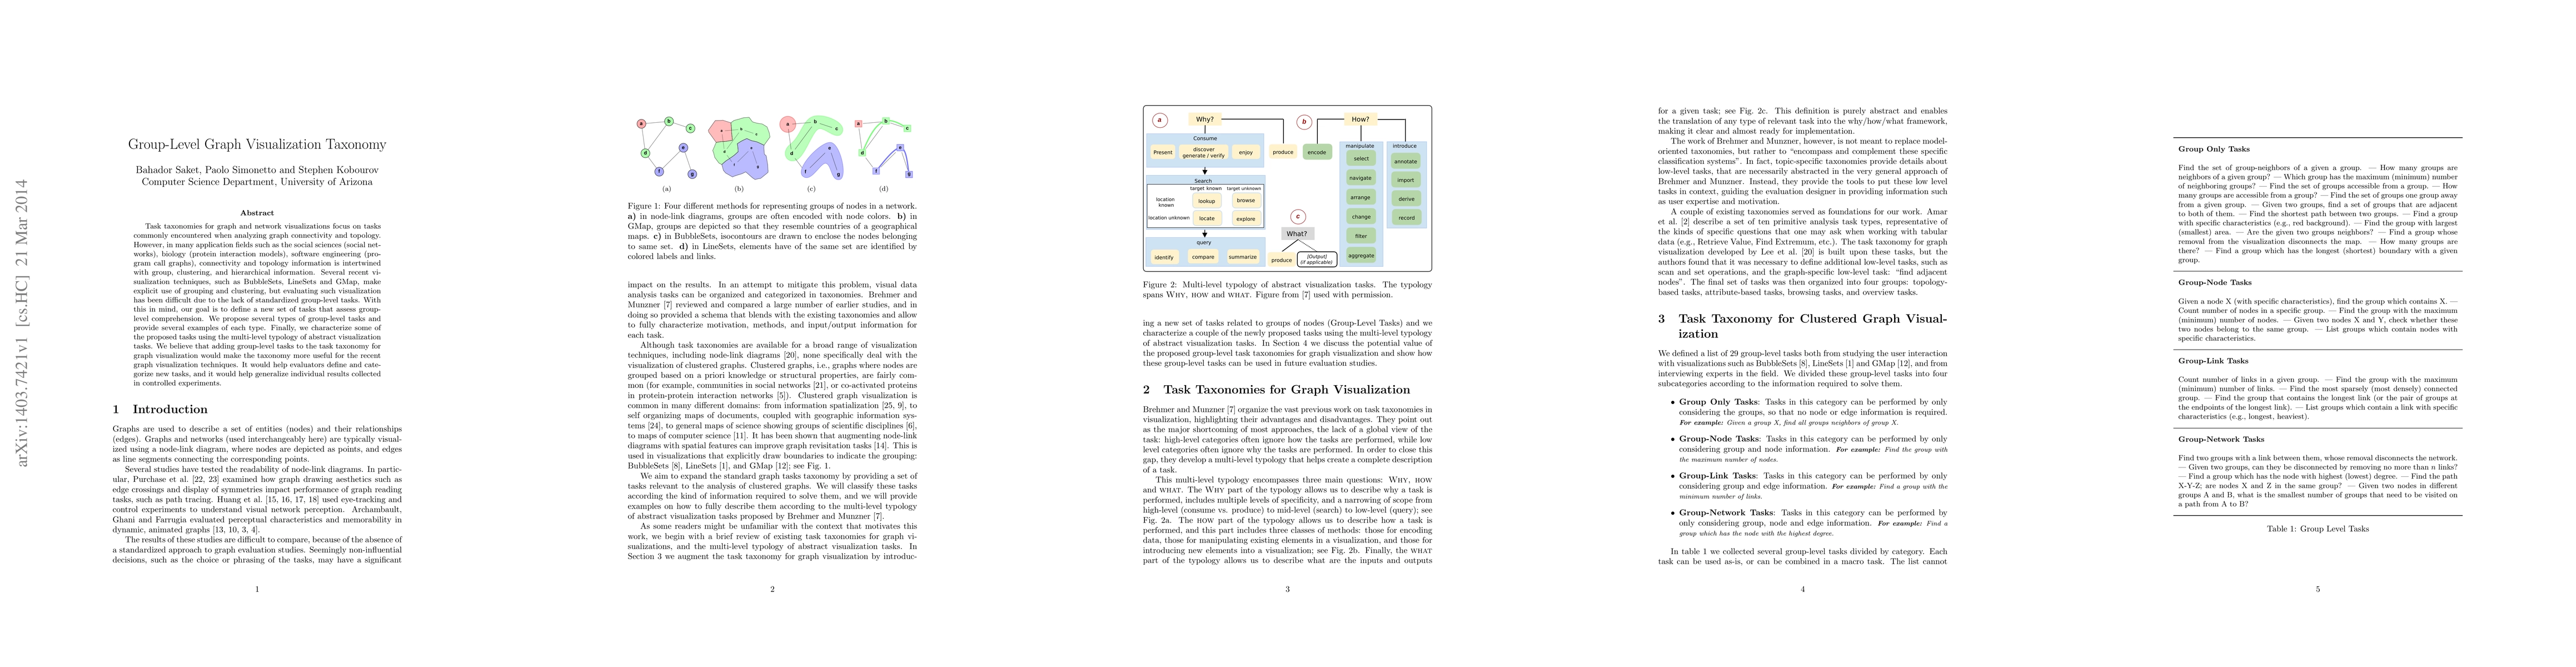
Task taxonomies for graph and network visualizations focus on tasks commonly encountered when analyzing graph connectivity and topology. However, in many application fields such as the social sciences (social networks), biology (protein interaction models), software engineering (program call graphs), connectivity and topology information is intertwined with group, clustering, and hierarchical information. Several recent visualization techniques, such as BubbleSets, LineSets and GMap, make explicit use of grouping and clustering, but evaluating such visualization has been difficult due to the lack of standardized group-level tasks. With this in mind, our goal is to define a new set of tasks that assess group-level comprehension. We propose several types of group-level tasks and provide several examples of each type. Finally, we characterize some of the proposed tasks using the multi-level typology of abstract visualization tasks. We believe that adding group-level tasks to the task taxonomy for graph visualization would make the taxonomy more useful for the recent graph visualization techniques. It would help evaluators define and categorize new tasks, and it would help generalize individual results collected in controlled experiments.
This graph shows how this paper is connected to other research. The current paper is shown in dark gray, papers that cite it are in green, and papers it references are in blue. You can:
• Hover over any node to see the paper title
• Click a node to view that paper's details
• Drag nodes to rearrange the graph
• Use the zoom controls (bottom right) to zoom in/out
Title | Authors | Year | Actions |
---|---|---|---|
A Multi-Layout Design For Immersive Visualization of Hierarchical Network Data
|
David Bauer, Chengbo Zheng, Oh-Hyun Kwon, Kwan-Liu Ma
|
2024
|
View Paper |
DG Comics: Semi-Automatically Authoring Graph Comics for Dynamic Graphs
|
Joohee Kim, Hyunwoo Lee, Duc-Minh Nguyen, Minjeong Shin, Bum Chul Kwon, Sungahn Ko, Niklas Elmqvist
|
2024
|
View Paper |
GuidelineExplorer -- Navigating through the Forrest of Actionable Guidelines on Node-Link Graph Visualization
|
Kathrin Guckes, Lisa Eisenhardt, Margit Pohl, T. V. Landesberger
|
2024
|
View Paper |
Are We There Yet? A Roadmap of Network Visualization from Surveys to Task Taxonomies
|
V. Filipov, Alessio Arleo, Silvia Miksch
|
2023
|
View Paper |
LargeNetVis: Visual Exploration of Large Temporal Networks Based on Community Taxonomies
|
Claudio D. G. Linhares, Jean R. Ponciano, D. S. Pedro, Luis E C Rocha, A. J. Traina, Jorge Poco
|
2022
|
View Paper |
Browser-based Hyperbolic Visualization of Graphs
|
Jacob Miller, S. Kobourov, Vahan Huroyan
|
2022
|
View Paper |
GAN’SDA Wrap: Geographic And Network Structured DAta on surfaces that Wrap around
|
Kun-Ting Chen, Tim Dwyer, Yalong Yang, Benjamin Bach, K. Marriott
|
2022
|
View Paper |
A Multi-Layout Design for Immersive Visualization of Network Data
|
David Bauer, Chengbo Zheng, Oh-Hyun Kwon, Kwan-Liu Ma
|
2021
|
View Paper |
It’s a Wrap: Toroidal Wrapping of Network Visualisations Supports Cluster Understanding Tasks
|
Kun-Ting Chen, Tim Dwyer, Benjamin Bach, K. Marriott
|
2021
|
View Paper |
GraphFederator: Federated Visual Analysis for Multi-party Graphs
|
Dongming Han, Haiyang Zhu, Wei Chen, Rusheng Pan, Yijing Liu, Jiehui Zhou, H. Feng, Tianye Zhang, Xumeng Wang, Minfeng Zhu, Jianrong Tao, Changjie Fan, Xiaolong Luke Zhang
|
2020
|
View Paper |
Integrating Prior Knowledge in Mixed-Initiative Social Network Clustering
|
A. Pister, P. Buono, Jean-Daniel Fekete, C. Plaisant, Paola Valdivia
|
2020
|
View Paper |
Touch? Speech? or Touch and Speech? Investigating Multimodal Interaction for Visual Network Exploration and Analysis
|
Ayshwarya Saktheeswaran, Arjun Srinivasan, J. Stasko
|
2020
|
View Paper |
Evaluating graphical manipulations in automatically laid out LineSets
|
Dominique Tranquille, Gem Stapleton, Jim Burton, P. Rodgers
|
2019
|
View Paper |
Node-Link or Adjacency Matrices: Old Question, New Insights
|
Mershack Okoe, R. Jianu, S. Kobourov
|
2019
|
View Paper |
A Quality Metric for Visualization of Clusters in Graphs
|
Amyra Meidiana, Seok-Hee Hong, P. Eades, D. Keim
|
2019
|
View Paper |
The State of the Art in Visualizing Multivariate Networks
|
C. Nobre, Miriah D. Meyer, M. Streit, A. Lex
|
2019
|
View Paper |
User Evaluation of Group-in-a-Box Variants
|
Nozomi Aoyama, Yosuke Onoue, Yuki Ueno, H. Natsukawa, K. Koyamada
|
2019
|
View Paper |
From Taxonomy to Requirements: A Task Space Partitioning Approach
|
M. El-Shehaly, Natasha Alvarado, Lynn Mcvey, R. Randell, Mamas Mamas, R. Ruddle
|
2018
|
View Paper |
Tangraphe: interactive exploration of network visualizations using single hand, multi-touch gestures
|
John Thompson, Arjun Srinivasan, J. Stasko
|
2018
|
View Paper |
A Data Model and Task Space for Data of Interest (DOI) Eye-Tracking Analyses
|
R. Jianu, S. Alam
|
2018
|
View Paper |
Design and evaluation of line symbolizations for origin–destination flow maps
|
Caglar Koylu, Diansheng Guo
|
2017
|
View Paper |
Visualizing Group Structures in Graphs: A Survey
|
Corinna Vehlow, Fabian Beck, D. Weiskopf
|
2017
|
View Paper |
Revisited Experimental Comparison of Node-Link and Matrix Representations
|
Mershack Okoe, R. Jianu, S. Kobourov
|
2017
|
View Paper |
Evaluating the effects of size in linesets
|
Dominique Tranquille, Gem Stapleton, Jim Burton, P. Rodgers
|
2017
|
View Paper |
Unboxing cluster heatmaps
|
S. Engle, Sean Whalen, Alark Joshi, K. Pollard
|
2017
|
View Paper |
A task-based evaluation of combined set and network visualization
|
P. Rodgers, Gem Stapleton, B. Alsallakh, L. Micallef, Robert Baker, S. Thompson
|
2016
|
View Paper |
Evaluating the Effects of Colour in LineSets
|
Dominique Tranquille, Gem Stapleton, Jim Burton, P. Rodgers
|
2016
|
View Paper |
Understanding Networks beyond Overlapping Clusters
|
V. Guchev, Simone Angelini, G. Amati
|
2016
|
View Paper |
Comparing Node‐Link and Node‐Link‐Group Visualizations From An Enjoyment Perspective
|
B. Saket, C. Scheidegger, S. Kobourov
|
2016
|
View Paper |
Visual Analysis of Governing Topological Structures in Excitable Network Dynamics
|
Quynh Quang Ngo, M. Hütt, L. Linsen
|
2016
|
View Paper |
Study of Visual Clutter in Geographic Node-Link Diagrams
|
A. Debiasi
|
2016
|
View Paper |
AmbiguityVis: Visualization of Ambiguity in Graph Layouts
|
Y. Wang, Qiaomu Shen, D. Archambault, Zhiguang Zhou, Min Zhu, Sixiao Yang, Huamin Qu
|
2016
|
View Paper |
Layer-Centered Approach for Multigraphs Visualization
|
Denis Redondo, A. Sallaberry, D. Ienco, Faraz Zaidi, P. Poncelet
|
2015
|
View Paper |
Map‐based Visualizations Increase Recall Accuracy of Data
|
B. Saket, C. Scheidegger, S. Kobourov, K. Börner
|
2015
|
View Paper |
GraphUnit: Evaluating Interactive Graph Visualizations Using Crowdsourcing
|
Mershack Okoe, R. Jianu
|
2015
|
View Paper |
Dual Adjacency Matrix: Exploring Link Groups in Dense Networks
|
K. Dinkla, N. Riche, M. A. Westenberg
|
2015
|
View Paper |
Node, Node-Link, and Node-Link-Group Diagrams: An Evaluation
|
B. Saket, Paolo Simonetto, S. Kobourov, K. Börner
|
2014
|
View Paper |
User-Defined Interactions for Visual Data Exploration With the Combination of Smartwatch and Large Display
|
Yi Xiao, Lu Liu
|
2024
|
View Paper |
A Multi-Layout Approach to Immersive Visualization of Network Data
|
David Bauer, Chengbo Zheng, Oh-Hyun Kwon, K. Ma
|
2021
|
View Paper |
The effects of manipulating graphical properties of LineSets on user comprehension
|
Dominique Tranquille
|
2019
|
View Paper |
Orko: Facilitating Multimodal Interaction for Visual Exploration and Analysis of Networks
|
Arjun Srinivasan, J. Stasko
|
2018
|
View Paper |
Revisited Network Representations
|
Mershack Okoe, R. Jianu, S. Kobourov
|
2017
|
View Paper |
Analysis of Eye-tracking Data in Visualization and Data Space
|
S. Alam
|
2017
|
View Paper |
Supporting web-based and crowdsourced evaluations of data visualizations
|
Mershack Okoe
|
2016
|
View Paper |
A Survey of Multi-faceted Graph Visualization
|
S. Hadlak, H. Schumann, Hans-Jörg Schulz
|
2015
|
View Paper |
Visualization of modular structures in biological networks
|
K. Dinkla
|
2015
|
View Paper |
Understanding geo-social network patterns: Computation, visualization, and usability
|
Caglar Koylu
|
2014
|
View Paper |
Visualization Task Abstraction from Multiple Perspectives
|
M. Brehmer
|
2014
|
View Paper |
Evaluating Graphical Manipulations in Automatically Laid Out LineSets
|
LineSets
|
View Paper |
Katherine E. Isaacs, Sayef Azad Sakin
Published: 2024-08-07
Published: 2019-12-10
Comments (0)