ArxivLens

Quick Summary:

This paper proposes the Zoomable Multi-Level Tree (ZMLT) algorithm for visualizing large graphs in a map-like, multi-level tree format. The algorithm maintains seven properties to ensure accurate representation, clarity, and usability, and a prototype has been developed for interactive web-based visualization.

arXiv Id: 1906.05996
Date Published: 2019-12-10
Date Updated: 2019-12-10

Categories:

Key Terms (TF-IDF):

multi level (0.226)
appropriately (0.214)
underlying (0.209)
level (0.208)
levels (0.207)
trees (0.195)
details (0.183)
node (0.180)
tree (0.178)
graph (0.174)
represent (0.166)
area (0.162)
graphs (0.160)
edge (0.158)
map (0.157)
algorithm (0.147)
recall (0.132)
interactive (0.130)
seven (0.129)
deeper (0.125)
License: http://arxiv.org/licenses/nonexclusive-distrib/1.0/

Summary:

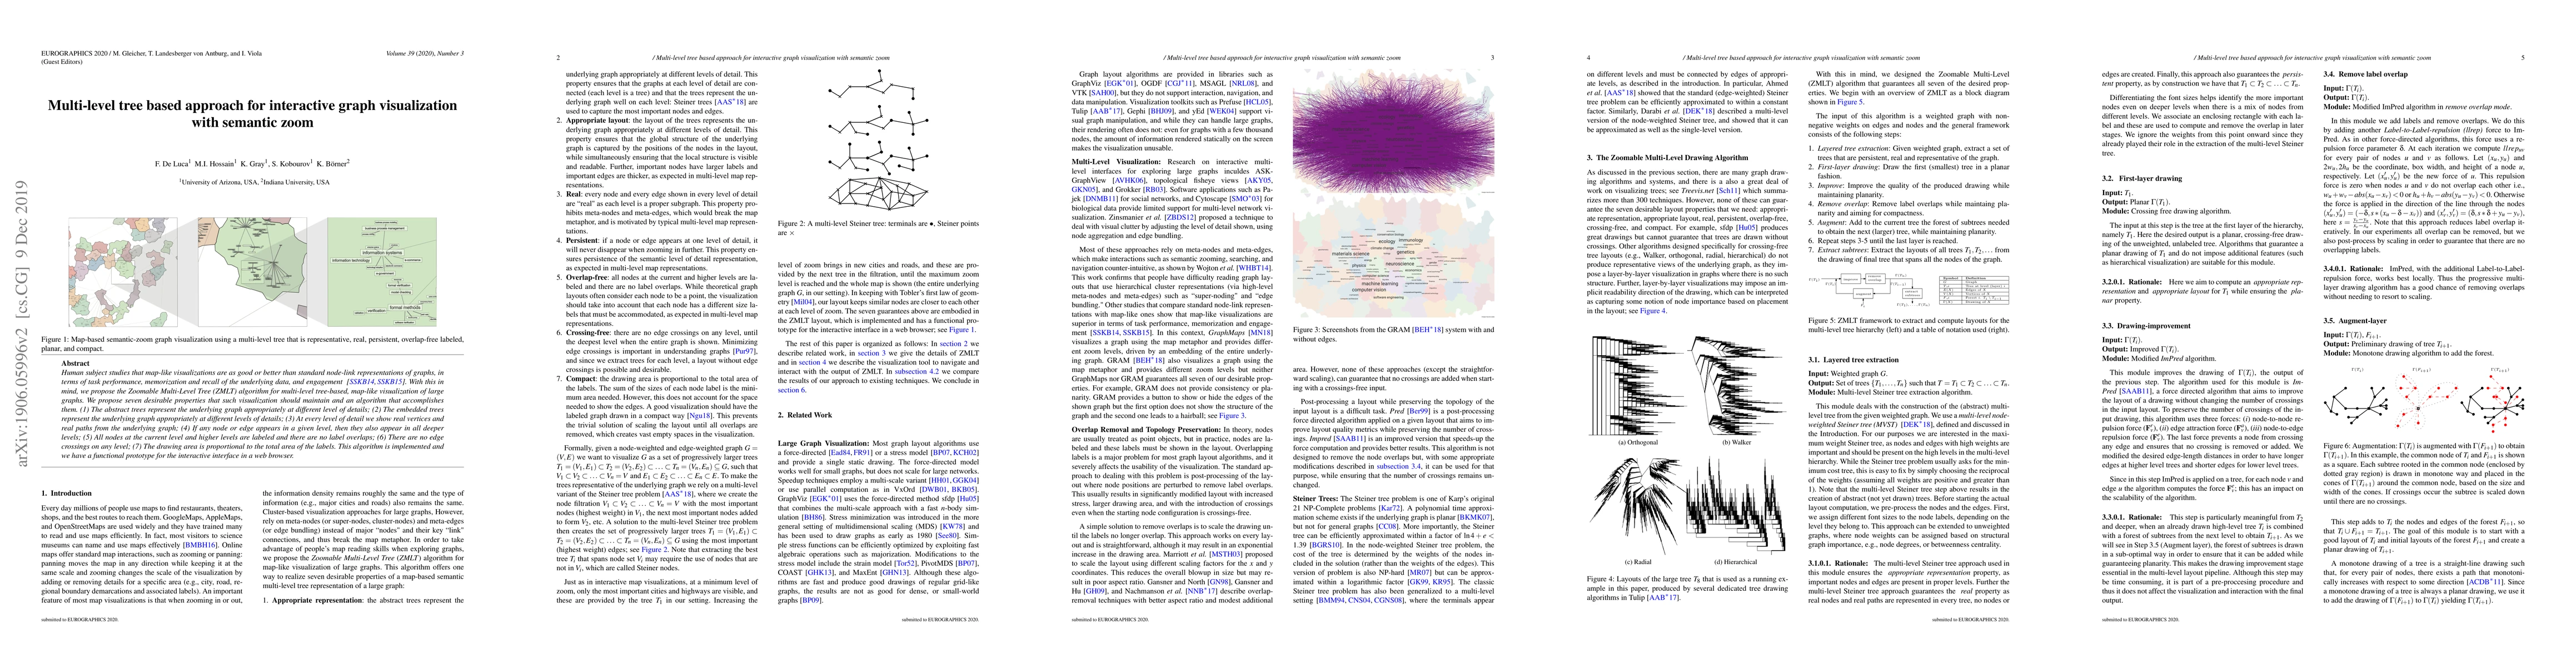
Human subject studies that map-like visualizations are as good or better than standard node-link representations of graphs, in terms of task performance, memorization and recall of the underlying data, and engagement [SSKB14, SSKB15]. With this in mind, we propose the Zoomable Multi-Level Tree (ZMLT) algorithm for multi-level tree-based, map-like visualization of large graphs. We propose seven desirable properties that such visualization should maintain and an algorithm that accomplishes them. (1) The abstract trees represent the underlying graph appropriately at different level of details; (2) The embedded trees represent the underlying graph appropriately at different levels of details; (3) At every level of detail we show real vertices and real paths from the underlying graph; (4) If any node or edge appears in a given level, then they also appear in all deeper levels; (5) All nodes at the current level and higher levels are labeled and there are no label overlaps; (6) There are no edge crossings on any level; (7) The drawing area is proportional to the total area of the labels. This algorithm is implemented and we have a functional prototype for the interactive interface in a web browser.

Citation & Reference Network Visualization

This graph shows how this paper is connected to other research. The current paper is shown in dark gray, papers that cite it are in green, and papers it references are in blue. You can:

Current Paper
Papers citing this work (Citations)
Papers cited by this work (References)

• Hover over any node to see the paper title

• Click a node to view that paper's details

• Drag nodes to rearrange the graph

• Use the zoom controls (bottom right) to zoom in/out

Citations and References

Title Authors Year Actions
myAURA: Personalized health library for epilepsy management via knowledge graph sparsification and visualization
Rion Brattig Correia, Jordan C. Rozum, Leonard E. Cross, Jack Felag, Mike Gallant, Ziqi Guo, B. Herr, Aehong Min, Deborah Stungis Rocha, Xuan Wang, Katy Börner, Wendy Miller, Luis M. Rocha
2024
View Paper
Introducing the open biomedical map of science
Michael Ginda, B. Herr, Katy Börner
2023
View Paper
Model Sensemaking Strategies: Exploiting Meta-Model Patterns to Understand Large Models
Francisco Martínez-Lasaca, Pablo Díez, E. Guerra, J. Lara
2023
View Paper
PromptMagician: Interactive Prompt Engineering for Text-to-Image Creation
Yingchaojie Feng, Xingbo Wang, Kamkwai Wong, Sijia Wang, Yuhong Lu, Minfeng Zhu, Baicheng Wang, Wei Chen
2023
View Paper
Visualizing Interaction Networks and Evidence in Biomedical Corpora
Enrique Noriega-Atala, Md. Rahat-Uz-Zaman, Ruchika Bhat, M. Jergović, S. Kobourov, J. Nikolich-Žugich
2023
View Paper
Scalable force-directed graph representation learning and visualization
Md. Khaledur Rahman, Majedul Haque Sujon, A. Azad
2022
View Paper
An Analytical Survey on Recent Trends in High Dimensional Data Visualization
Alex B. Kiefer, Md. Khaledur Rahman
2021
View Paper
BatchLayout: A Batch-Parallel Force-Directed Graph Layout Algorithm in Shared Memory
Md. Khaledur Rahman, Majedul Haque Sujon, A. Azad
2020
View Paper

Comments (0)

This website uses cookies to ensure you get the best experience. Learn more