graphVizdb is a scalable platform for interactive visualization of large graphs, employing offline preprocessing to create abstraction layers and spatial indexing for efficient, low-latency navigation and exploration. The web-based prototype supports interactive navigation, multi-level exploration, and keyword search on graph metadata.
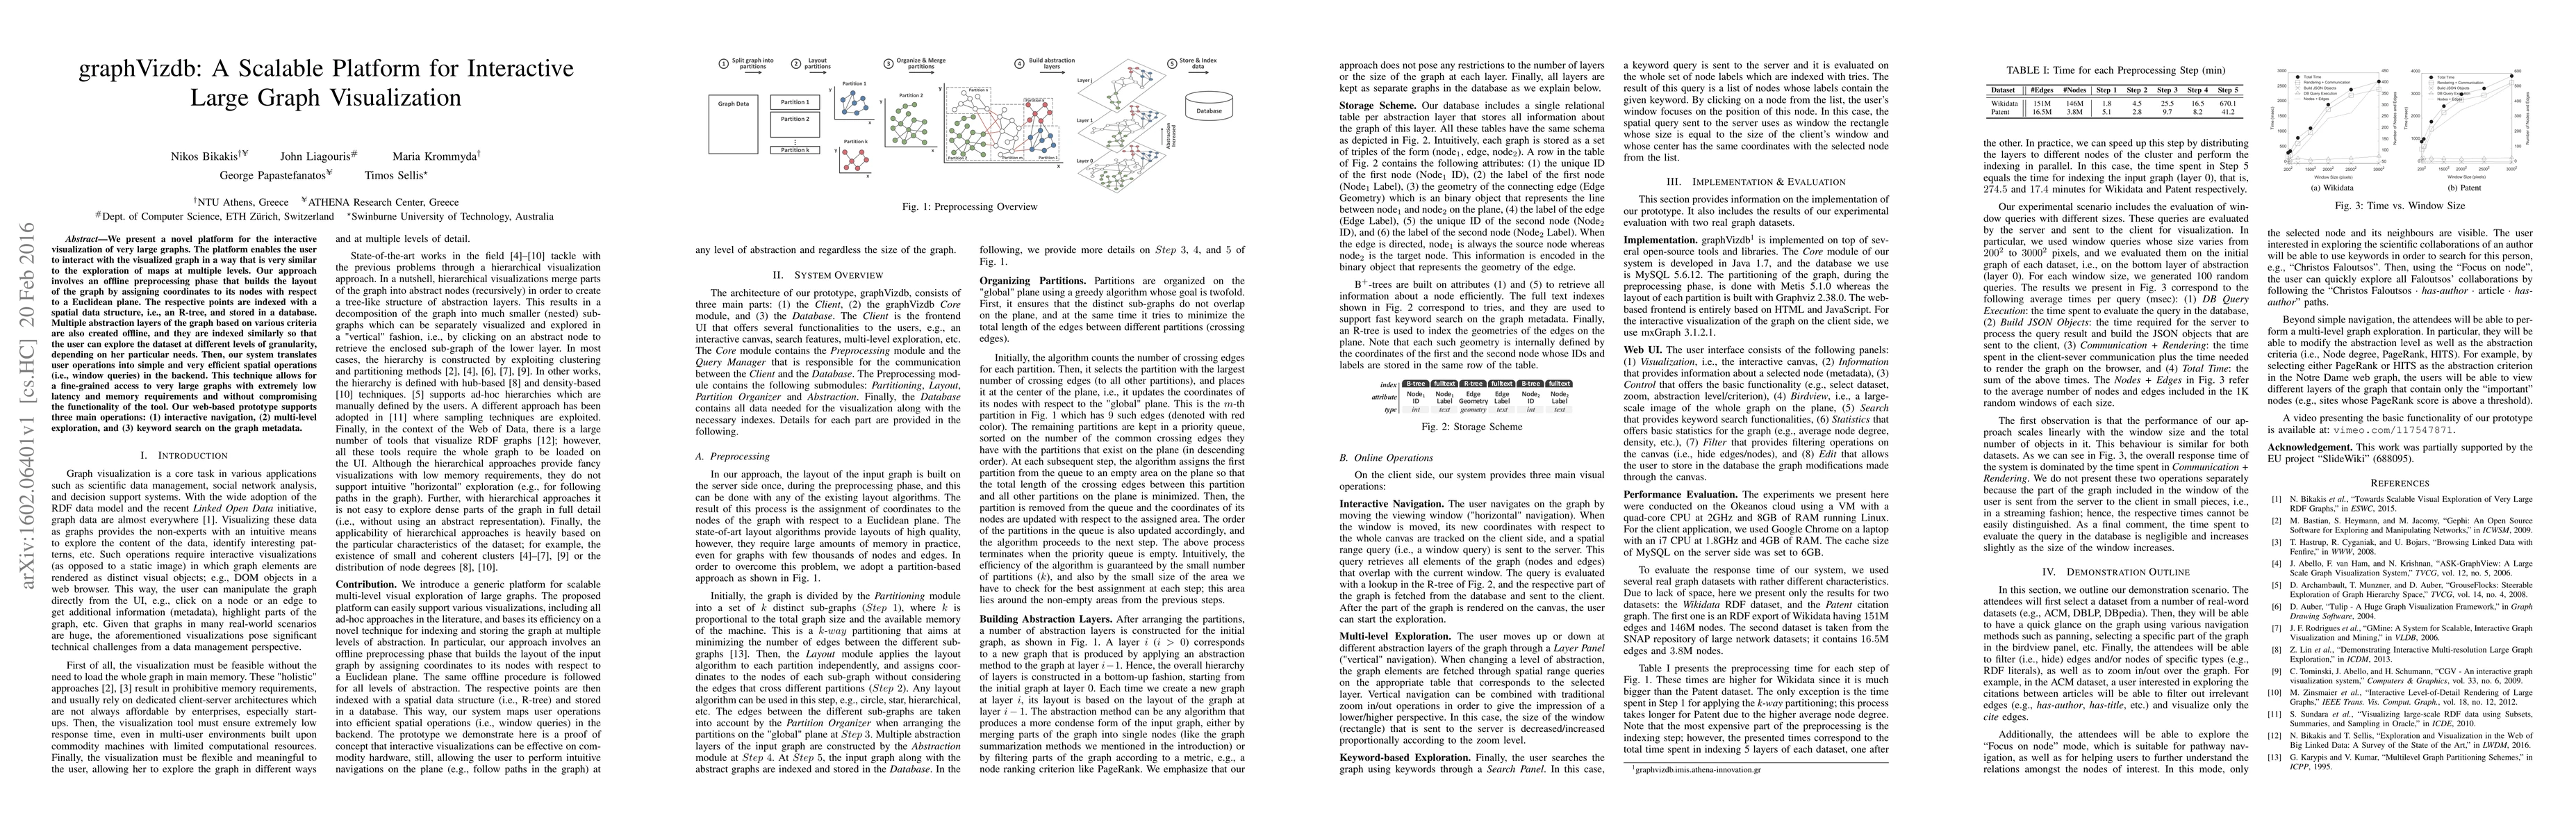
We present a novel platform for the interactive visualization of very large graphs. The platform enables the user to interact with the visualized graph in a way that is very similar to the exploration of maps at multiple levels. Our approach involves an offline preprocessing phase that builds the layout of the graph by assigning coordinates to its nodes with respect to a Euclidean plane. The respective points are indexed with a spatial data structure, i.e., an R-tree, and stored in a database. Multiple abstraction layers of the graph based on various criteria are also created offline, and they are indexed similarly so that the user can explore the dataset at different levels of granularity, depending on her particular needs. Then, our system translates user operations into simple and very efficient spatial operations (i.e., window queries) in the backend. This technique allows for a fine-grained access to very large graphs with extremely low latency and memory requirements and without compromising the functionality of the tool. Our web-based prototype supports three main operations: (1) interactive navigation, (2) multi-level exploration, and (3) keyword search on the graph metadata.
This graph shows how this paper is connected to other research. The current paper is shown in dark gray, papers that cite it are in green, and papers it references are in blue. You can:
• Hover over any node to see the paper title
• Click a node to view that paper's details
• Drag nodes to rearrange the graph
• Use the zoom controls (bottom right) to zoom in/out
Title | Authors | Year | Actions |
---|---|---|---|
Accelerating Web-based Graph Visualization with Pixel-Based Edge Bundling
|
Jieting Wu, Jianxin Sun, Xinyan Xie, Tian Gao, Yu Pan, Hongfeng Yu
|
2023
|
View Paper |
Melody: A Platform for Linked Open Data Visualisation and Curated Storytelling
|
Giulia Renda, Marilena Daquino, V. Presutti
|
2023
|
View Paper |
GSViz: progressive visualization of geospatial influences in social networks
|
Sadeem Alsudais, Qiushi Bai, Shuang Zhao, Chen Li
|
2022
|
View Paper |
Research on Visual Analysis of Network Topology Based on Geometric Constraints
|
Zhonghua Yao, Guangliang Liu, Huihua Luo
|
2022
|
View Paper |
Adapting the LodView RDF Browser for Navigation over the Multilingual Linguistic Linked Open Data Cloud
|
A. Kirillovich, K. Nikolaev
|
2022
|
View Paper |
Resource-aware adaptive indexing for in situ visual exploration and analytics
|
Stavros Maroulis, Nikos Bikakis, George Papastefanatos, Panos Vassiliadis, Y. Vassiliou
|
2022
|
View Paper |
Effective and Efficient PageRank-based Positioning for Graph Visualization
|
Shiqi Zhang, Renchi Yang, Xiaokui Xiao, Xiao Yan, Bo Tang
|
2021
|
View Paper |
TOOL FOR INTERACTIVE VISUAL ANALYSIS OF LARGE HIERARCHICAL DATA STRUCTURES
|
Milena Frtunić Gligorijević, Miloš Bogdanović, Natasa Z. Veljkovic, Leonid Stoimenov
|
2021
|
View Paper |
Interactivity, Fairness and Explanations in Recommendations
|
G. Giannopoulos, George Papastefanatos, Dimitris Sacharidis, Kostas Stefanidis
|
2021
|
View Paper |
Tracing the footsteps of autophagy in computational biology
|
Dipanka Sarmah, N. Bairagi, S. Chatterjee
|
2020
|
View Paper |
Empirical evaluation of Linked Data visualization tools
|
F. Desimoni, Laura Po
|
2020
|
View Paper |
User Group Analytics Survey and Research Opportunities
|
Behrooz Omidvar-Tehrani, S. Amer-Yahia
|
2020
|
View Paper |
Linked Data Visualization: Techniques, Tools, and Big Data
|
Laura Po, Nikos Bikakis, F. Desimoni, George Papastefanatos
|
2020
|
View Paper |
Metamorphic data sources: A user-centric paradigm to consume linked data in interactive workspaces
|
Giuseppe Desolda, M. Matera, R. Lanzilotti
|
2020
|
View Paper |
A Conceptual Modelling Approach to Visualising Linked Data
|
P. McBrien, A. Poulovassilis
|
2019
|
View Paper |
Visualizing large knowledge graphs: A performance analysis
|
J. Gómez‐Romero, Miguel Molina-Solana, A. Oehmichen, Yike Guo
|
2018
|
View Paper |
RawVis: Visual Exploration over Raw Data
|
Nikos Bikakis, Stavros Maroulis, George Papastefanatos, Panos Vassiliadis
|
2018
|
View Paper |
Customising LOD views: a declarative approach
|
Alice Graziosi, A. Iorio, Francesco Poggi, S. Peroni, Luca Bonini
|
2018
|
View Paper |
A survey on Protein Protein Interactions (PPI) methods, databases, challenges and future directions
|
Hina Umbrin, Saba Latif
|
2018
|
View Paper |
Bipartite graphs in systems biology and medicine: a survey of methods and applications
|
Georgios A. Pavlopoulos, P. Kontou, Athanasia Pavlopoulou, Costas Bouyioukos, Evripides Markou, P. Bagos
|
2018
|
View Paper |
Big Data Visualization Tools
|
Nikos Bikakis
|
2018
|
View Paper |
La visualisation d'information à l'ère du Big Data : résoudre les problèmes de scalabilité par l'abstraction multi-échelle. (Information Visualization in the Big Data era : tackling scalability issues using multiscale abstractions)
|
Alexandre Perrot
|
2017
|
View Paper |
Accelerated layout for large-scale network based on quadtree
|
Yao Zhong-hua, Wu Lingda
|
2017
|
View Paper |
Empirical Comparison of Visualization Tools for Larger-Scale Network Analysis
|
Georgios A. Pavlopoulos, David Páez-Espino, N. Kyrpides, I. Iliopoulos
|
2017
|
View Paper |
Towards Big Data Interactive Visualization in Ambient Intelligence Environments
|
Giannis Drossis, George Margetis, C. Stephanidis
|
2016
|
View Paper |
Exploration and Visualization in the Web of Big Linked Data: A Survey of the State of the Art
|
Nikos Bikakis, T. Sellis
|
2016
|
View Paper |
A hierarchical aggregation framework for efficient multilevel visual exploration and analysis
|
Nikos Bikakis, George Papastefanatos, Melina Skourla, T. Sellis
|
2015
|
View Paper |
Graph Peeling Semantics
|
J. Abello, H. Zhang
|
2023
|
View Paper |
Stunning Doodle: A Tool for Joint Visualization and Analysis of Knowledge Graphs and Graph Embeddings
|
Antonia Ettorre, A. Bobasheva, Franck Michel, C. Faron-Zucker
|
2022
|
View Paper |
In-situ visual exploration over big raw data
|
Nikos Bikakis, Stavros Maroulis, George Papastefanatos, Panos Vassiliadis
|
2021
|
View Paper |
Adaptive Indexing for In-situ Visual Exploration and Analytics
|
Stavros Maroulis, Nikos Bikakis, George Papastefanatos, Panos Vassiliadis, Y. Vassiliou
|
2021
|
View Paper |
Semantic Web Technologies for Big Data Modeling from Analytics Perspective: A Systematic Literature Review
|
T. Georgieva-Trifonova, Miroslav Galabov
|
2021
|
View Paper |
Visually Exploring SPARQL Endpoints with Murmuration
|
C. Debruyne, D. O’Sullivan
|
2020
|
View Paper |
A Comparative Study of State-of-The-Art Linked Data Visualization Tools
|
F. Desimoni, Nikos Bikakis, Laura Po, George Papastefanatos
|
2020
|
View Paper |
Visualizing Implicit RDF Schema with the Help of Embeddings
|
M. Meimaris
|
2019
|
View Paper |
Linked Data Visualization Tools
|
C.Ramesh, K. Rao, A. Govardhan
|
2019
|
View Paper |
Community Detection Applied on Big Linked Data
|
Laura Po, Davide Malvezzi
|
2018
|
View Paper |
Customised Visualisations of Linked Open Data
|
Alice Graziosi, A. Iorio, Francesco Poggi, S. Peroni
|
2017
|
View Paper |
PGX.UI: Visual Construction and Exploration of Large Property Graphs
|
Julia Kindelsberger, Daniel Langerenken, Malte Husmann, Korbinian Schmid, Hassan Chafi
|
2017
|
View Paper |
International Journal of Web Information Systems MATVIZ : A Semantic Query and Visualization Approach for Metallic Materials Data
|
Xiaoming Zhang, Huilin Chen, Yanqin Ruan, Dongyu Pan, Chongchong Zhao
|
2017
|
View Paper |
Published: 2017-02-27
Comments (0)