GMine: A System for Scalable, Interactive Graph Visualization and Mining
Publication
Metrics
AI Quick Summary
GMine is a scalable system for interactive graph visualization and mining, addressing the challenges of large graphs through multi-resolution exploration and summarization using a novel G-Tree structure and an innovative subgraph extraction algorithm. It enables efficient navigation and reduces sensory overload by partitioning and visualizing hierarchical communities.
Paper Preview
Abstract
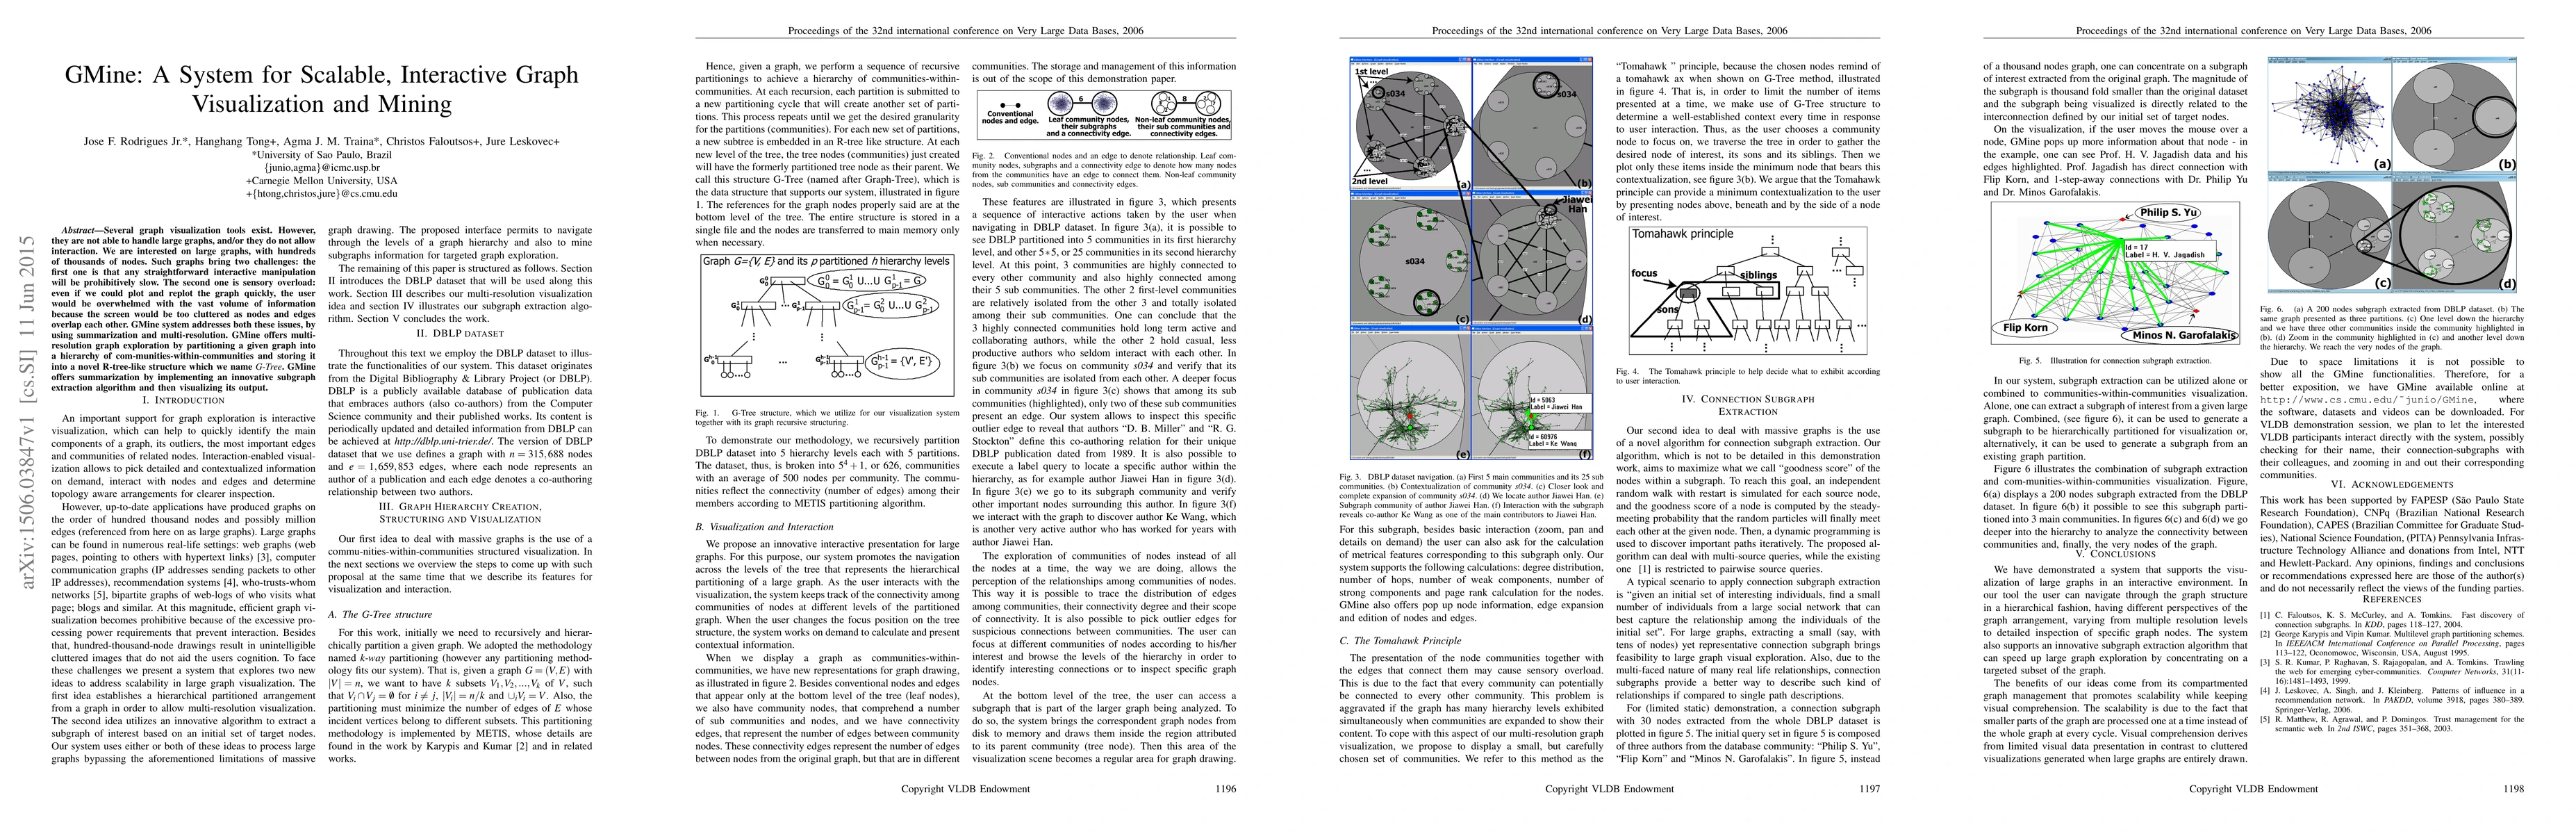
Several graph visualization tools exist. However, they are not able to handle large graphs, and/or they do not allow interaction. We are interested on large graphs, with hundreds of thousands of nodes. Such graphs bring two challenges: the first one is that any straightforward interactive manipulation will be prohibitively slow. The second one is sensory overload: even if we could plot and replot the graph quickly, the user would be overwhelmed with the vast volume of information because the screen would be too cluttered as nodes and edges overlap each other. GMine system addresses both these issues, by using summarization and multi-resolution. GMine offers multi-resolution graph exploration by partitioning a given graph into a hierarchy of com-munities-within-communities and storing it into a novel R-tree-like structure which we name G-Tree. GMine offers summarization by implementing an innovative subgraph extraction algorithm and then visualizing its output.
AI Key Findings
Get AI-generated insights about this paper's methodology, results, significance, and more — seven facets brought into focus.
Impact
Paper Details
PDF Preview
Key Terms
Citation Network
Current paper (gray), citations (green), references (blue)
Display is limited for performance on very large graphs.
Discussion 0