This paper proposes a taxonomy of visualization recommendation categories and evaluates their utility through a system called Frontier. Findings suggest that recommendations enhancing current visualizations and filtering to sub-populations are most useful, guiding the development of adaptive and personalized next-generation VisRec systems.
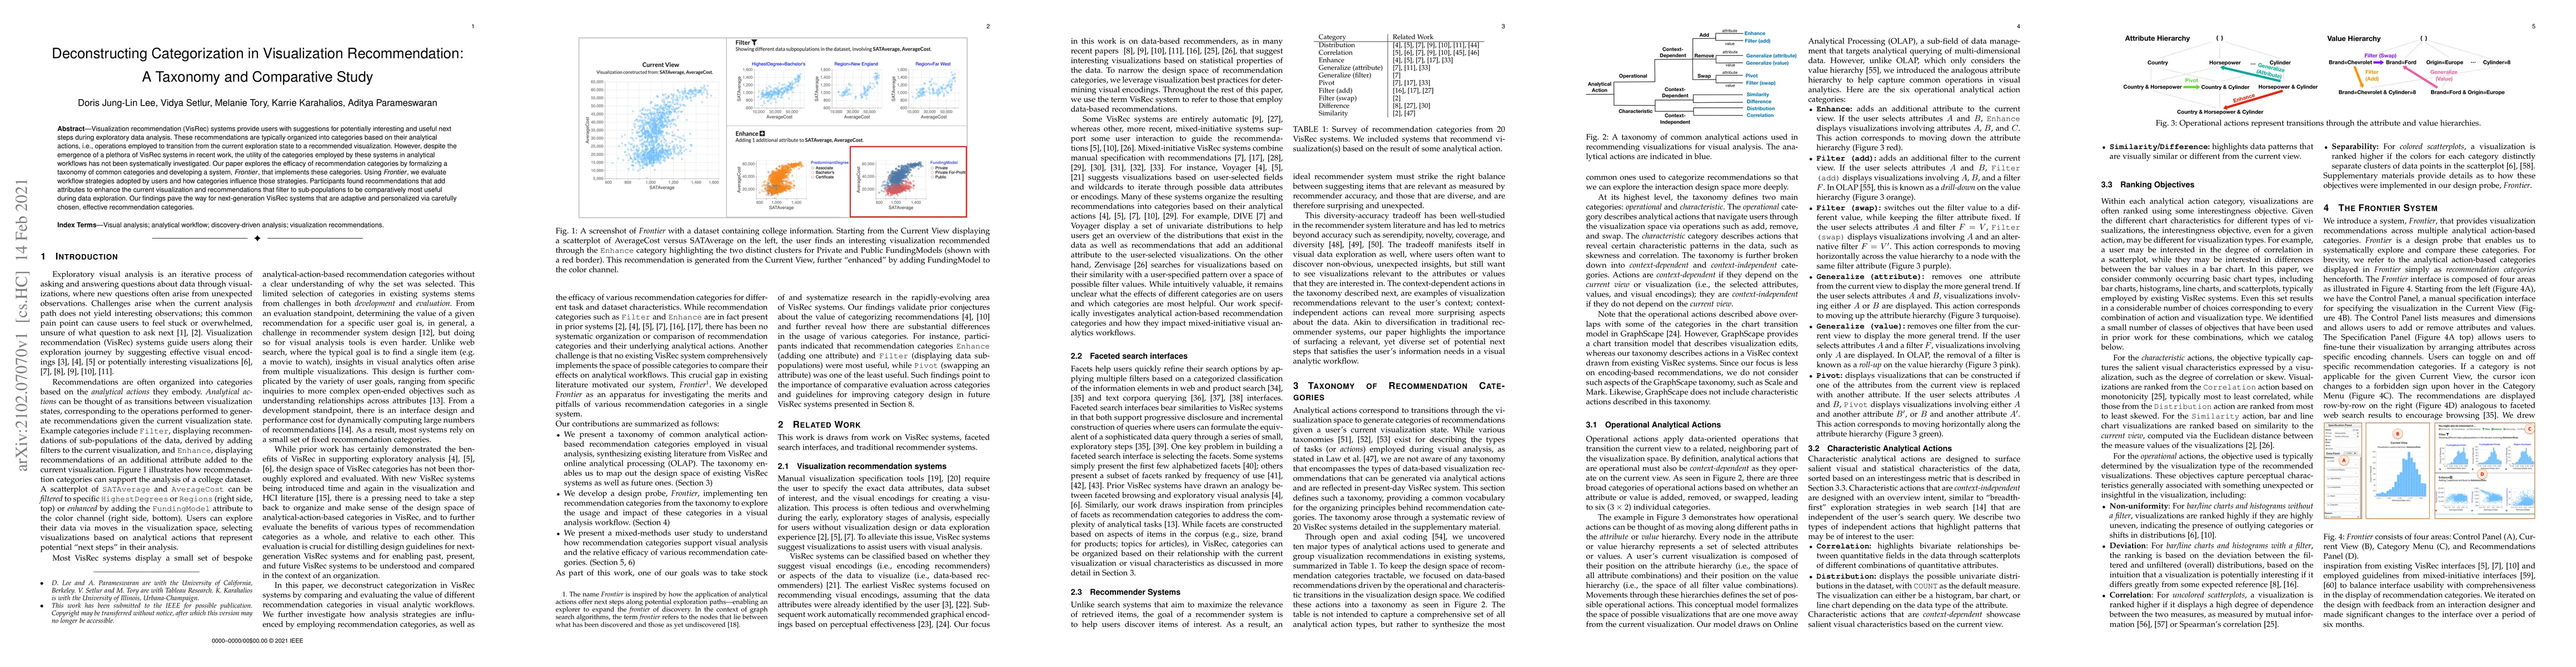
Visualization recommendation (VisRec) systems provide users with suggestions for potentially interesting and useful next steps during exploratory data analysis. These recommendations are typically organized into categories based on their analytical actions, i.e., operations employed to transition from the current exploration state to a recommended visualization. However, despite the emergence of a plethora of VisRec systems in recent work, the utility of the categories employed by these systems in analytical workflows has not been systematically investigated. Our paper explores the efficacy of recommendation categories by formalizing a taxonomy of common categories and developing a system, Frontier, that implements these categories. Using Frontier, we evaluate workflow strategies adopted by users and how categories influence those strategies. Participants found recommendations that add attributes to enhance the current visualization and recommendations that filter to sub-populations to be comparatively most useful during data exploration. Our findings pave the way for next-generation VisRec systems that are adaptive and personalized via carefully chosen, effective recommendation categories.
This graph shows how this paper is connected to other research. The current paper is shown in dark gray, papers that cite it are in green, and papers it references are in blue. You can:
• Hover over any node to see the paper title
• Click a node to view that paper's details
• Drag nodes to rearrange the graph
• Use the zoom controls (bottom right) to zoom in/out
Title | Authors | Year | Actions |
---|---|---|---|
RSVP for VPSA : A Meta Design Study on Rapid Suggestive Visualization Prototyping for Visual Parameter Space Analysis
|
Manfred Klaffenboeck, Michael Gleicher, Johannes Sorger, Michael Wimmer, Torsten Moeller
|
2024
|
View Paper |
TaskFinder: A Semantics-Based Methodology for Visualization Task Recommendation
|
Darius Coelho, Bhavya Ghai, Arjun Krishna, Maria C. Velez-Rojas, Steve Greenspan, Serge Mankovski, Klaus Mueller
|
2024
|
View Paper |
RemixTape: Enriching Narratives about Metrics with Semantic Alignment and Contextual Recommendation
|
Matthew Brehmer, Margaret Drouhard, Arjun Srinivasan
|
2024
|
View Paper |
Guided By AI: Navigating Trust, Bias, and Data Exploration in AI‐Guided Visual Analytics
|
Sunwoo Ha, S. Monadjemi, Alvitta Ottley
|
2024
|
View Paper |
Data Formulator: AI-Powered Concept-Driven Visualization Authoring
|
Chenglong Wang, John Thompson, Bongshin Lee
|
2023
|
View Paper |
Heuristics for Supporting Cooperative Dashboard Design
|
V. Setlur, M. Correll, Arvind Satyanarayan, Melanie Tory
|
2023
|
View Paper |
Tracing and Visualizing Human-ML/AI Collaborative Processes through Artifacts of Data Work
|
Jennifer Rogers, Anamaria Crisan
|
2023
|
View Paper |
M: Intent-based Recommendations to Support Dashboard Composition
|
Aditeya Pandey, Arjun Srinivasan, V. Setlur
|
2022
|
View Paper |
Snowy: Recommending Utterances for Conversational Visual Analysis
|
Arjun Srinivasan, V. Setlur
|
2021
|
View Paper |
Discovering Technology Gaps using the IntSight Knowledge Navigator
|
Aurpon Gupta, S. Dasgupta, Snehasis Sinha, Amarnath Gupta
|
2021
|
View Paper |
Towards Natural Language Interfaces for Data Visualization: A Survey
|
Leixian Shen, Enya Shen, Yuyu Luo, Xiaocong Yang, Xuming Hu, Xiongshuai Zhang, Zhiwei Tai, Jianmin Wang
|
2021
|
View Paper |
Visual Arrangements of Bar Charts Influence Comparisons in Viewer Takeaways
|
Cindy Xiong, V. Setlur, Benjamin Bach, Kylie Lin, Eunyee Koh, S. Franconeri
|
2021
|
View Paper |
Lux: Always-on Visualization Recommendations for Exploratory Dataframe Workflows
|
D. Lee, Dixin Tang, Kunal Agarwal, Thyne Boonmark, Caitlyn Chen, J. Kang, U. Mukhopadhyay, Jerry Song, Micah Yong, Marti A. Hearst, Aditya G. Parameswaran
|
2021
|
View Paper |
A Systematic Review of Visualization Recommendation Systems: Goals, Strategies, Interfaces, and Evaluations
|
Zehua Zeng, Leilani Battle
|
2024
|
View Paper |
Towards Observability for Machine Learning Pipelines
|
Shreya Shankar, Aditya G. Parameswaran
|
2022
|
View Paper |
Ditto: Exploring data in large display environments through speech+mid-air gesture interactions
|
Jillian Aurisano, Abhinav Kumar, B. Di, Eugênio, Andrew E. Johnson, J. Leigh, Moira L. Zellner
|
2022
|
View Paper |
Lux: Always-on Visualization Recommendations for Exploratory Data Science
|
D. Lee, Dixin Tang, Kunal Agarwal, Thyne Boonmark, Caitlyn Chen, J. Kang, U. Mukhopadhyay, Jerry Song, Micah Yong, Marti A. Hearst, Aditya G. Parameswaran
|
2021
|
View Paper |
Interface Design and Task Difficulty Impact ML-Assisted Visual Data Foraging
|
S. Monadjemi, Sunwoo Ha, Quan Nguyen, Henry Chai, R. Garnett, Alvitta Ottley
|
2021
|
View Paper |
Intelligent Data Visualization Analysis Techniques: A Survey
|
Yu-Yu Luo, Xue-Di Qin, Yu-Peng Xie, Guo-Liang Li
|
View Paper |
Leilani Battle, Zehua Zeng
Published: 2023-02-13
Comments (0)