Academic Profile
Statistics
Similar Authors
Papers on arXiv

Exploratory visual data analysis tools empower data analysts to efficiently and intuitively explore data insights throughout the entire analysis cycle. However, the gap between common programmatic a...
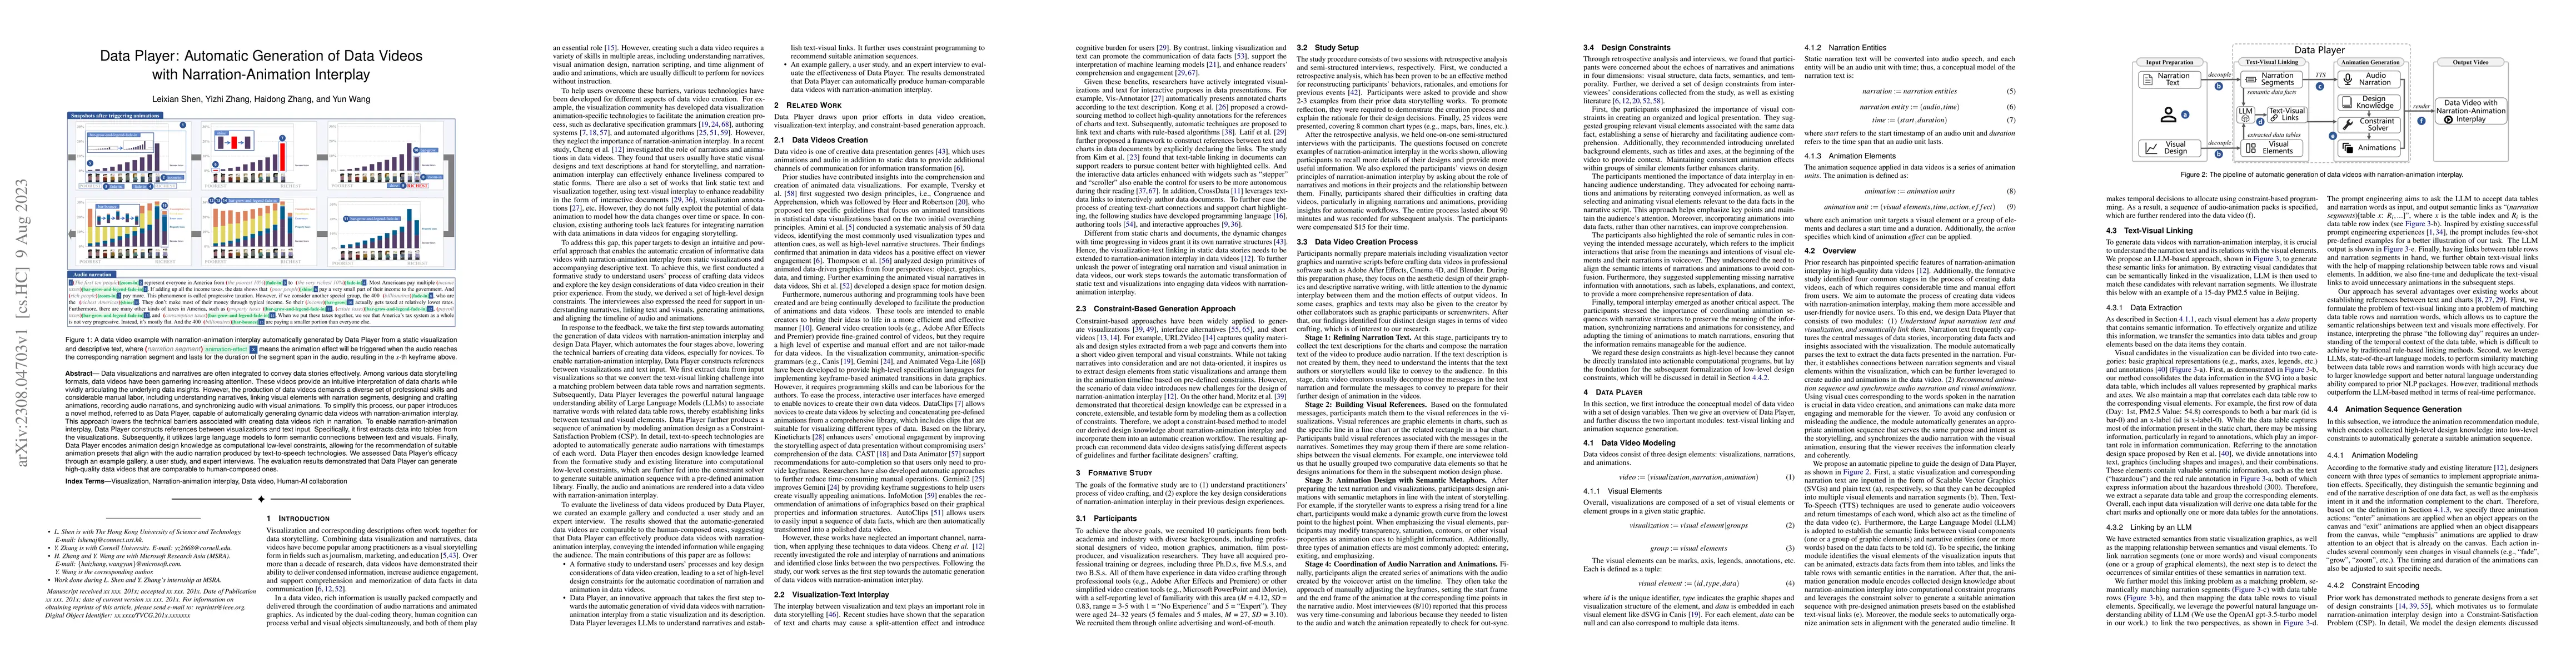
Data visualizations and narratives are often integrated to convey data stories effectively. Among various data storytelling formats, data videos have been garnering increasing attention. These video...
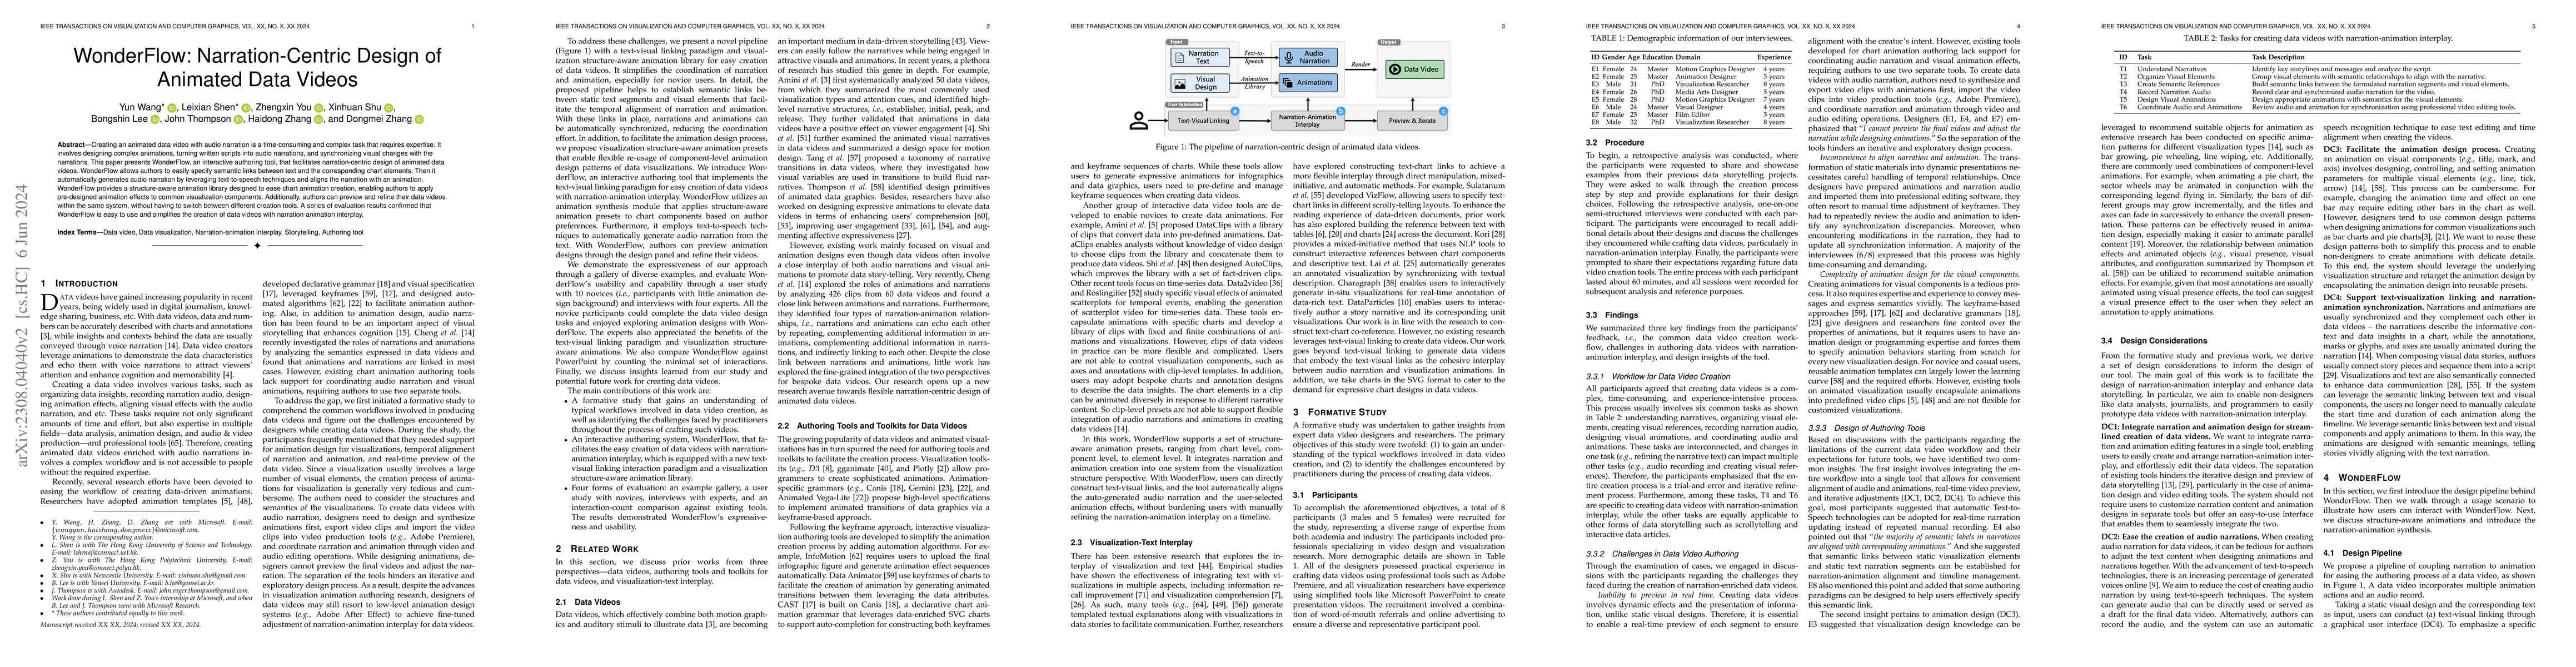
Creating an animated data video enriched with audio narration takes a significant amount of time and effort and requires expertise. Users not only need to design complex animations, but also turn wr...
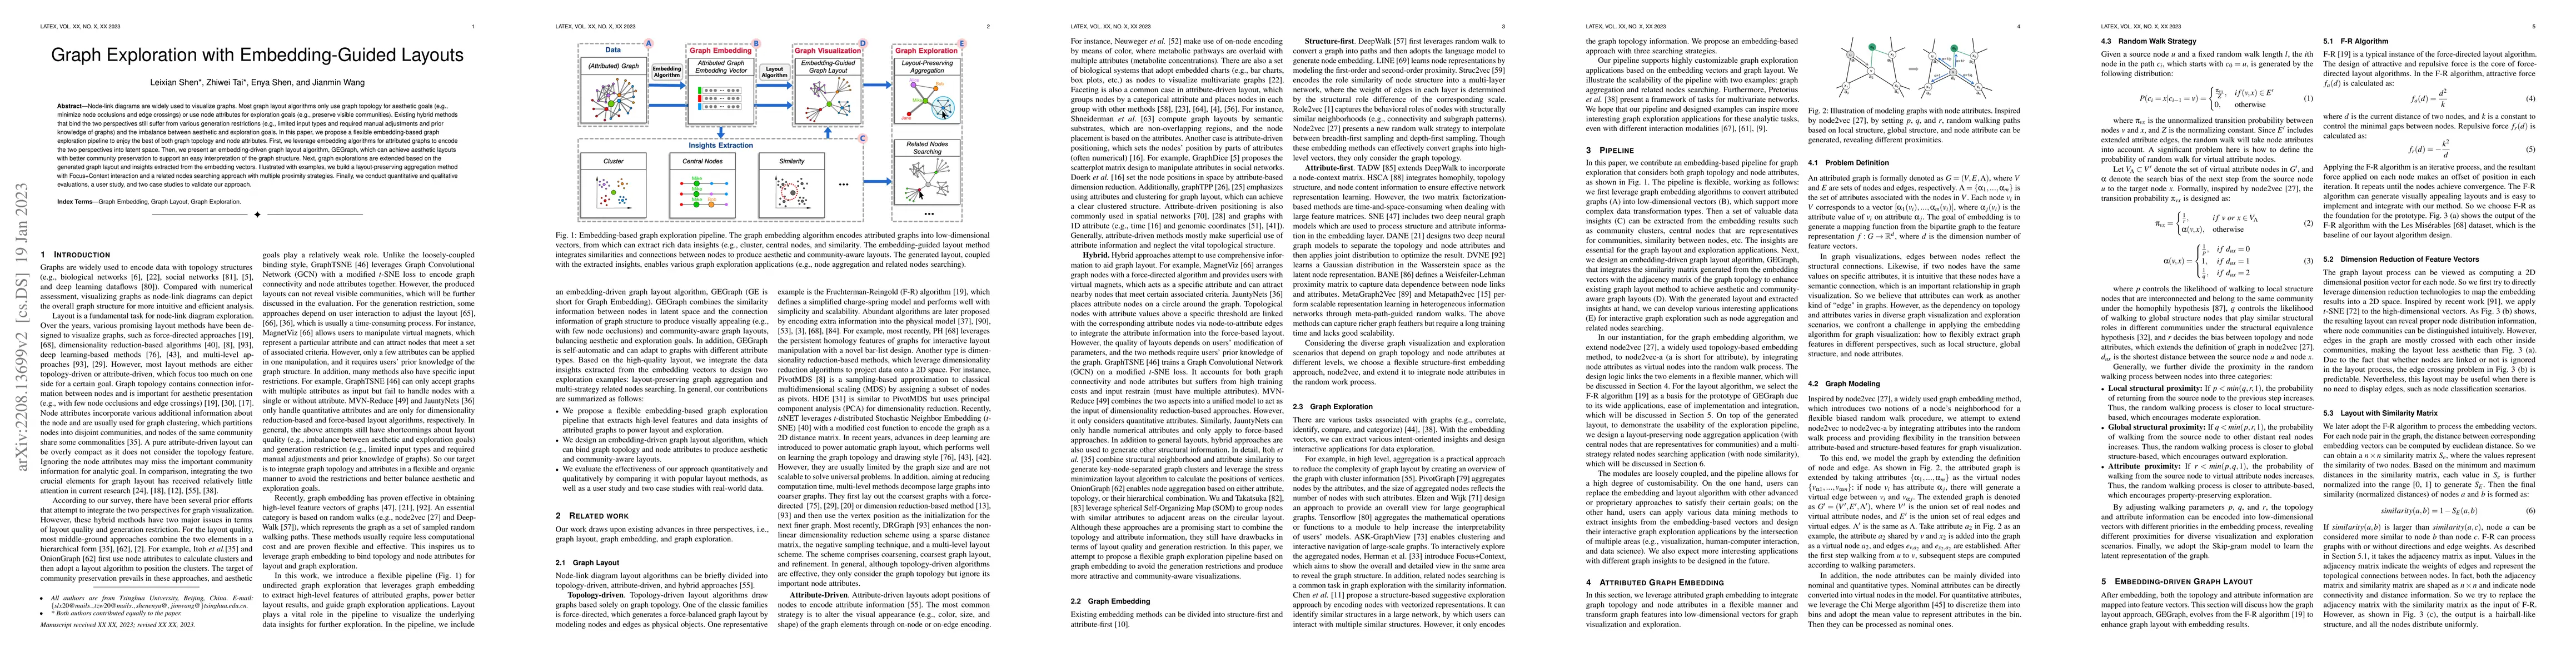
Node-link diagrams are widely used to visualize graphs. Most graph layout algorithms only use graph topology for aesthetic goals (e.g., minimize node occlusions and edge crossings) or use node attri...
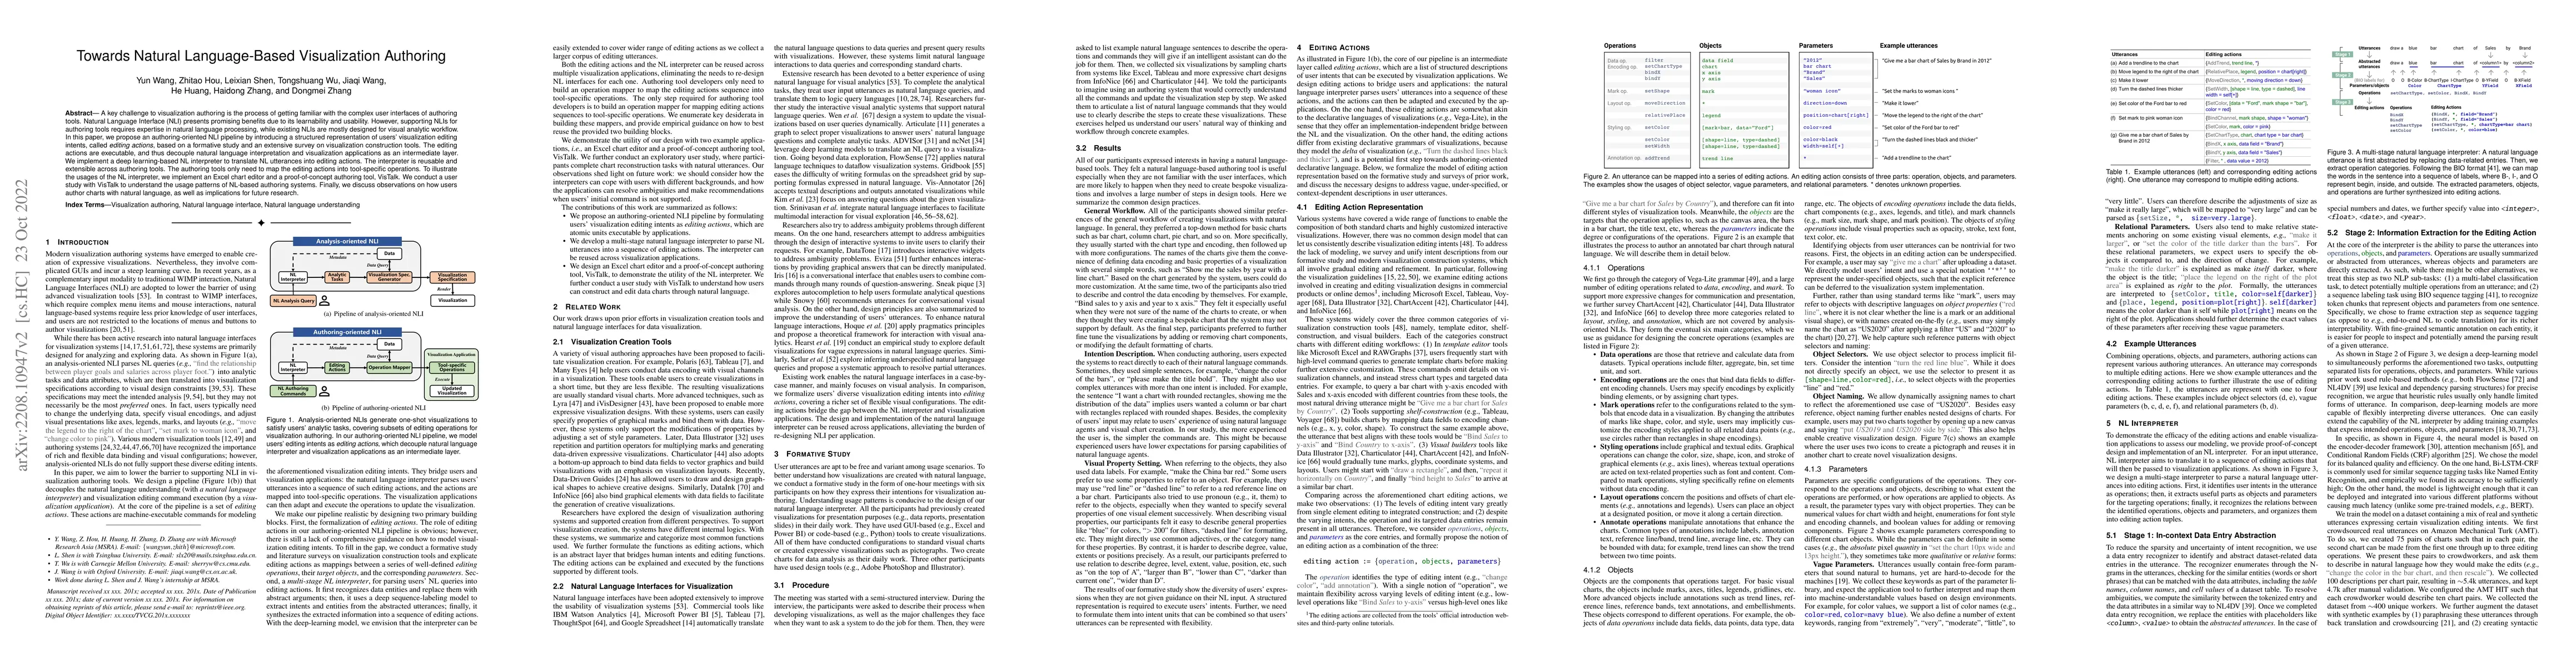
A key challenge to visualization authoring is the process of getting familiar with the complex user interfaces of authoring tools. Natural Language Interface (NLI) presents promising benefits due to...
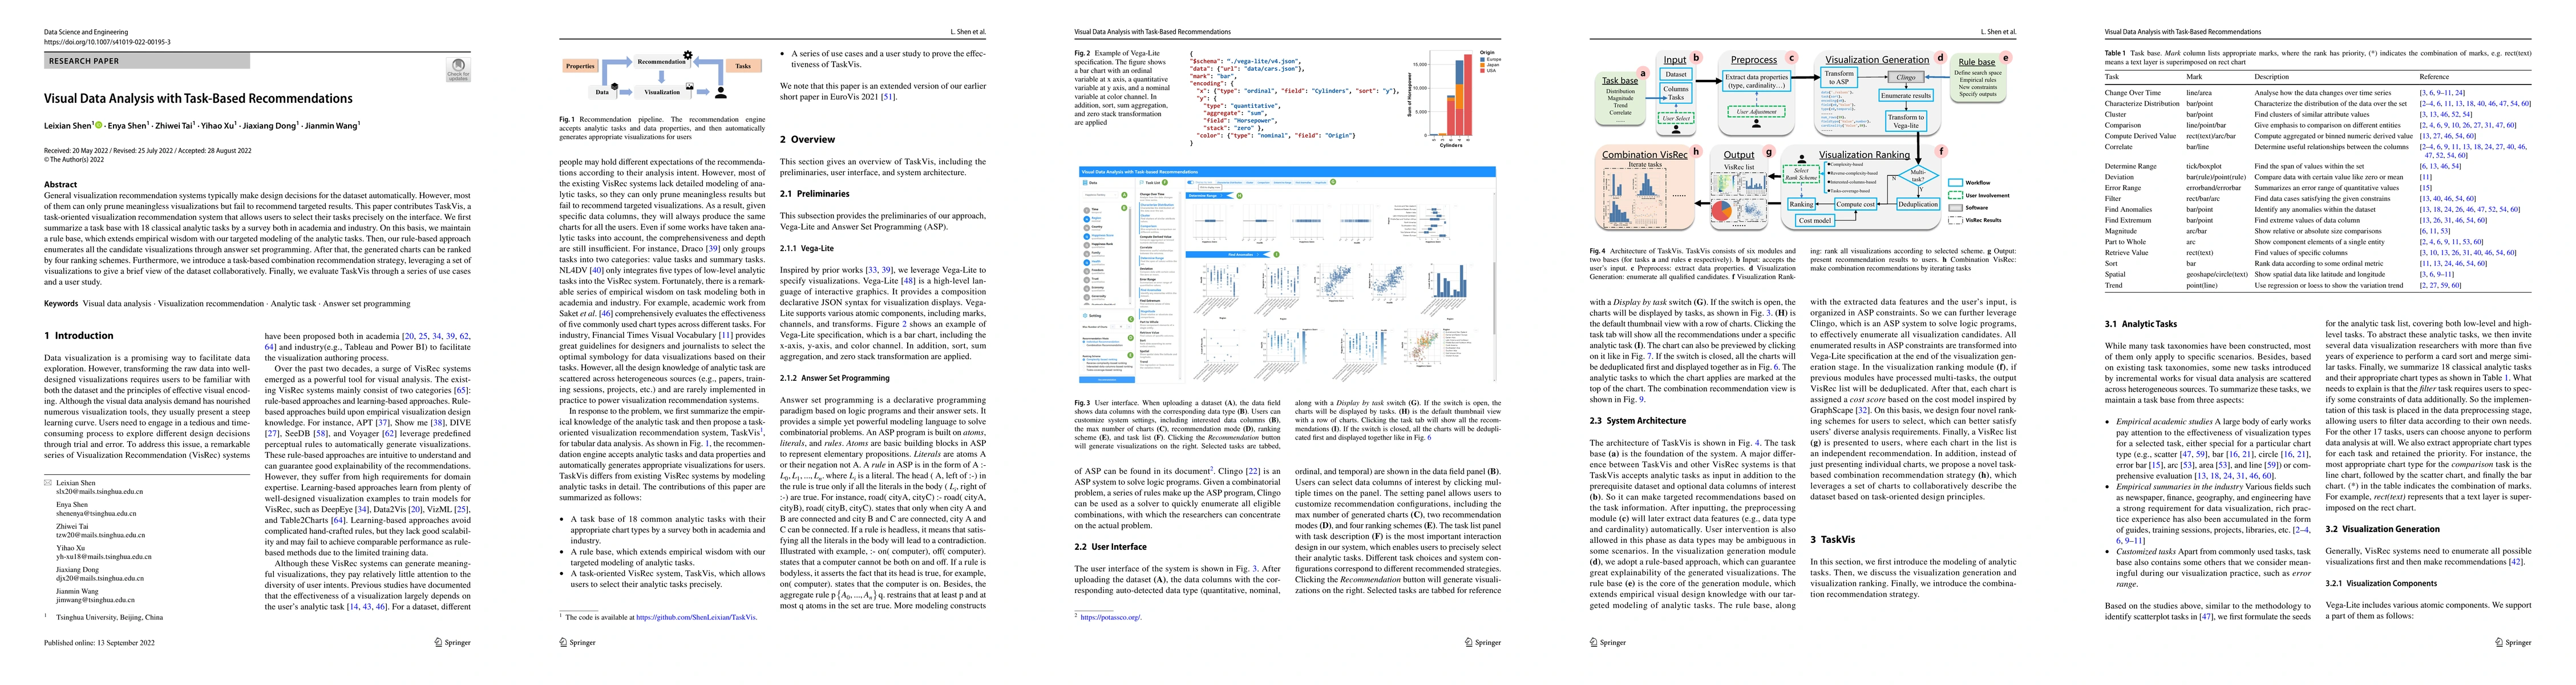
General visualization recommendation systems typically make design decisions for the dataset automatically. However, most of them can only prune meaningless visualizations but fail to recommend targ...
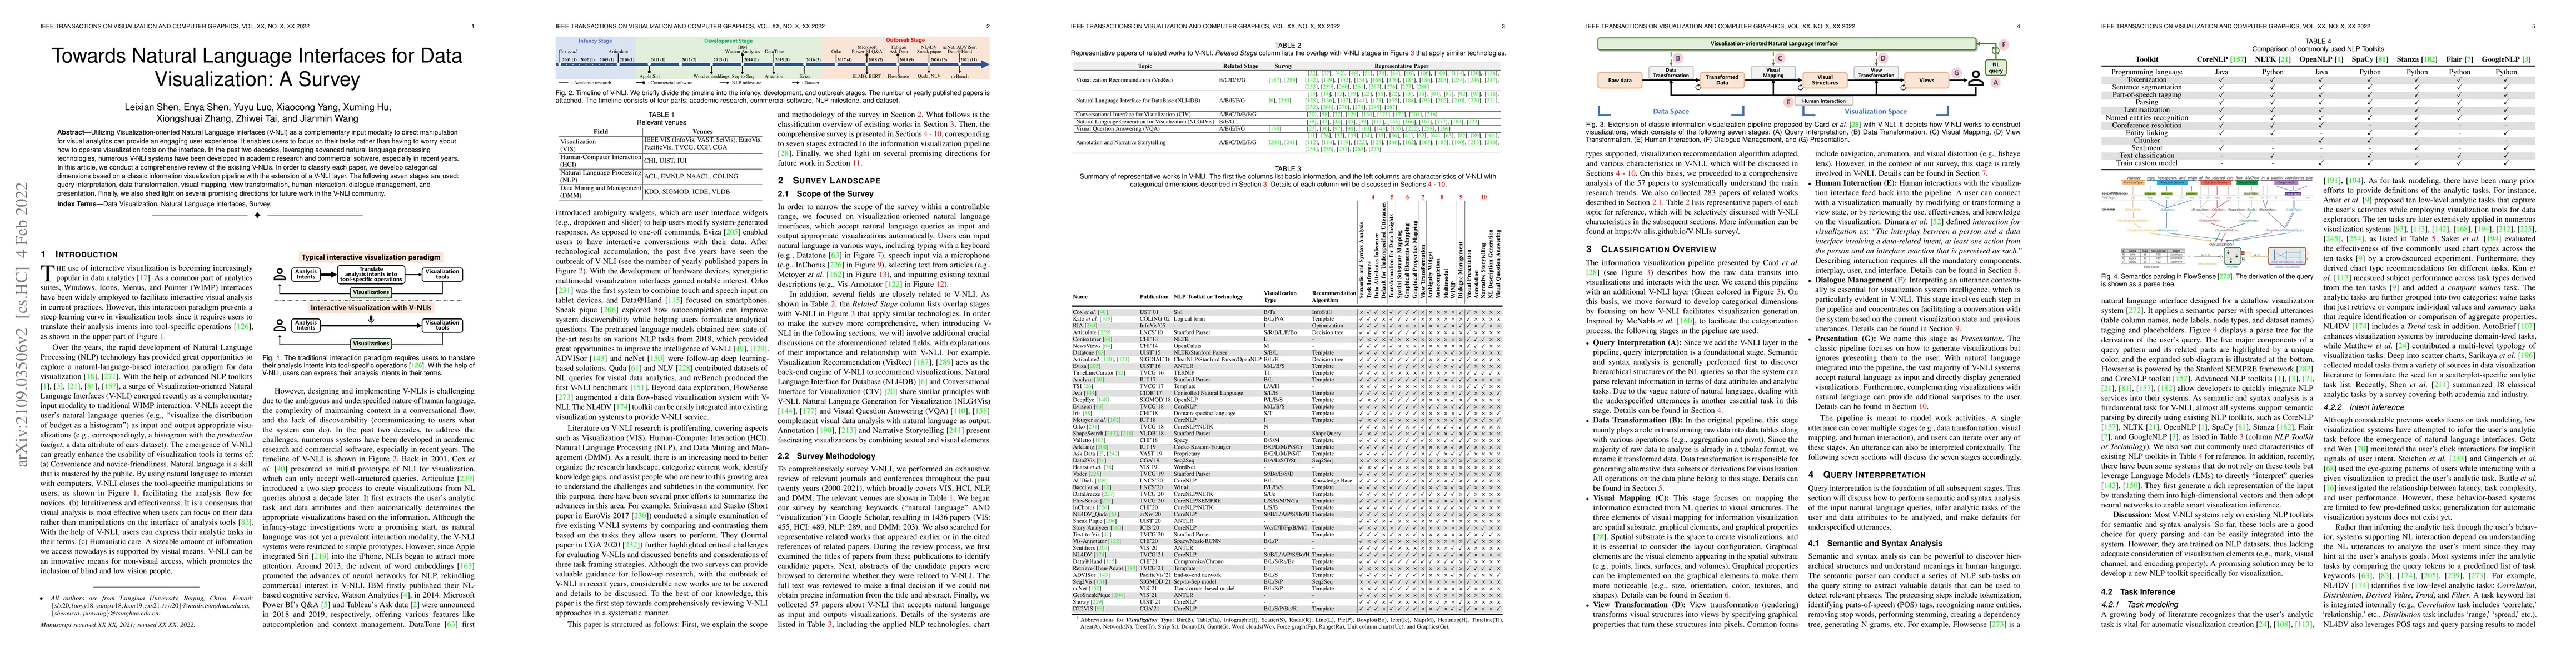
Utilizing Visualization-oriented Natural Language Interfaces (V-NLI) as a complementary input modality to direct manipulation for visual analytics can provide an engaging user experience. It enables...
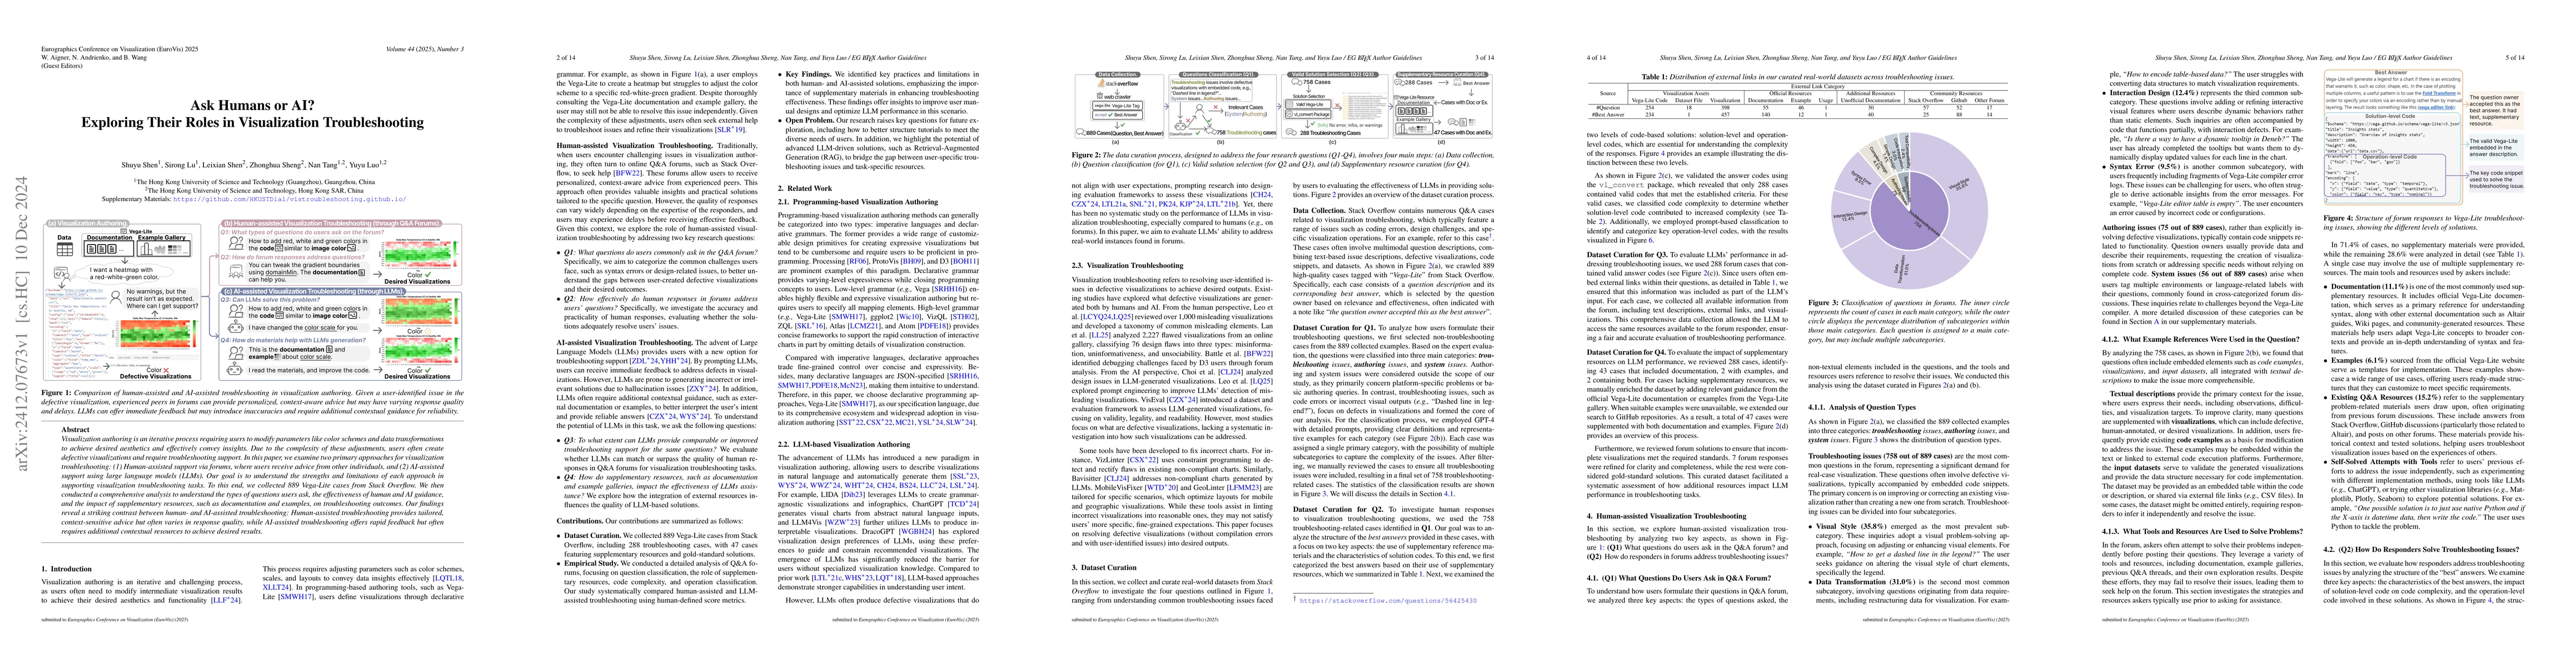
Visualization authoring is an iterative process requiring users to modify parameters like color schemes and data transformations to achieve desired aesthetics and effectively convey insights. Due to t...
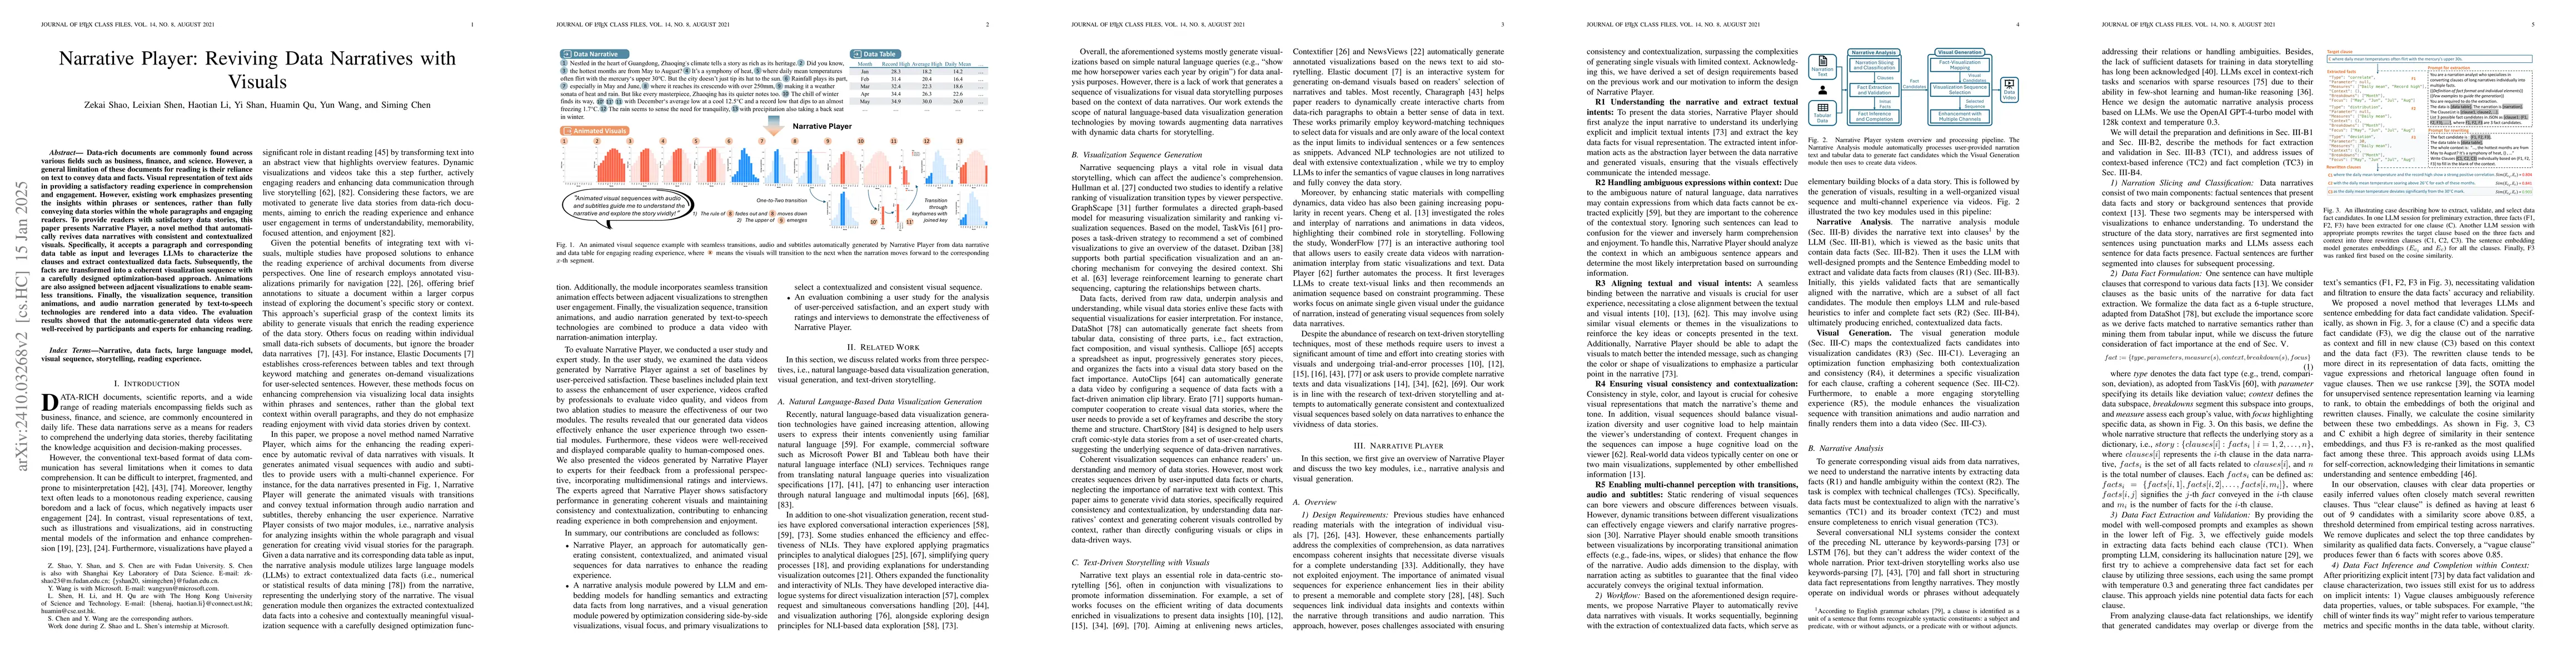
Data-rich documents are commonly found across various fields such as business, finance, and science. However, a general limitation of these documents for reading is their reliance on text to convey da...
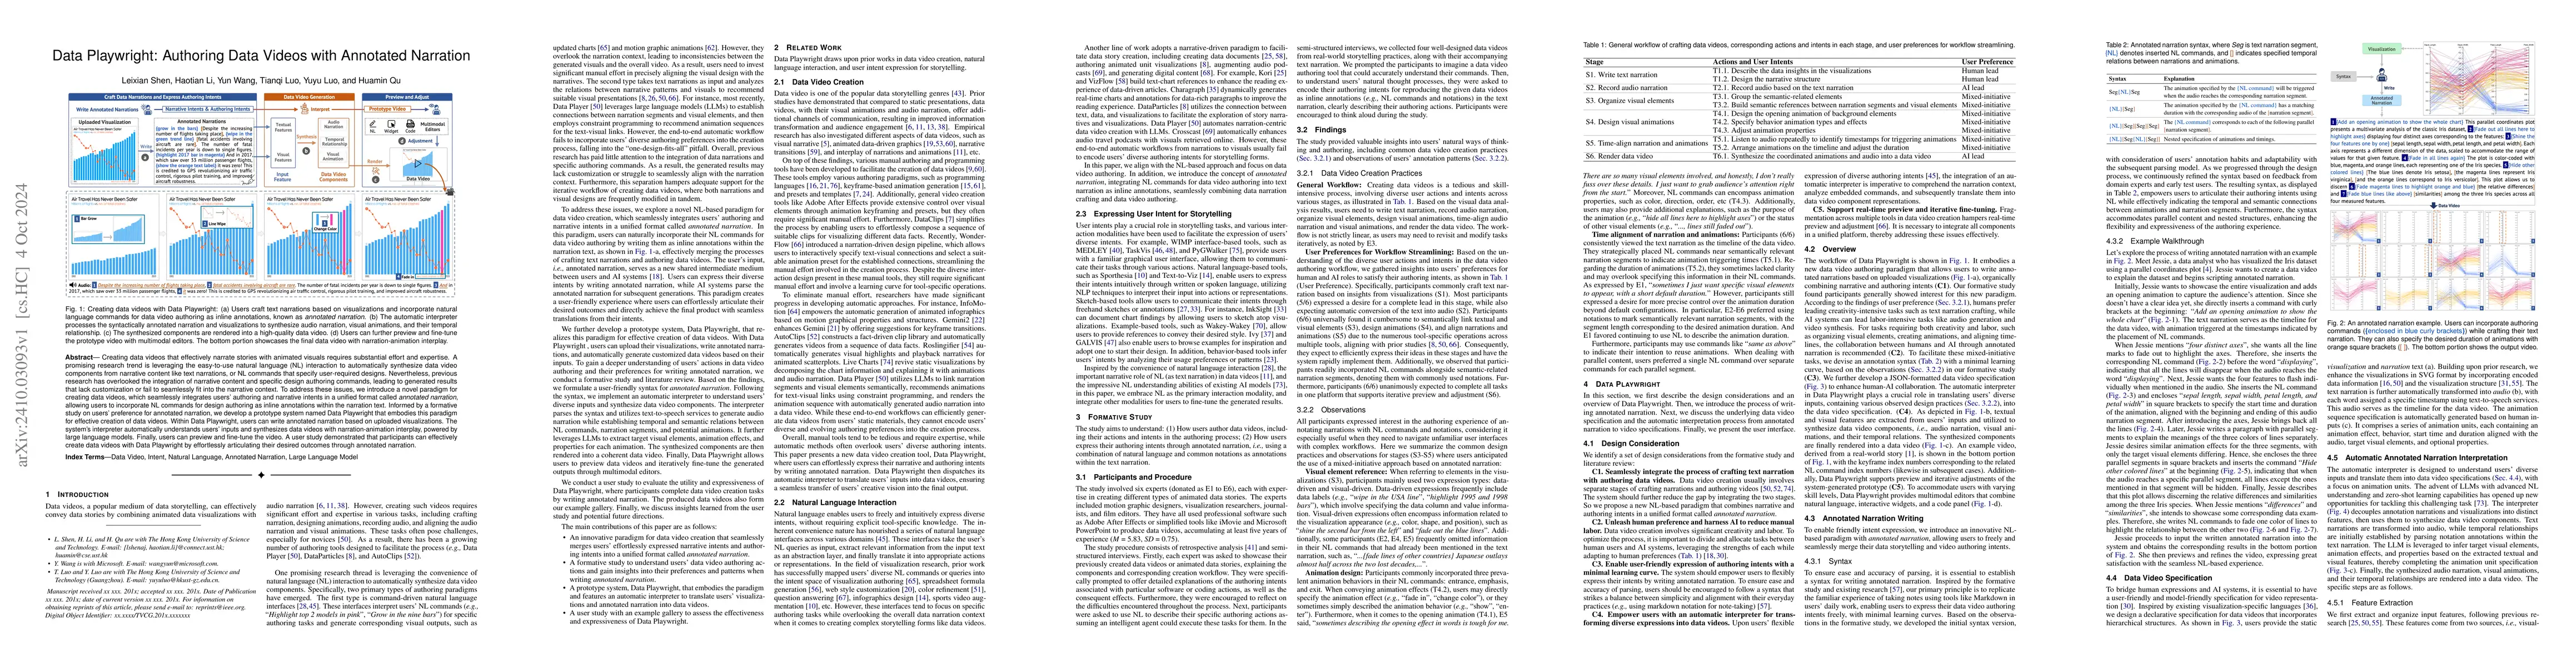
Creating data videos that effectively narrate stories with animated visuals requires substantial effort and expertise. A promising research trend is leveraging the easy-to-use natural language (NL) in...
Creating data stories from raw data is challenging due to humans' limited attention spans and the need for specialized skills. Recent advancements in large language models (LLMs) offer great opportuni...
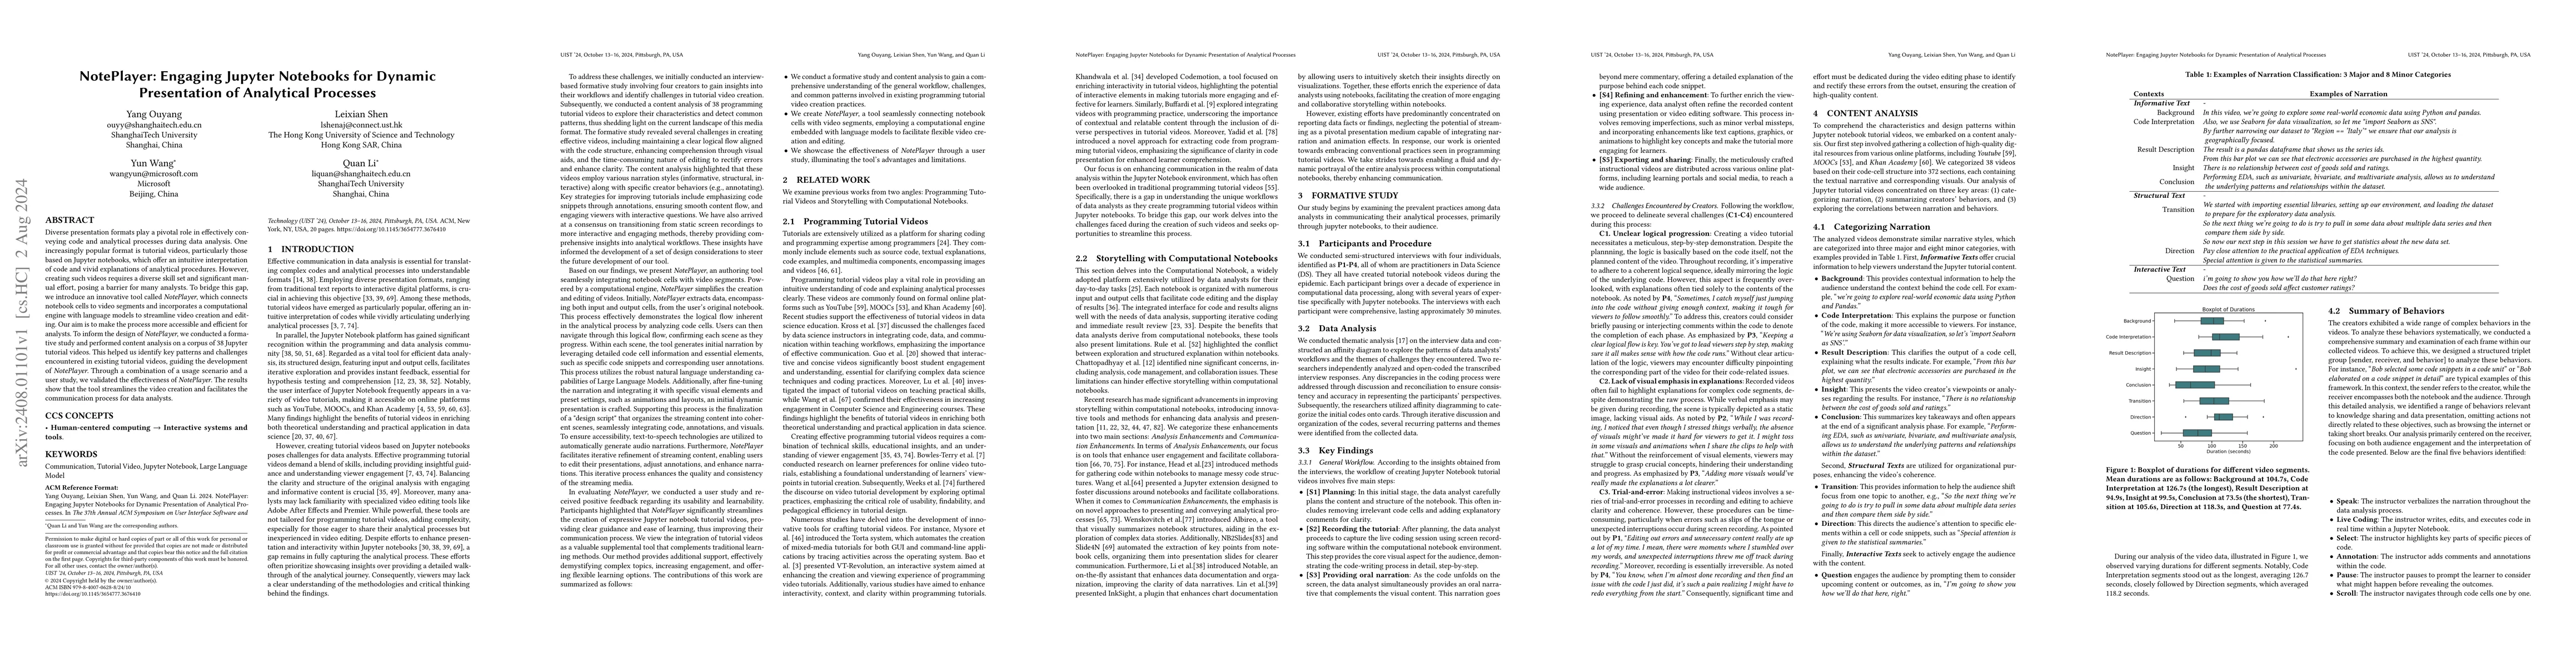
Diverse presentation formats play a pivotal role in effectively conveying code and analytical processes during data analysis. One increasingly popular format is tutorial videos, particularly those bas...
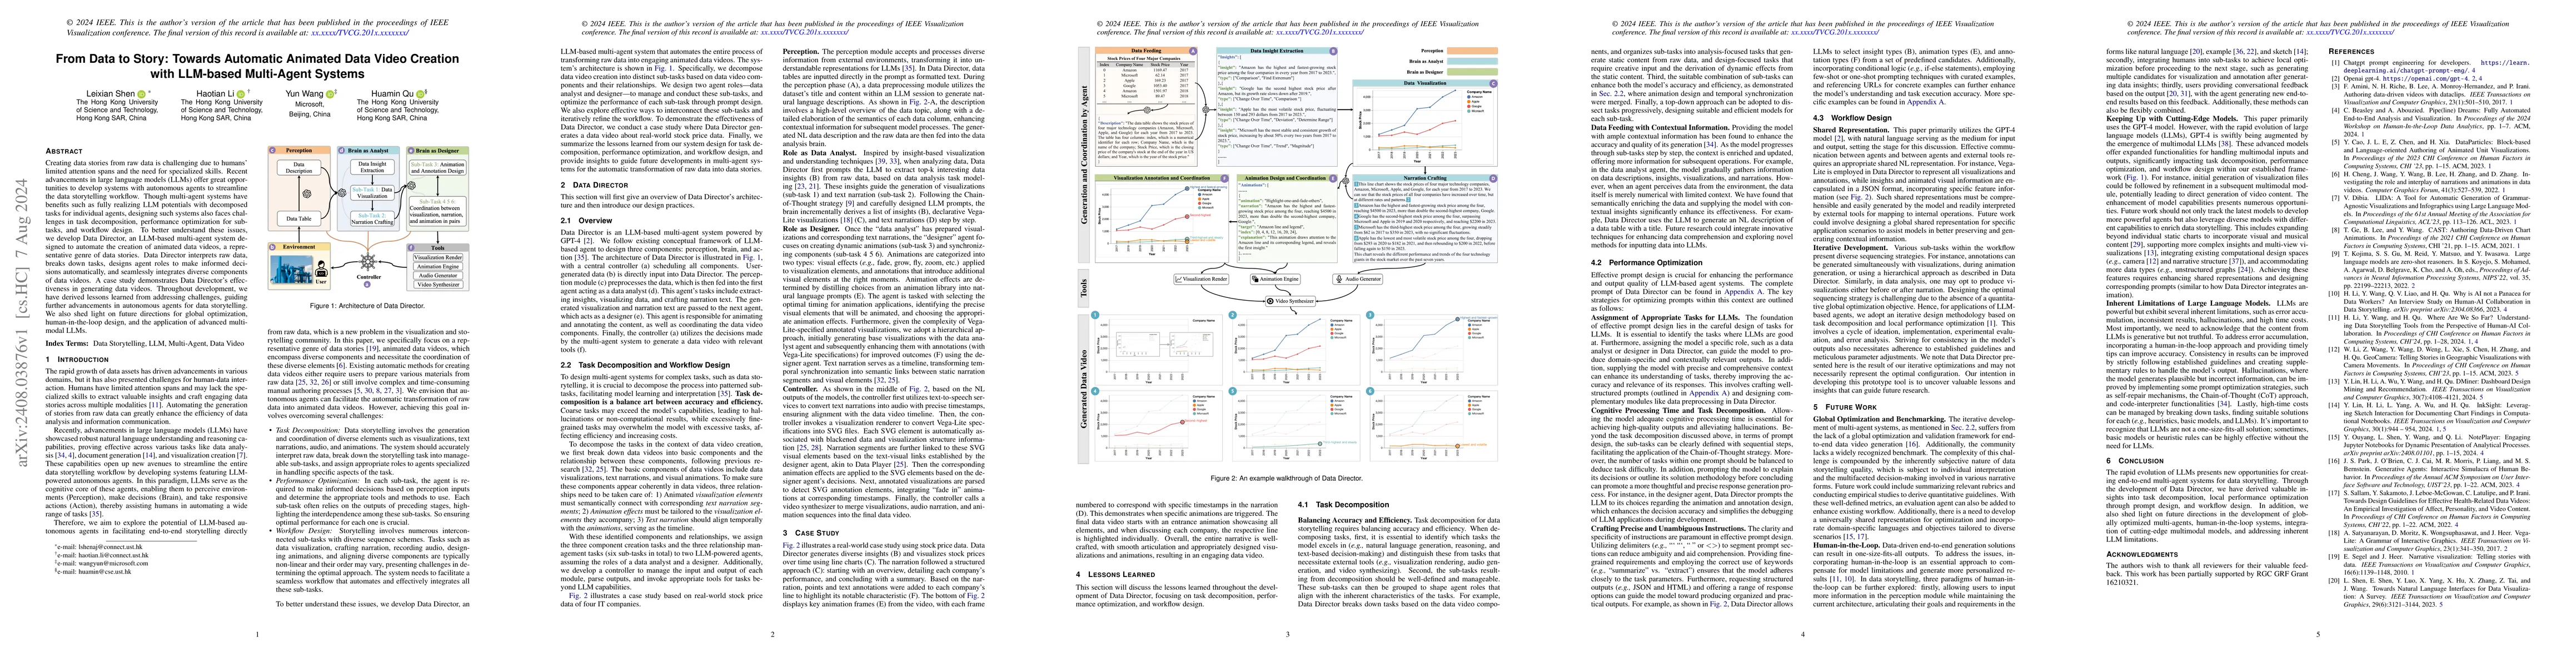
To facilitate the creation of compelling and engaging data stories, AI-powered tools have been introduced to automate the three stages in the workflow: analyzing data, organizing findings, and creatin...
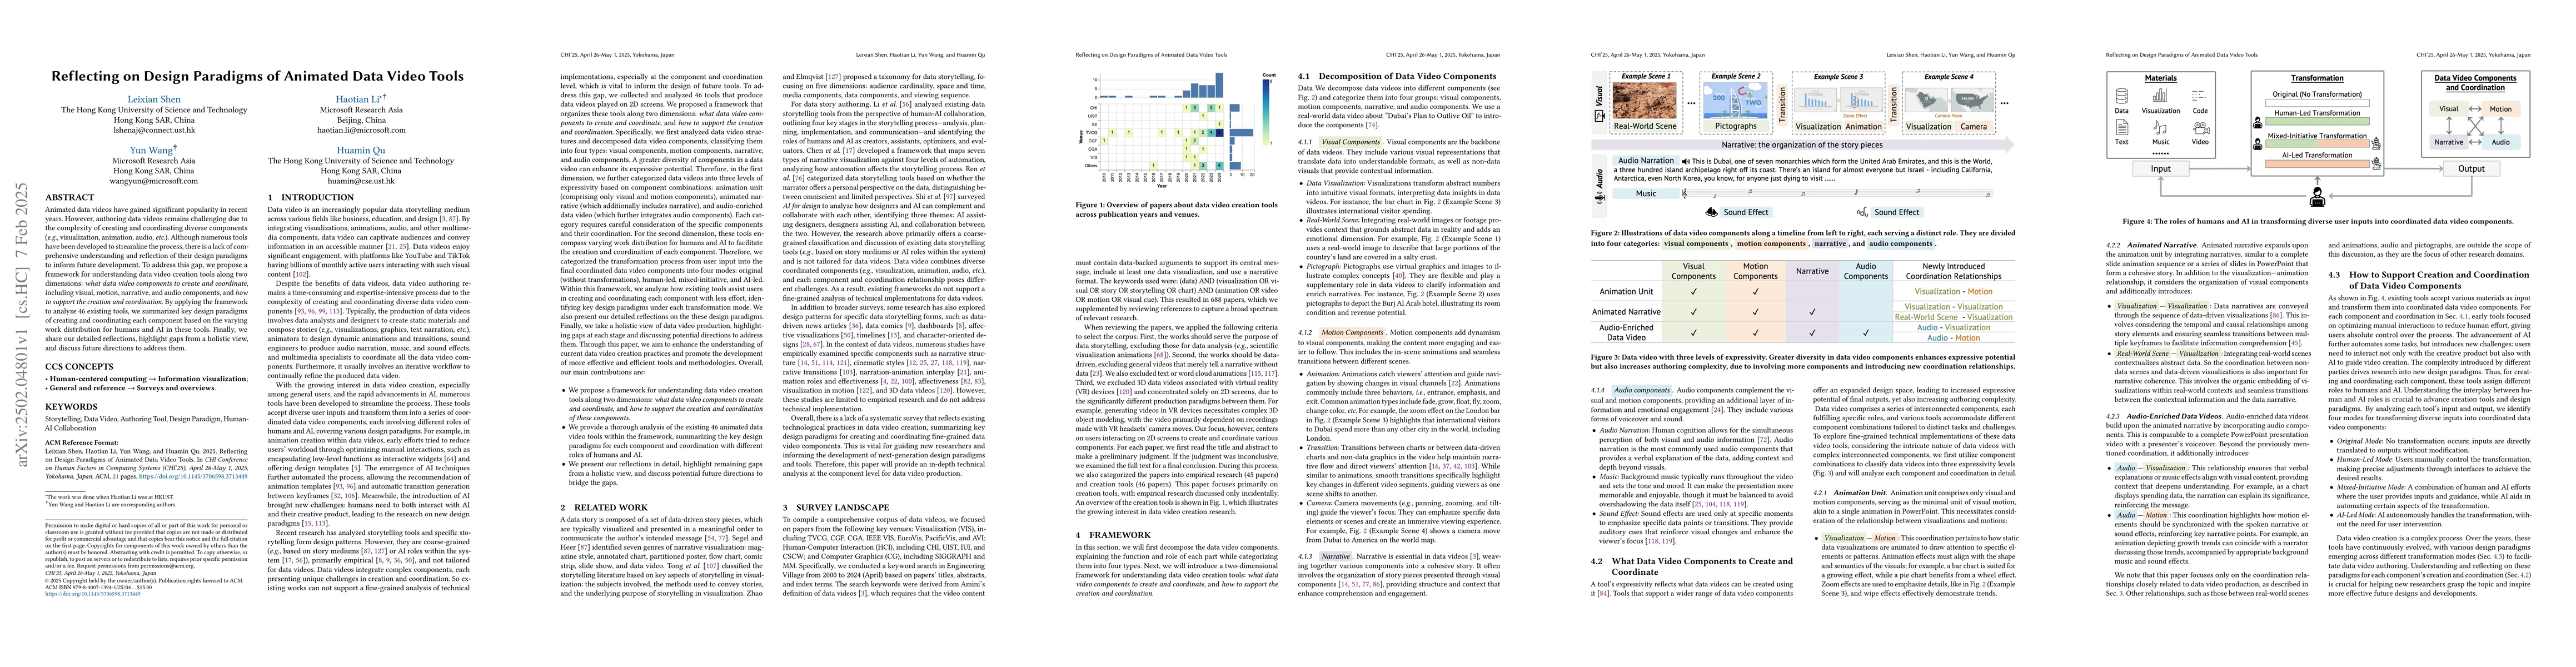
Animated data videos have gained significant popularity in recent years. However, authoring data videos remains challenging due to the complexity of creating and coordinating diverse components (e.g.,...
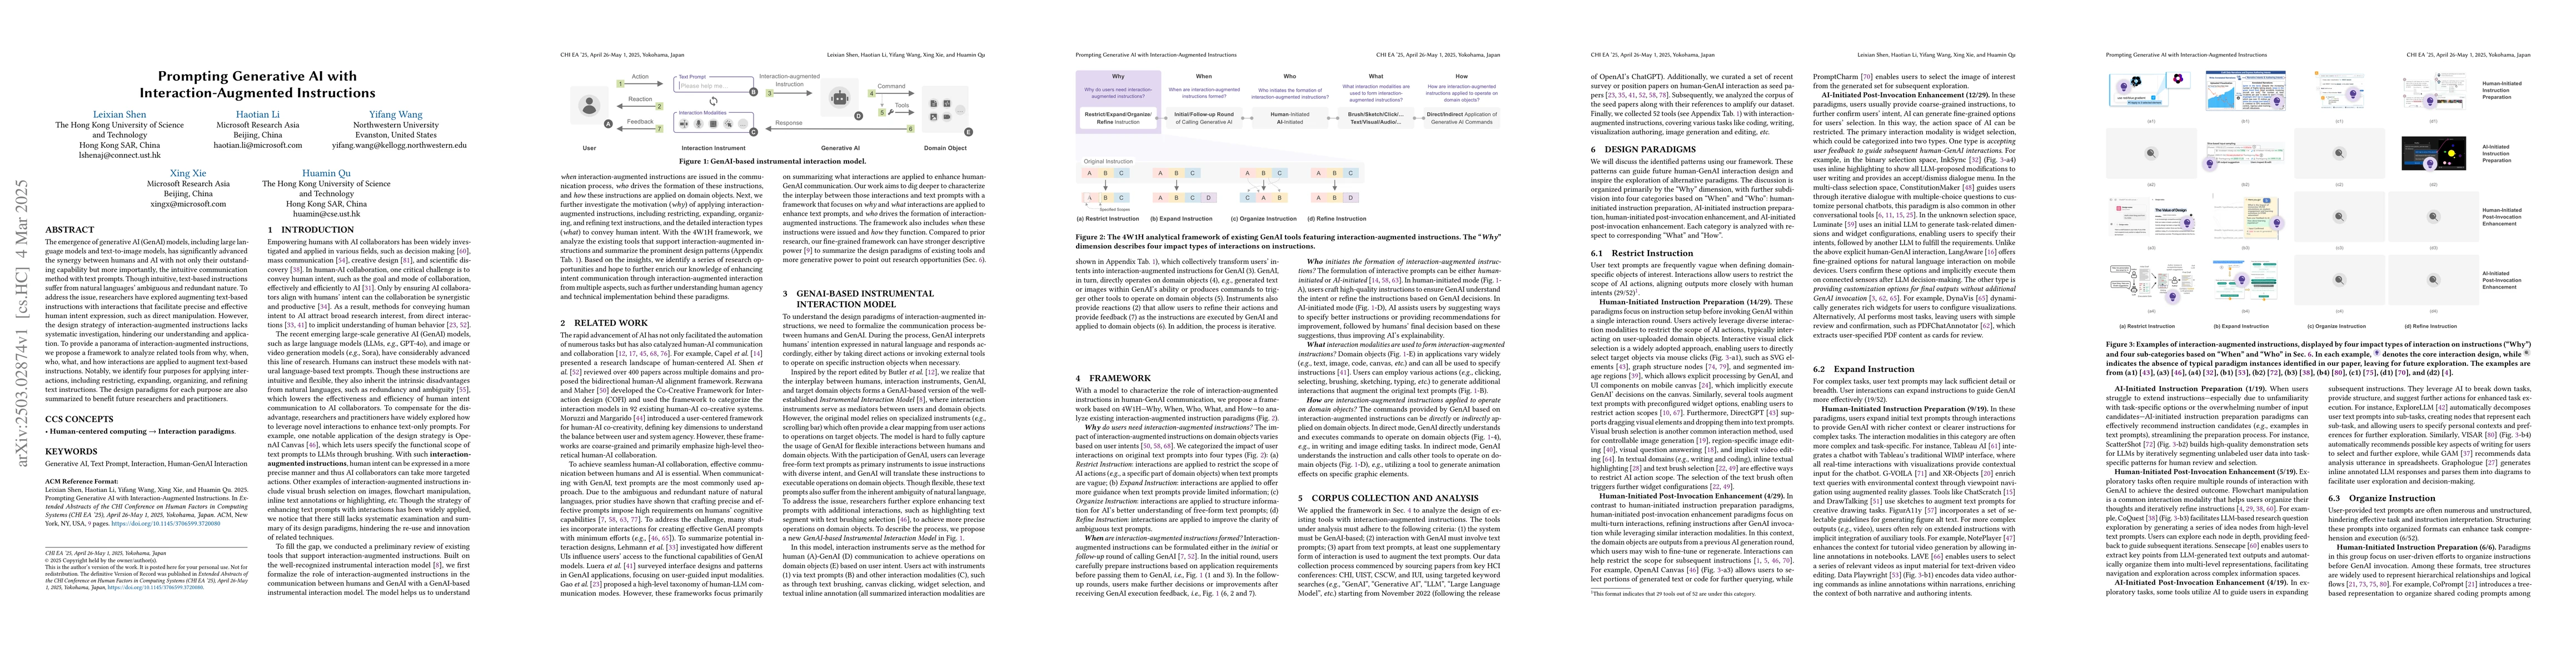
The emergence of generative AI (GenAI) models, including large language models and text-to-image models, has significantly advanced the synergy between humans and AI with not only their outstanding ca...
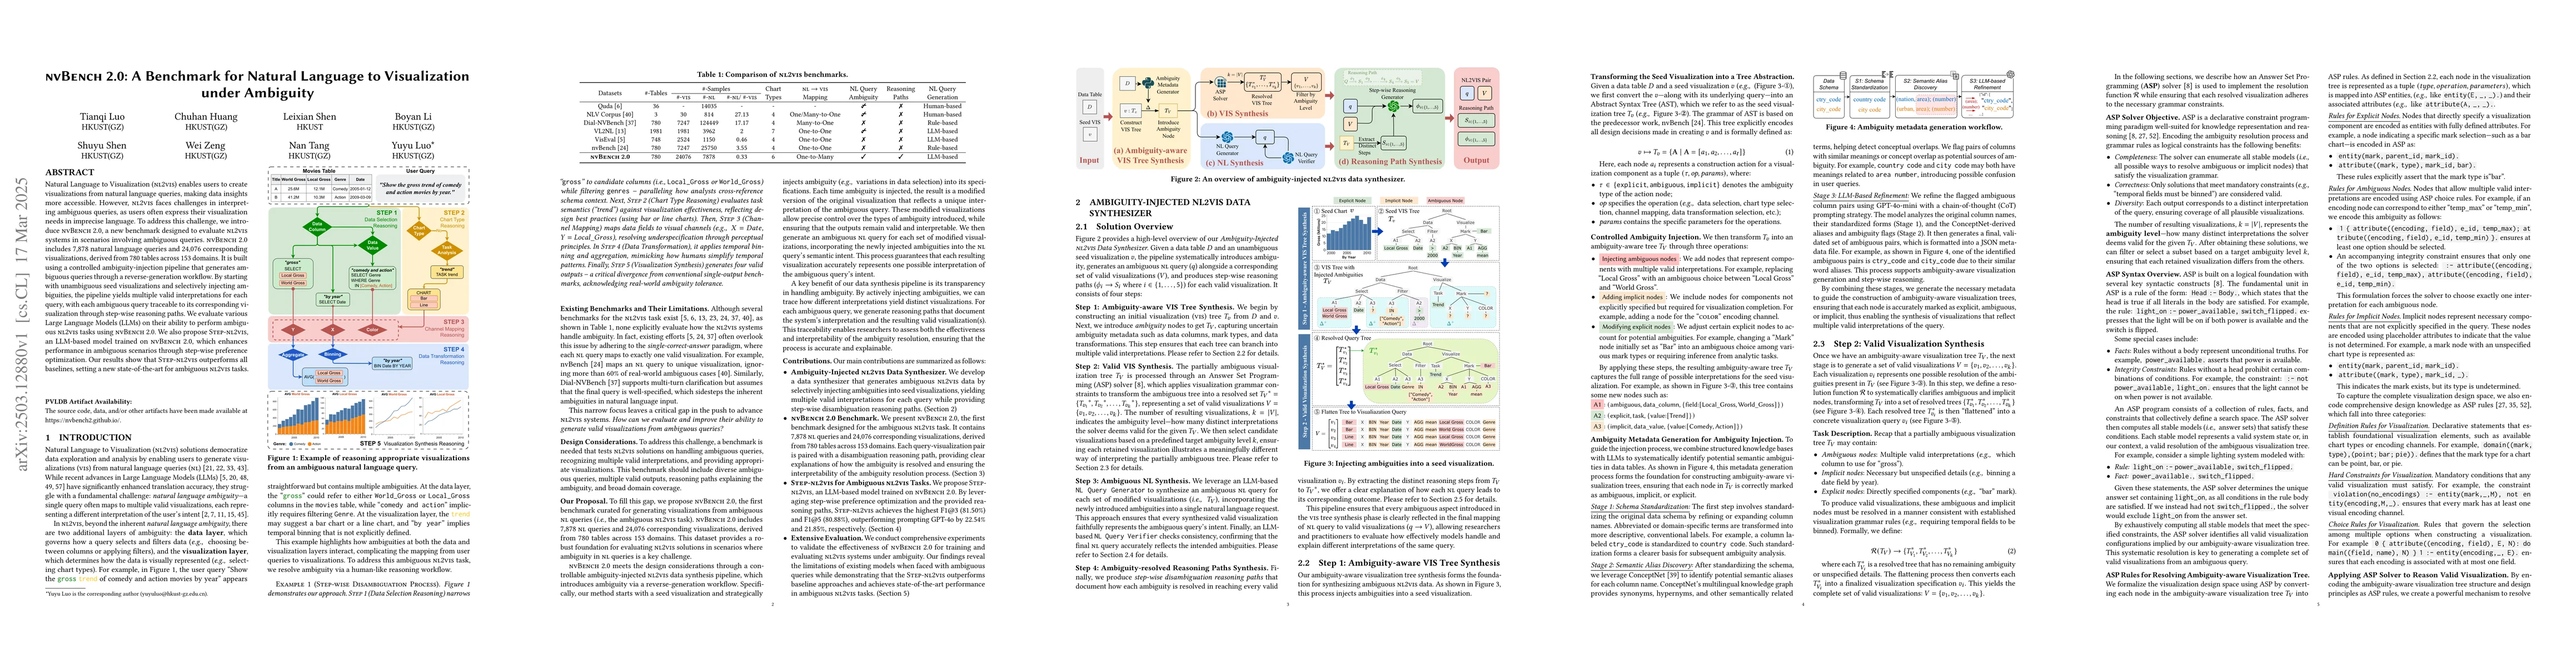
Natural Language to Visualization (NL2VIS) enables users to create visualizations from natural language queries, making data insights more accessible. However, NL2VIS faces challenges in interpreting ...
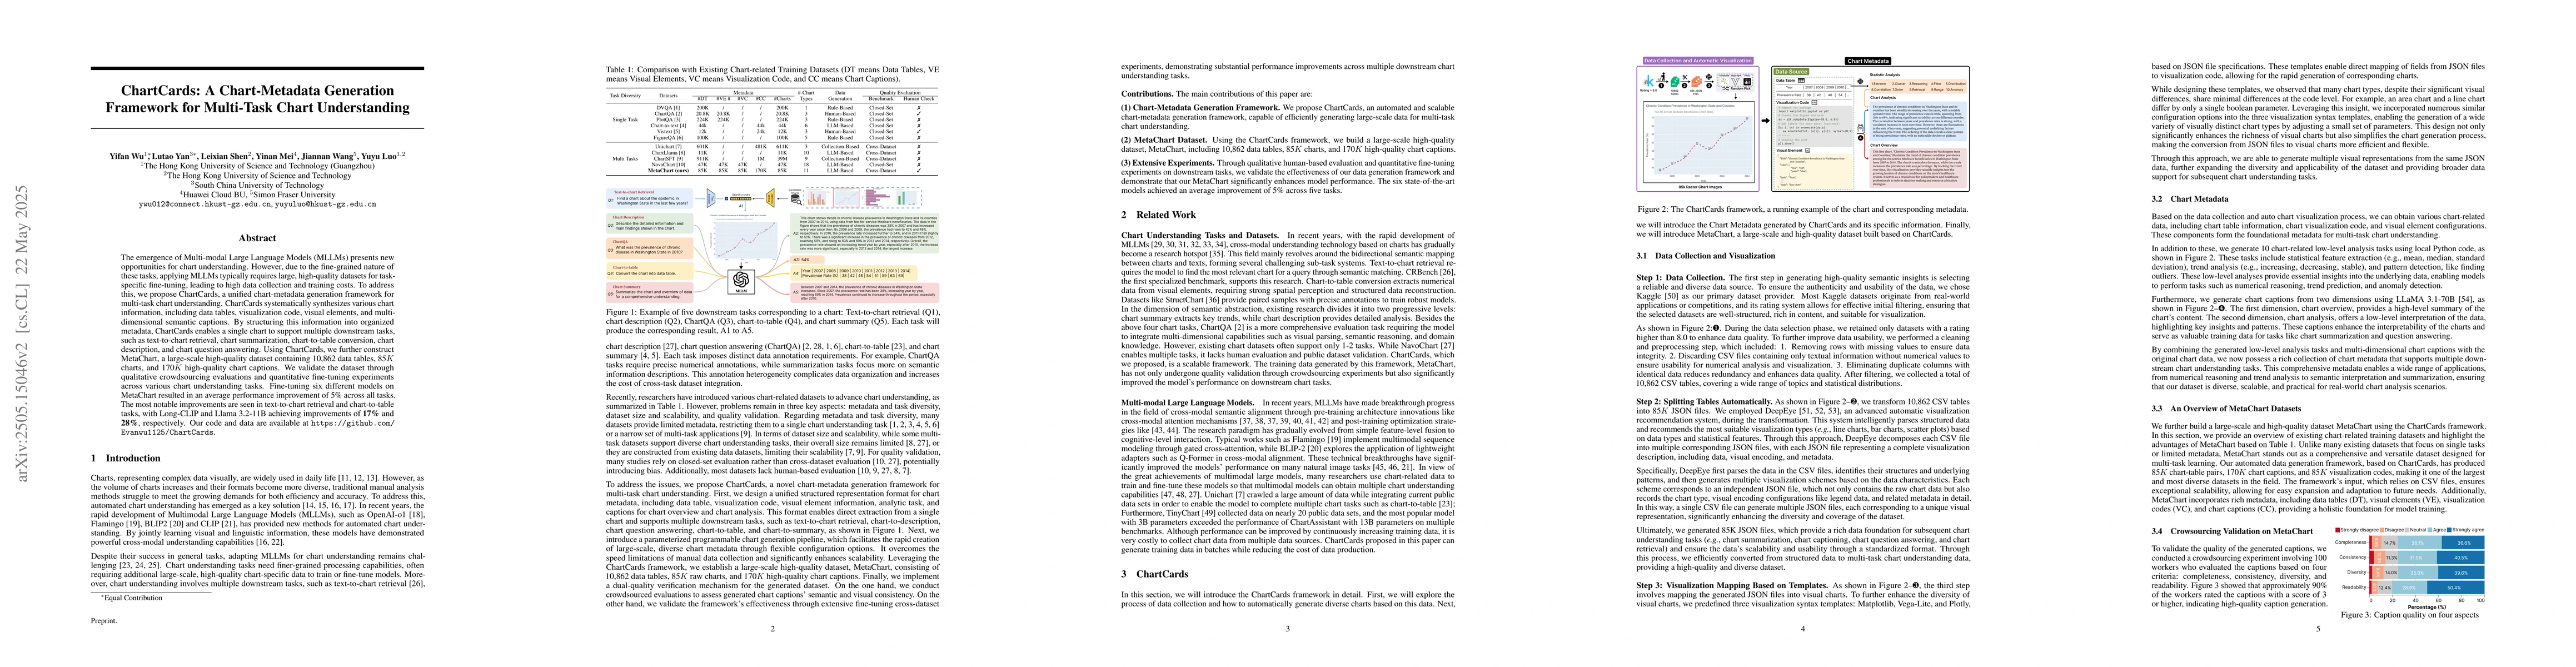
The emergence of Multi-modal Large Language Models (MLLMs) presents new opportunities for chart understanding. However, due to the fine-grained nature of these tasks, applying MLLMs typically requires...
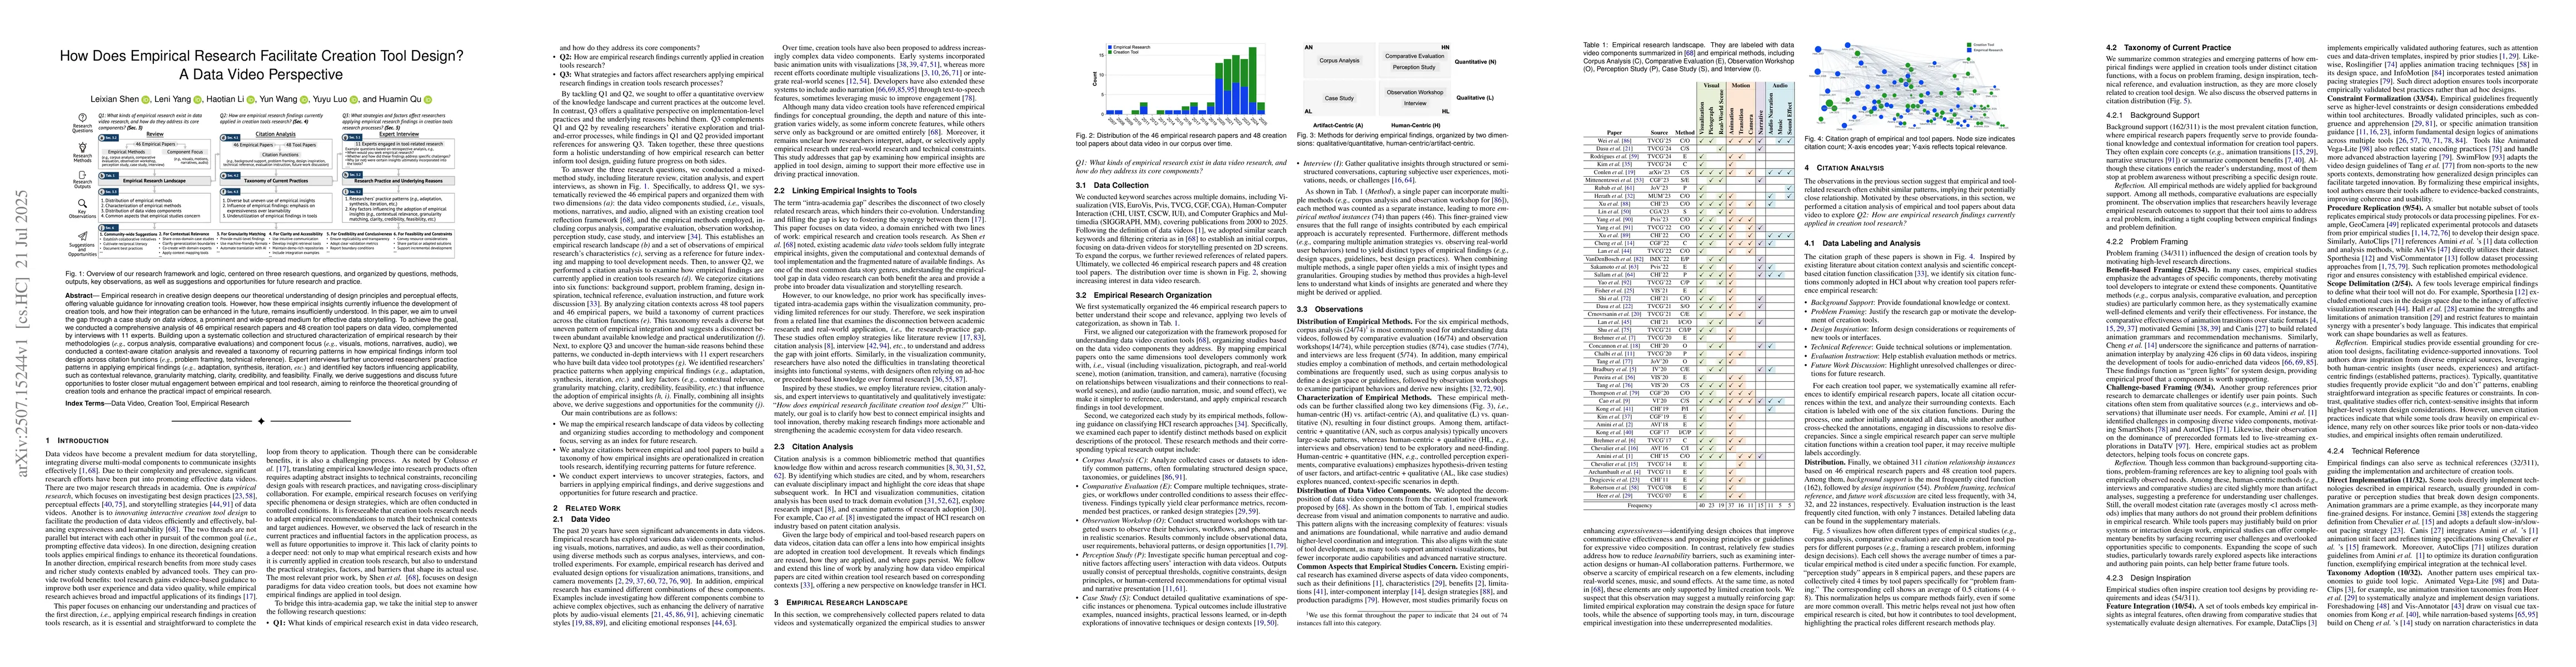
Empirical research in creative design deepens our theoretical understanding of design principles and perceptual effects, offering valuable guidance for innovating creation tools. However, how these em...
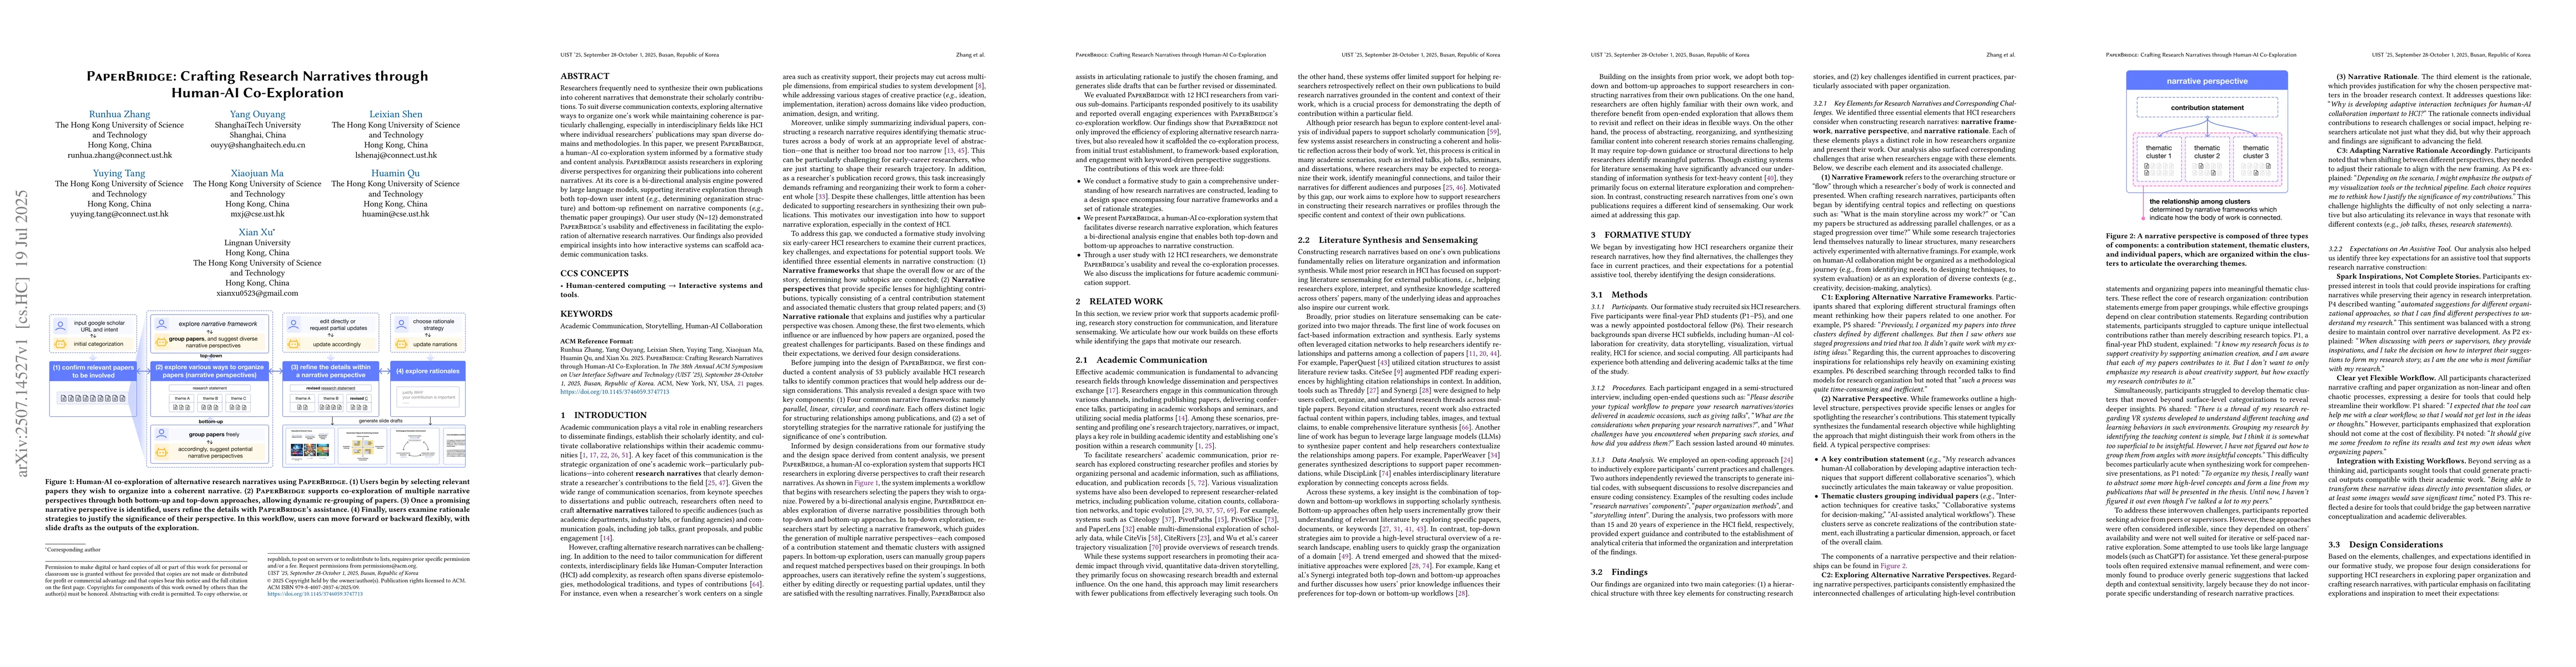
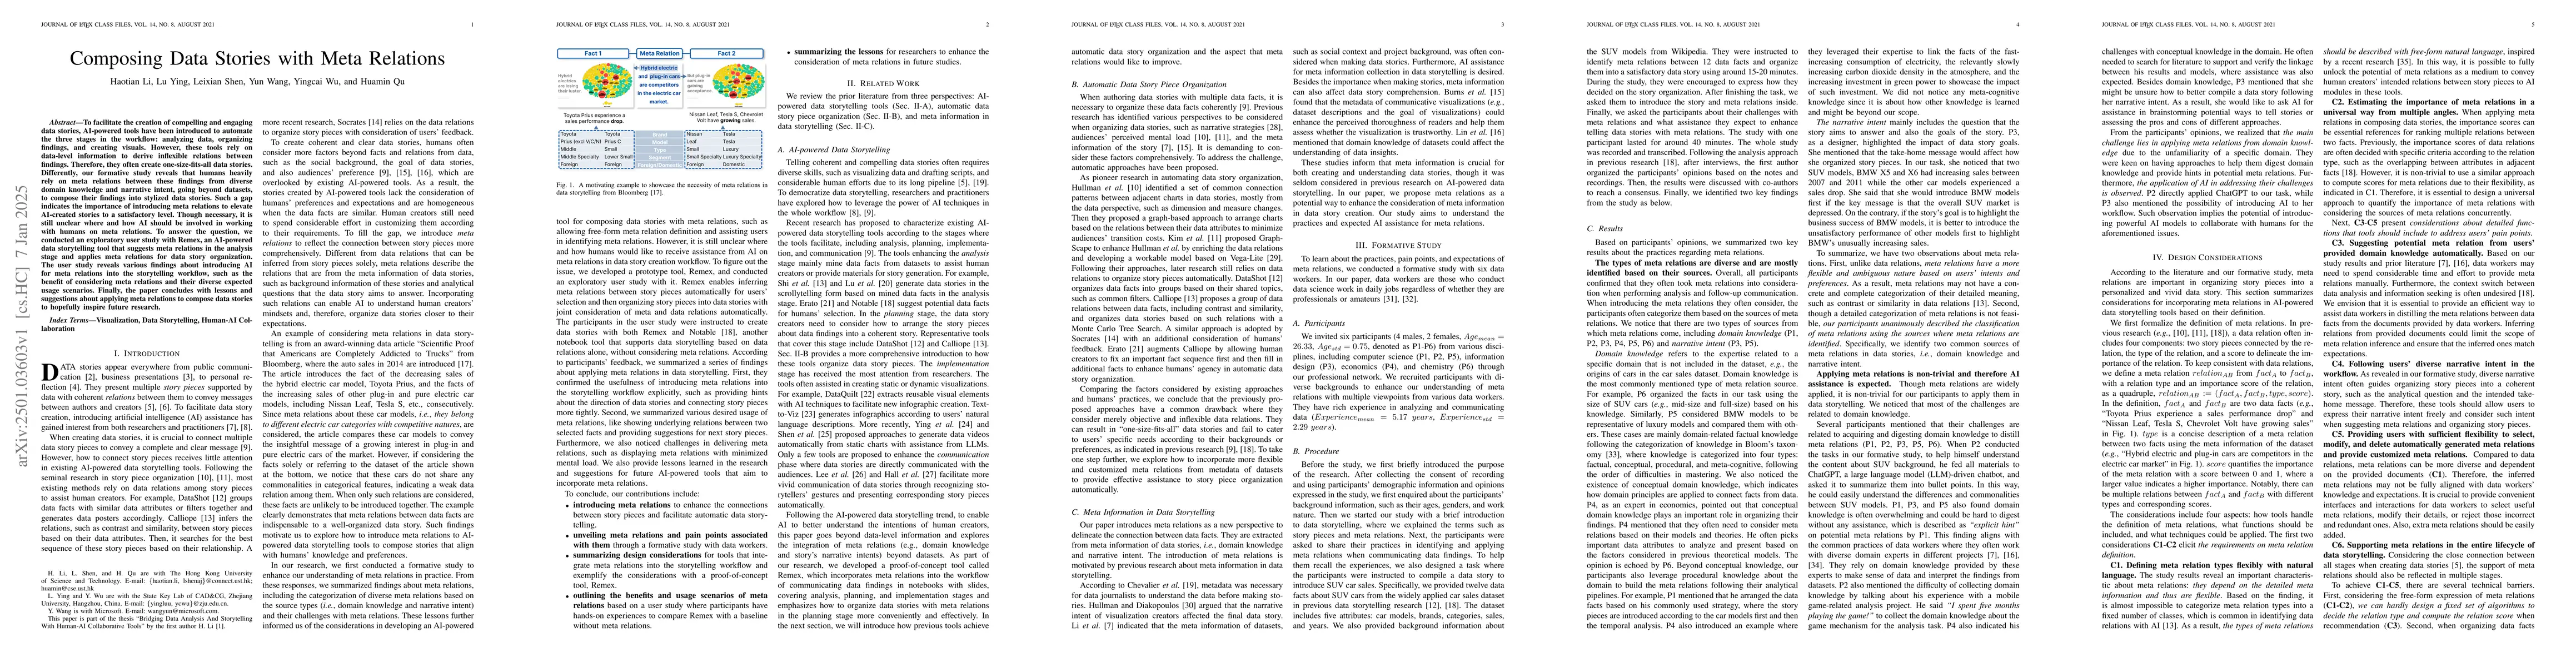
Researchers frequently need to synthesize their own publications into coherent narratives that demonstrate their scholarly contributions. To suit diverse communication contexts, exploring alternative ...
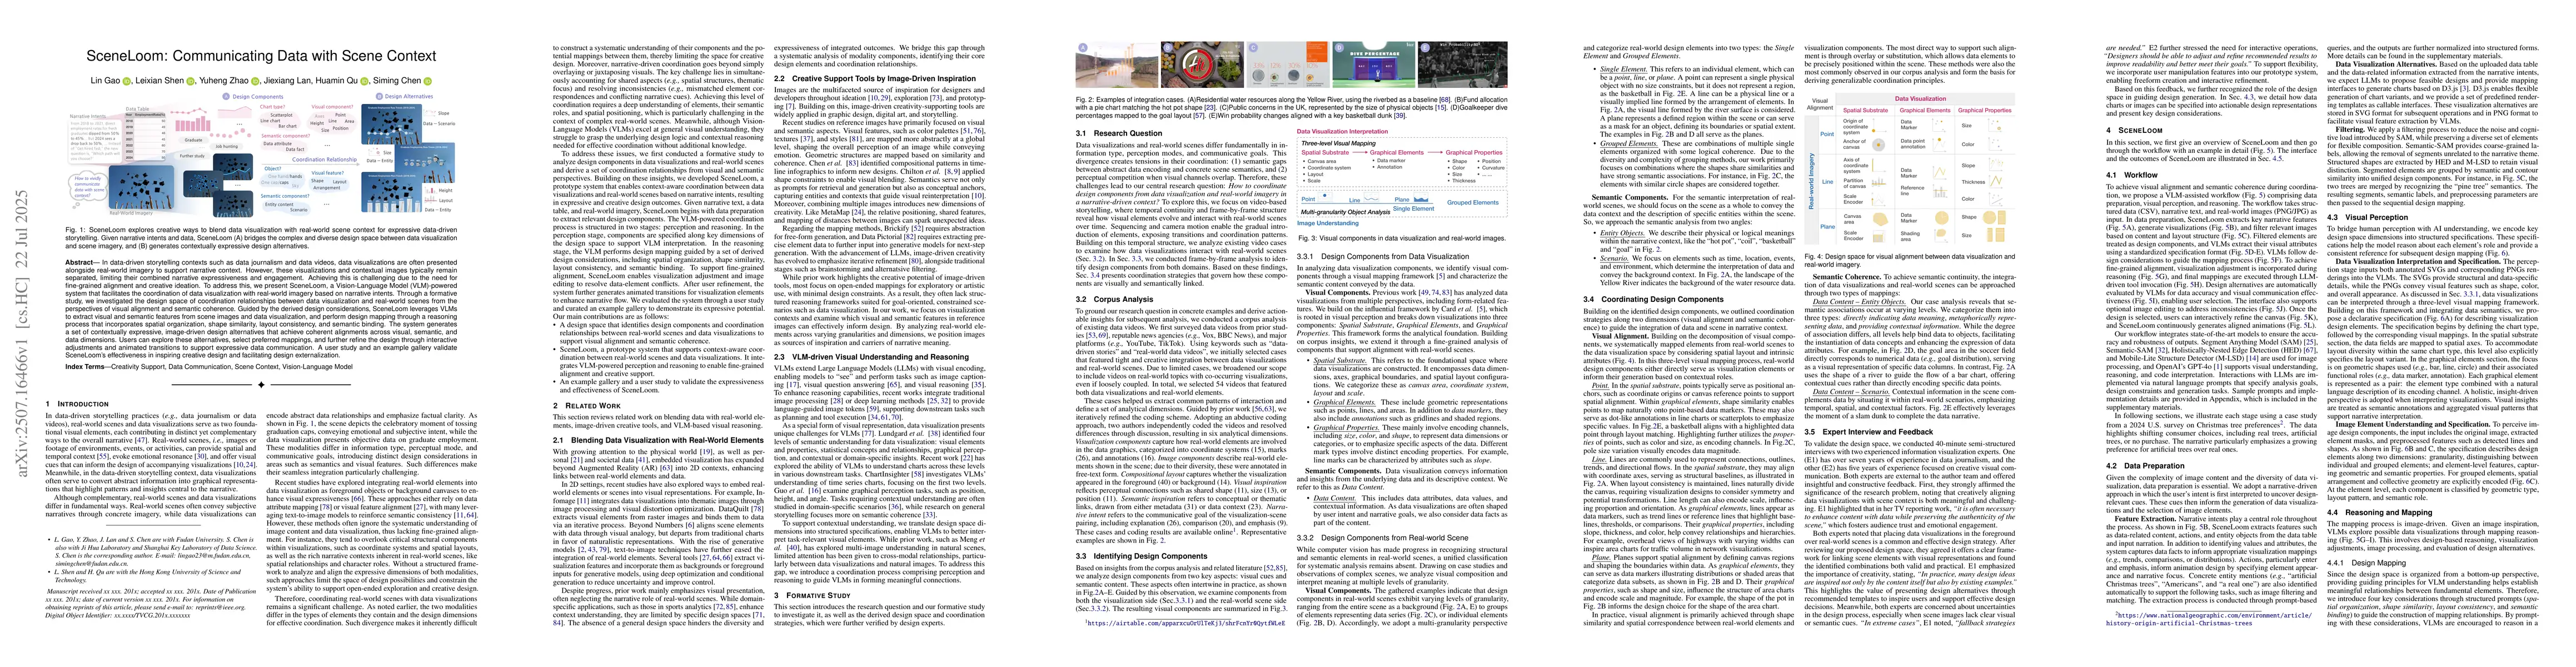
In data-driven storytelling contexts such as data journalism and data videos, data visualizations are often presented alongside real-world imagery to support narrative context. However, these visualiz...
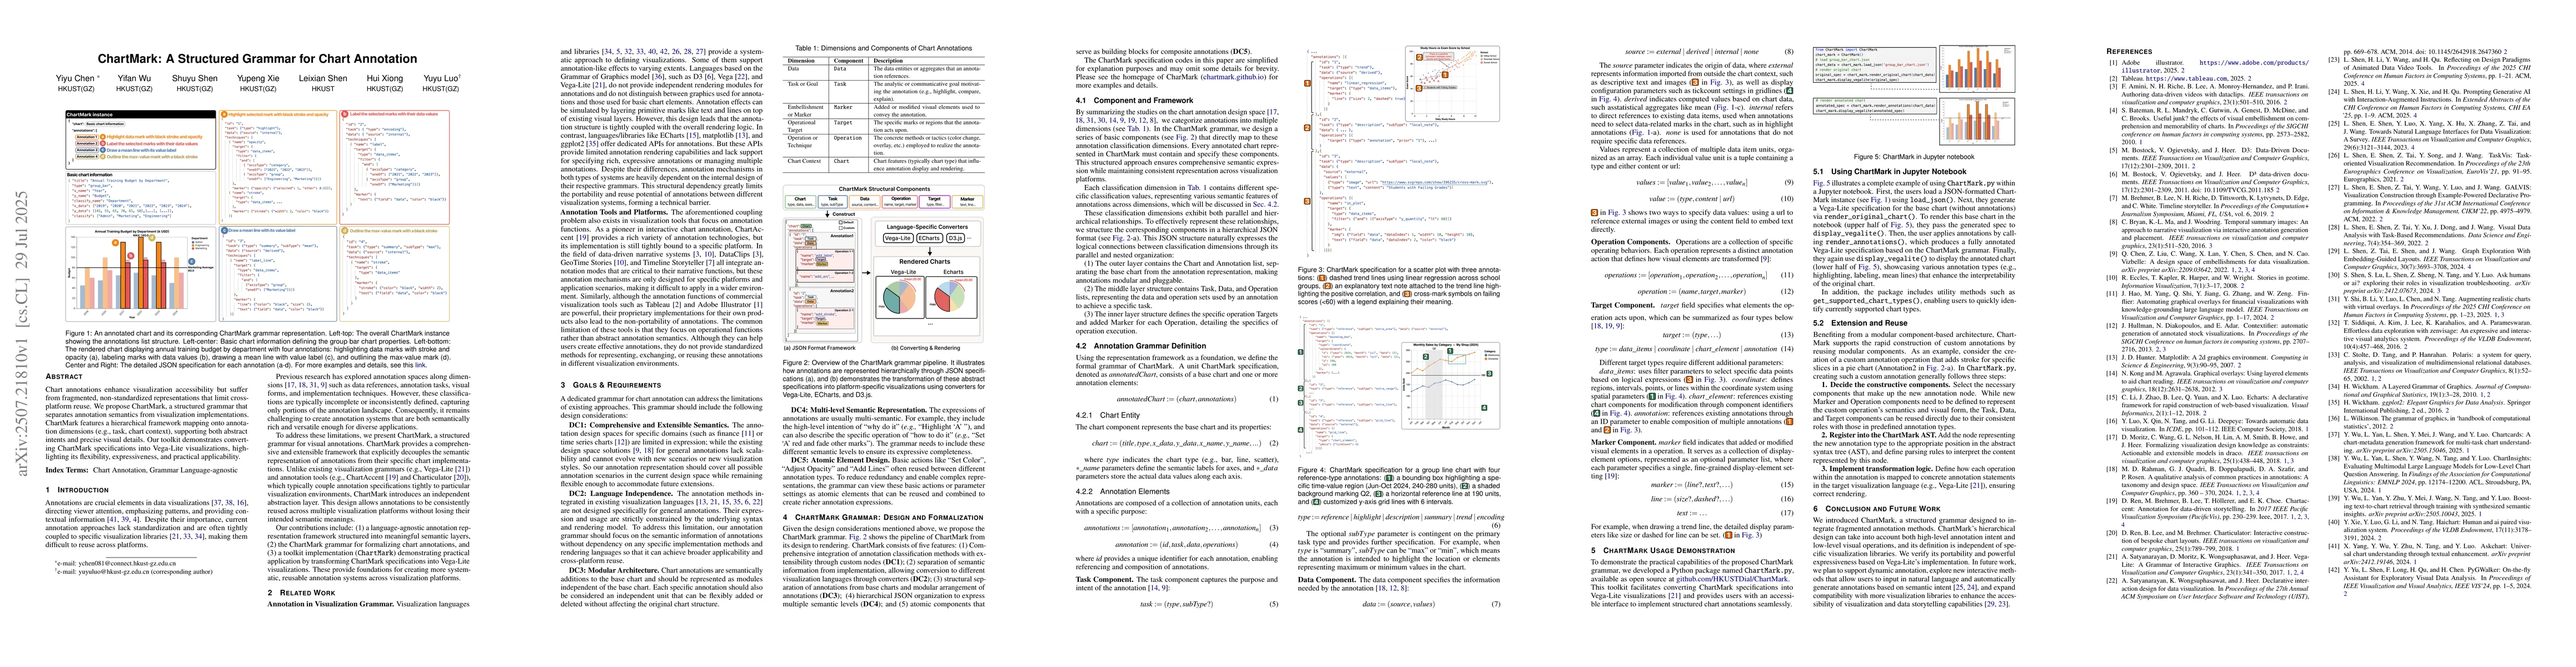
Chart annotations enhance visualization accessibility but suffer from fragmented, non-standardized representations that limit cross-platform reuse. We propose ChartMark, a structured grammar that sepa...
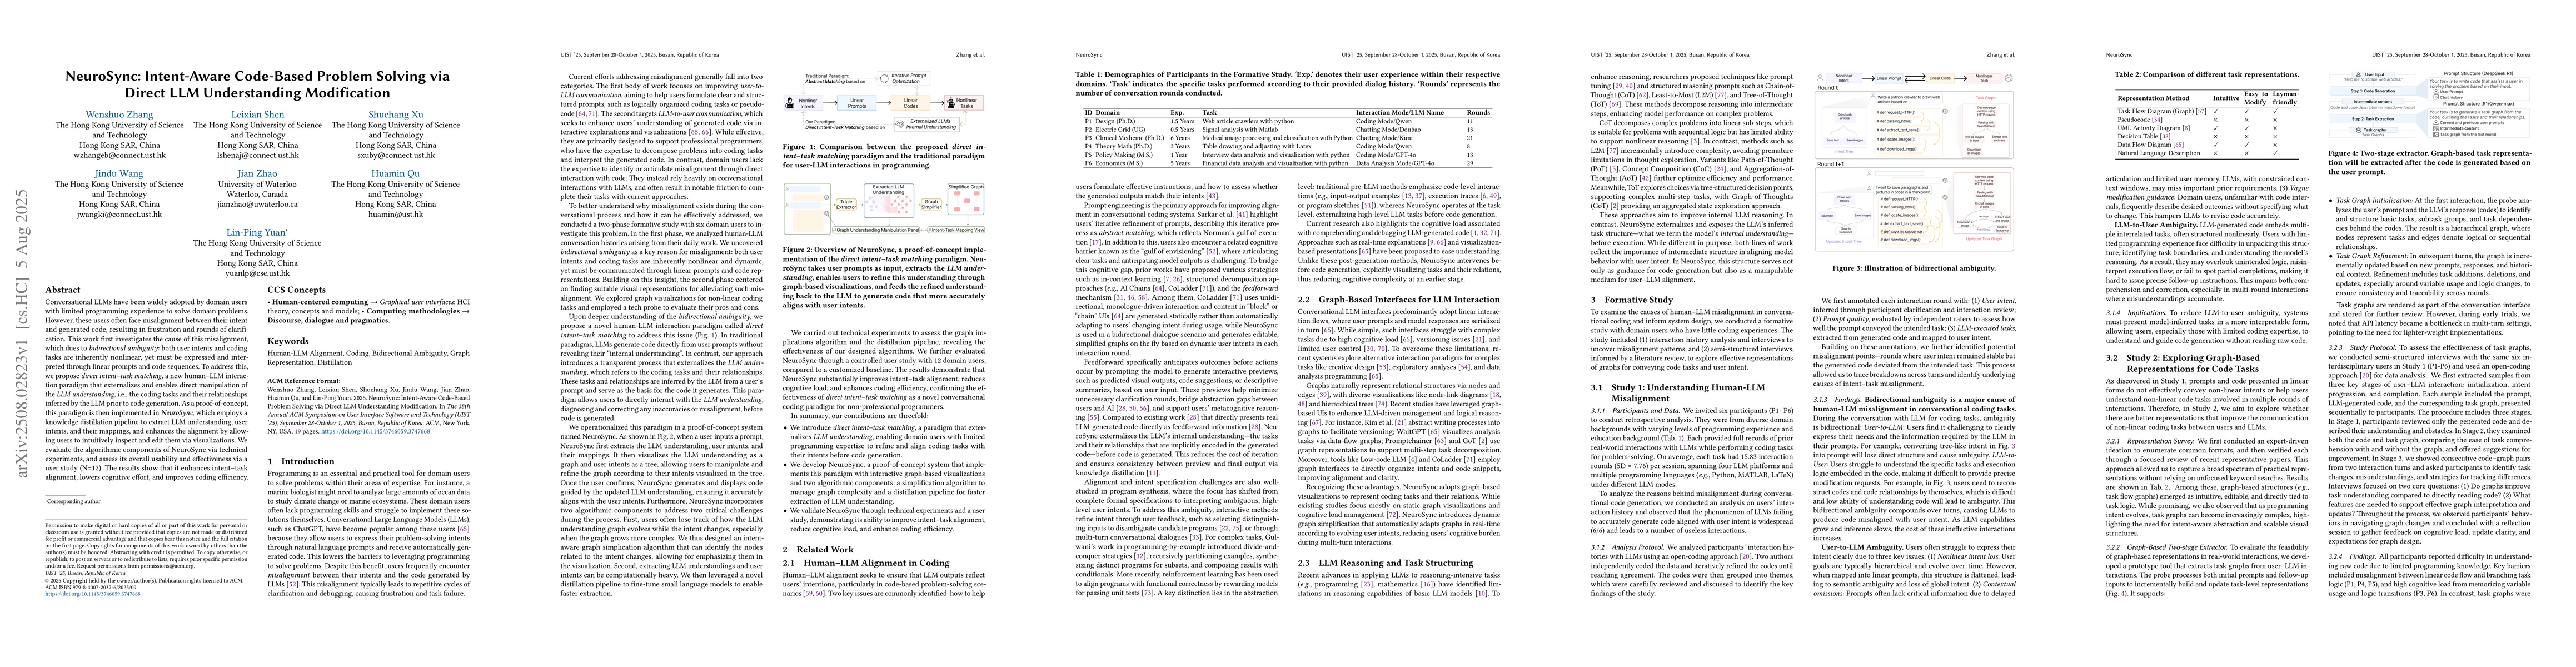
Conversational LLMs have been widely adopted by domain users with limited programming experience to solve domain problems. However, these users often face misalignment between their intent and generat...
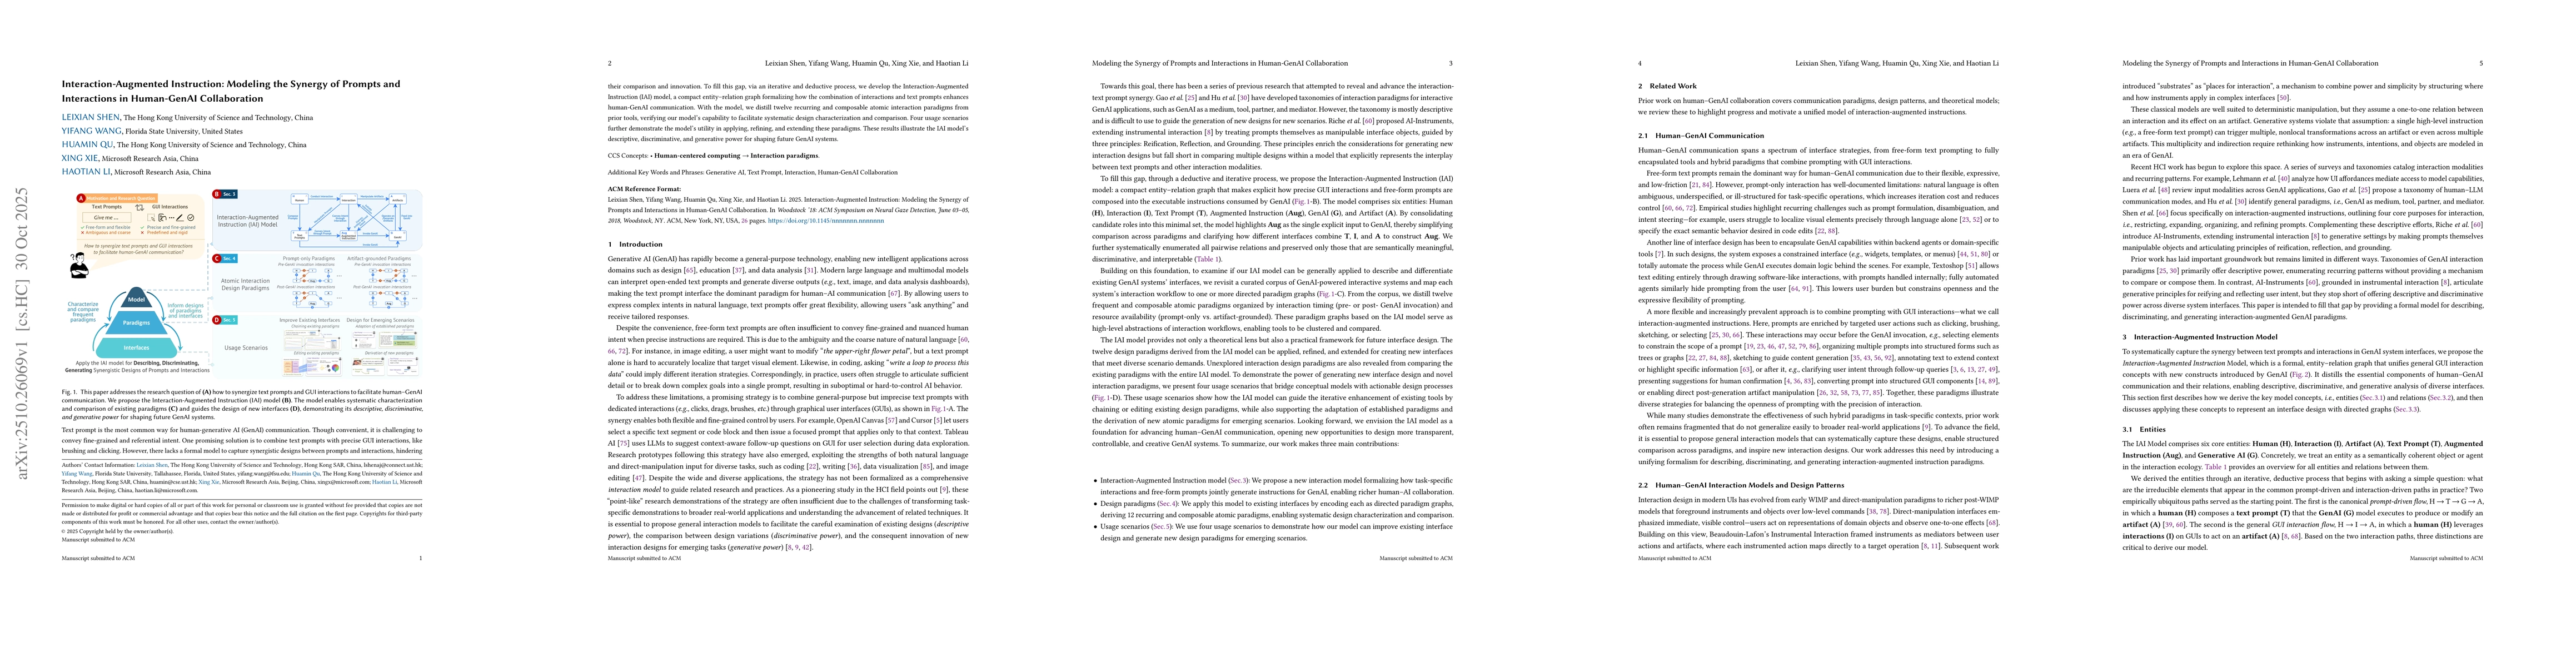
Text prompt is the most common way for human-generative AI (GenAI) communication. Though convenient, it is challenging to convey fine-grained and referential intent. One promising solution is to combi...
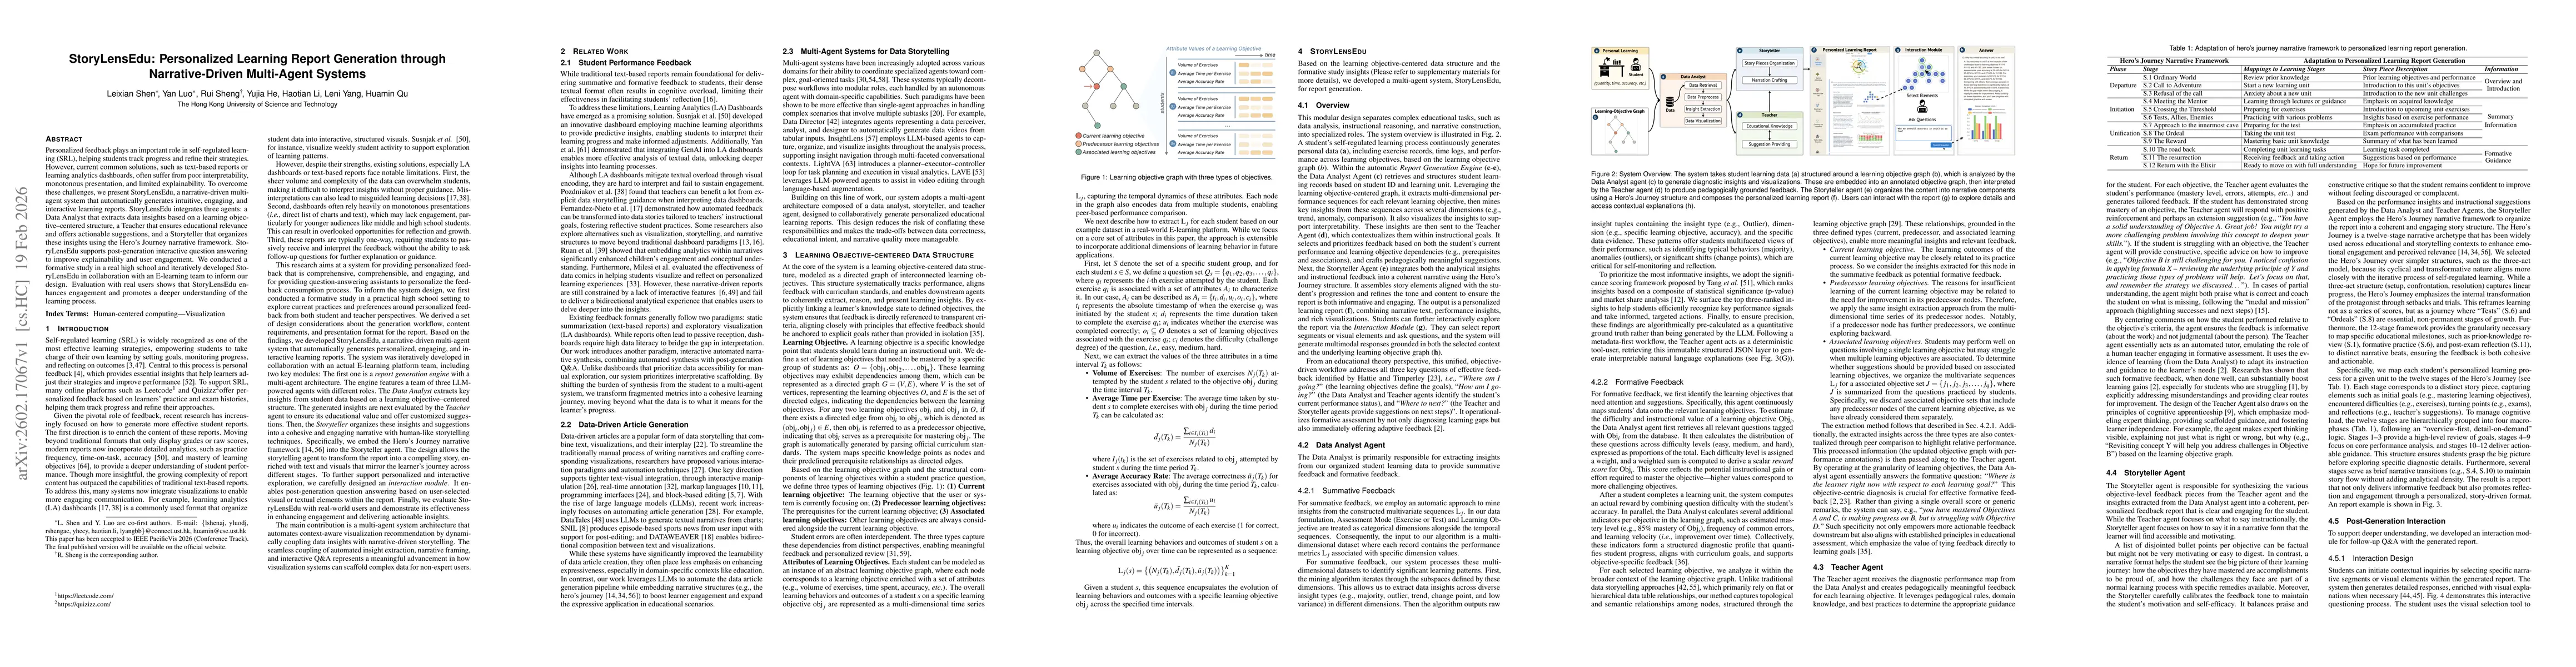
Personalized feedback plays an important role in self-regulated learning (SRL), helping students track progress and refine their strategies. However, current common solutions, such as text-based repor...
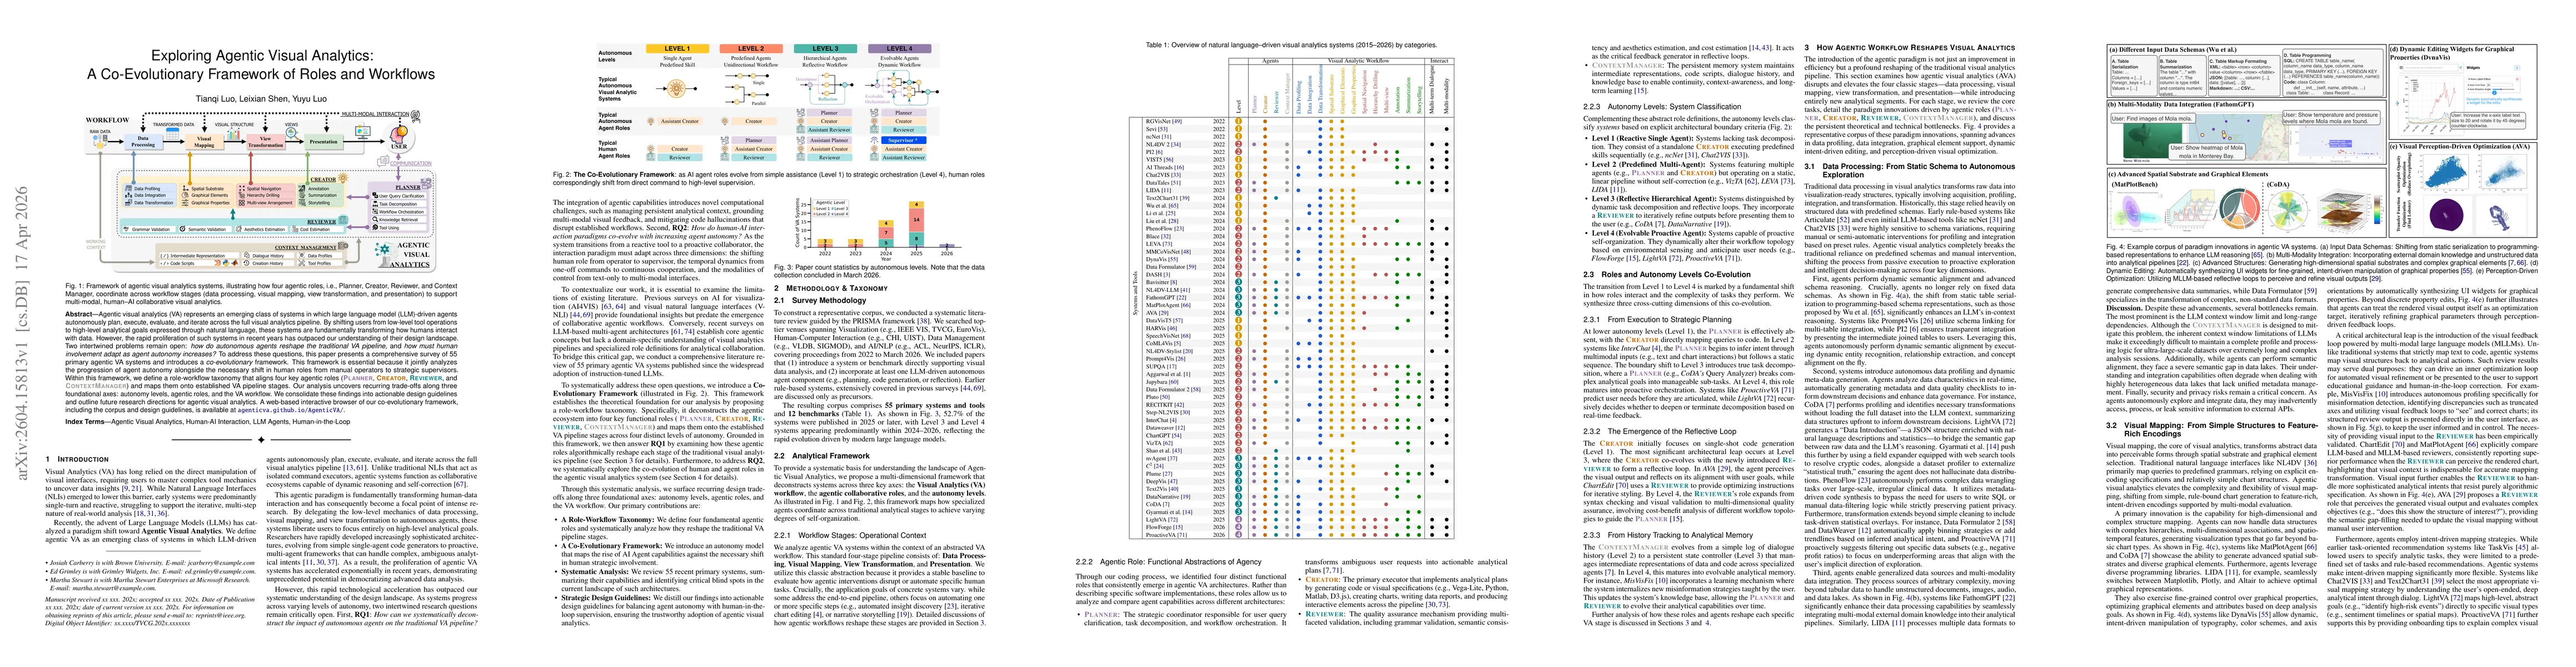
Agentic visual analytics (VA) represents an emerging class of systems in which large language model (LLM)-driven agents autonomously plan, execute, evaluate, and iterate across the full visual analyti...