Publication
Metrics
AI Quick Summary
This paper surveys Visualization-oriented Natural Language Interfaces (V-NLI) that enhance visual analytics by allowing users to interact with data visualizations through natural language, thus reducing the need for direct manipulation. The review categorizes existing V-NLI systems based on a seven-stage pipeline, and discusses future research directions.
Paper Preview
Abstract
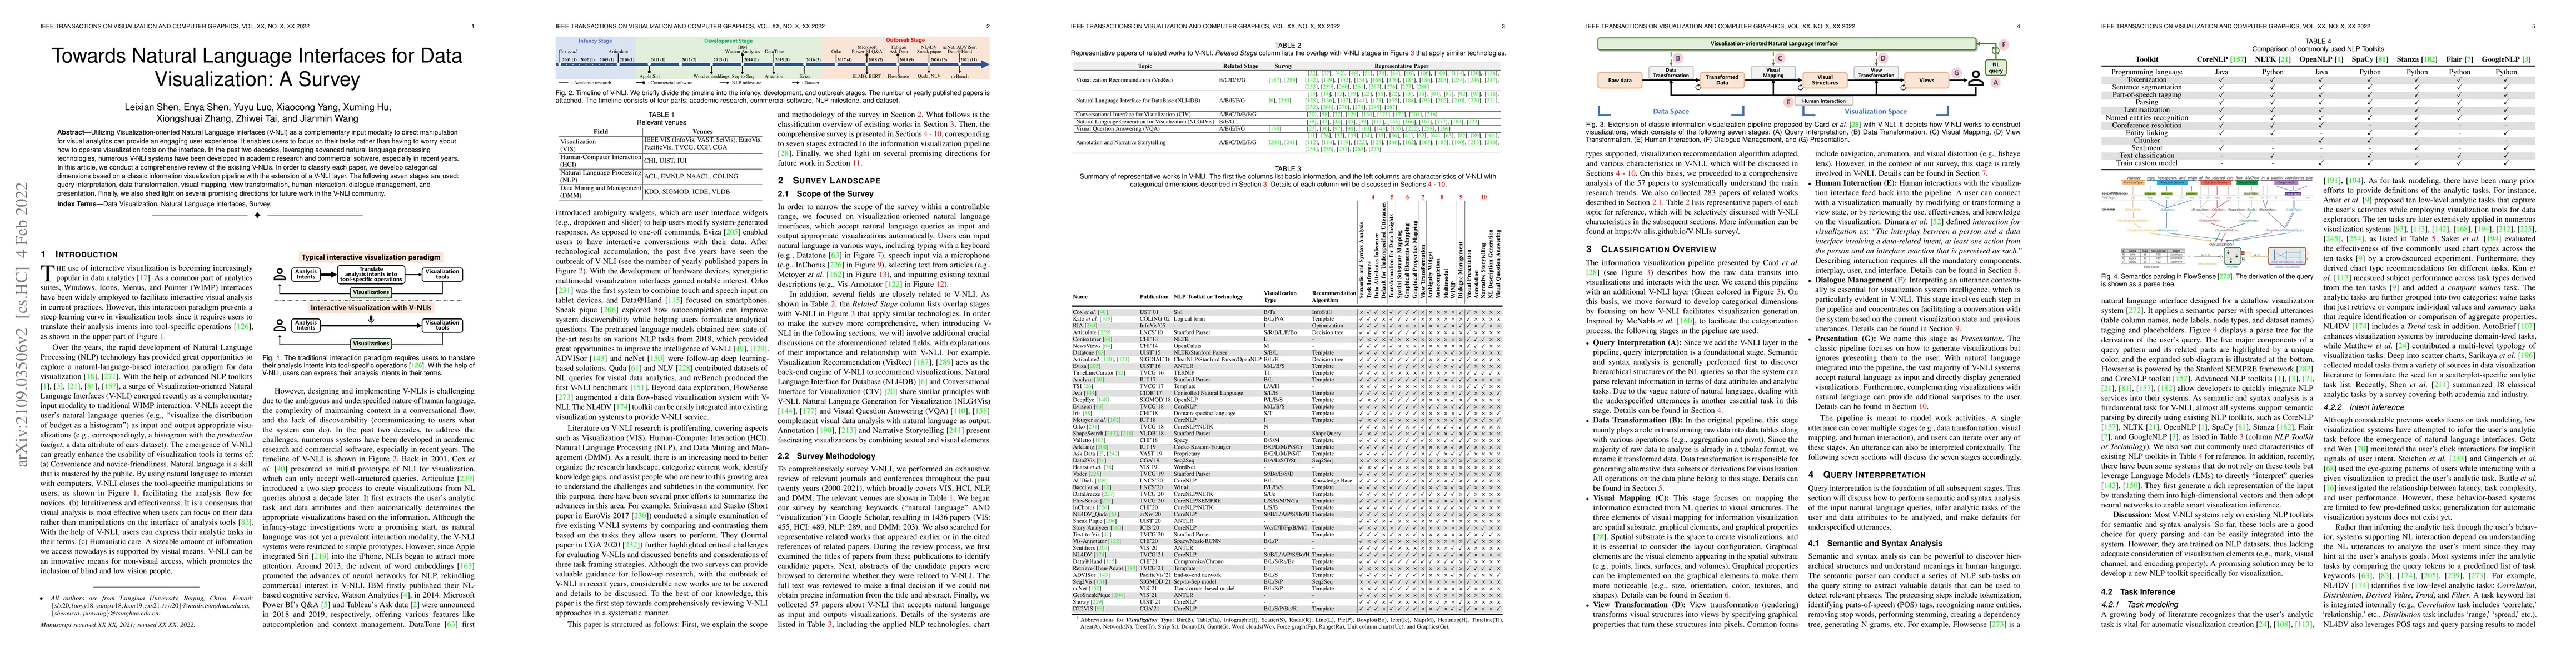
Utilizing Visualization-oriented Natural Language Interfaces (V-NLI) as a complementary input modality to direct manipulation for visual analytics can provide an engaging user experience. It enables users to focus on their tasks rather than having to worry about how to operate visualization tools on the interface. In the past two decades, leveraging advanced natural language processing technologies, numerous V-NLI systems have been developed in academic research and commercial software, especially in recent years. In this article, we conduct a comprehensive review of the existing V-NLIs. In order to classify each paper, we develop categorical dimensions based on a classic information visualization pipeline with the extension of a V-NLI layer. The following seven stages are used: query interpretation, data transformation, visual mapping, view transformation, human interaction, dialogue management, and presentation. Finally, we also shed light on several promising directions for future work in the V-NLI community.
AI Key Findings
Get AI-generated insights about this paper's methodology, results, significance, and more — seven facets brought into focus.
Impact
Paper Details
Authors
PDF Preview
Key Terms
Citation Network
Current paper (gray), citations (green), references (blue)
Display is limited for performance on very large graphs.
Discussion 0