Academic Profile
Statistics
Similar Authors
Papers on arXiv
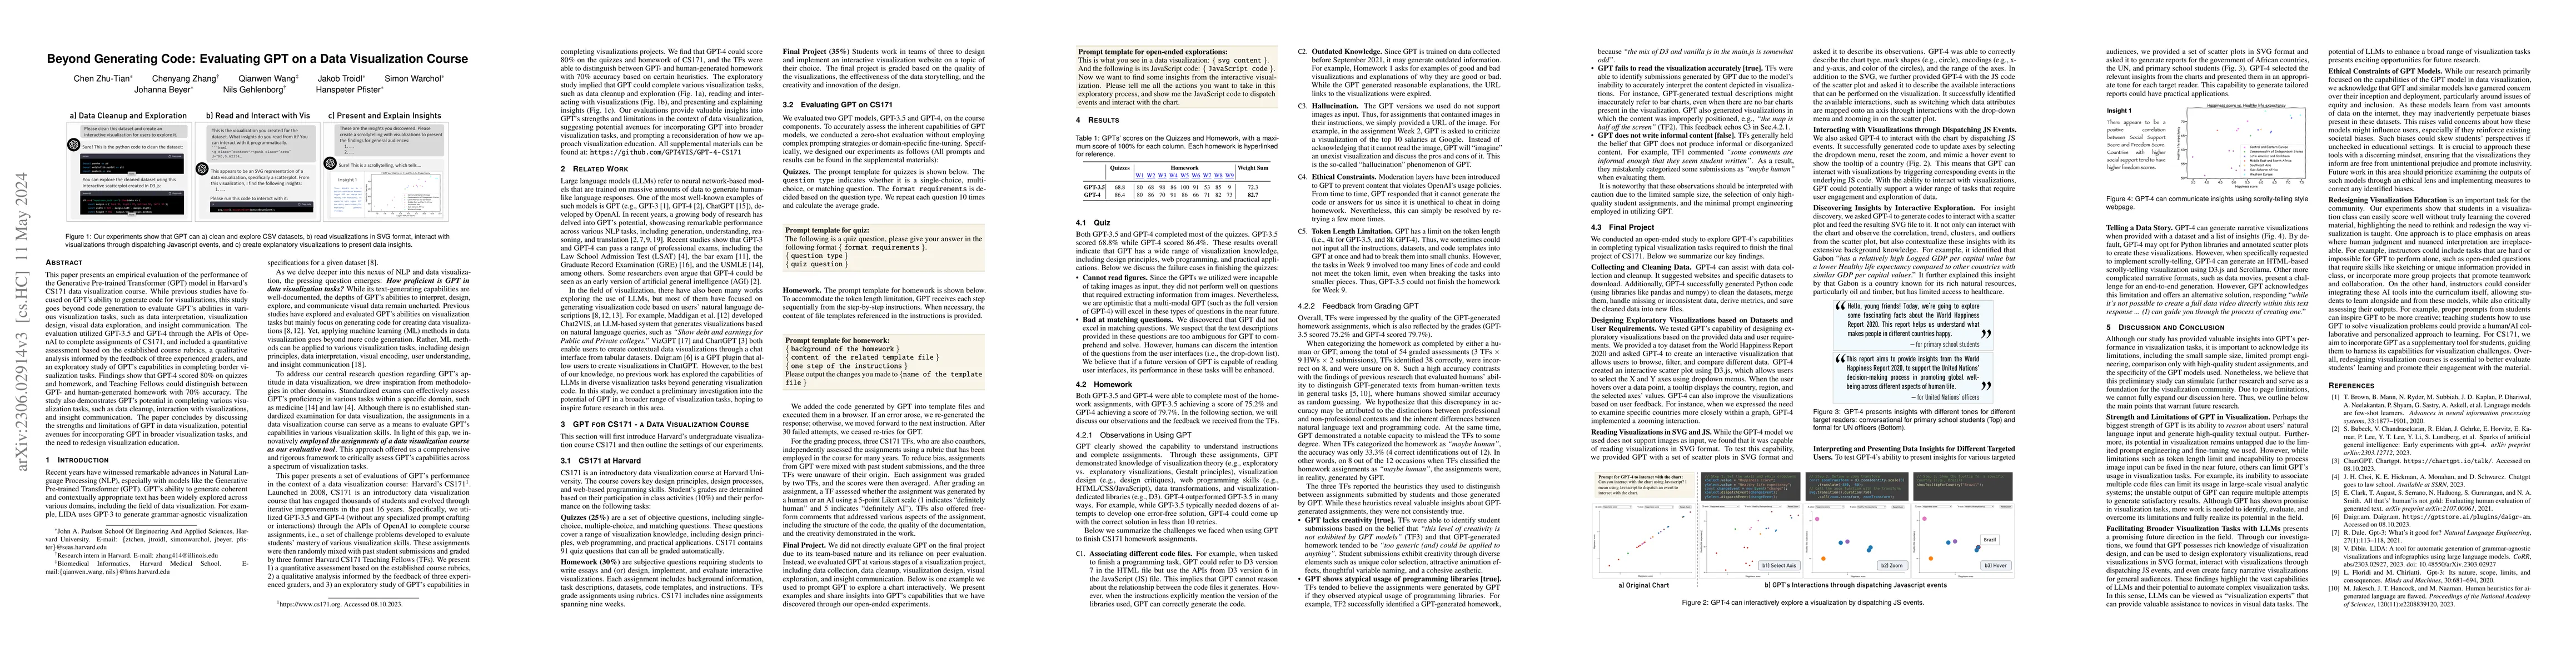
This paper presents an empirical evaluation of the performance of the Generative Pre-trained Transformer (GPT) model in Harvard's CS171 data visualization course. While previous studies have focused...
The imminent release of tissue atlases combining multi-channel microscopy with single cell sequencing and other omics data from normal and diseased specimens creates an urgent need for data and meta...
Single-cell RNA-Sequencing (scRNA-Seq) has undergone major technological advances in recent years, enabling the conception of various organism-level cell atlassing projects. With increasing numbers ...
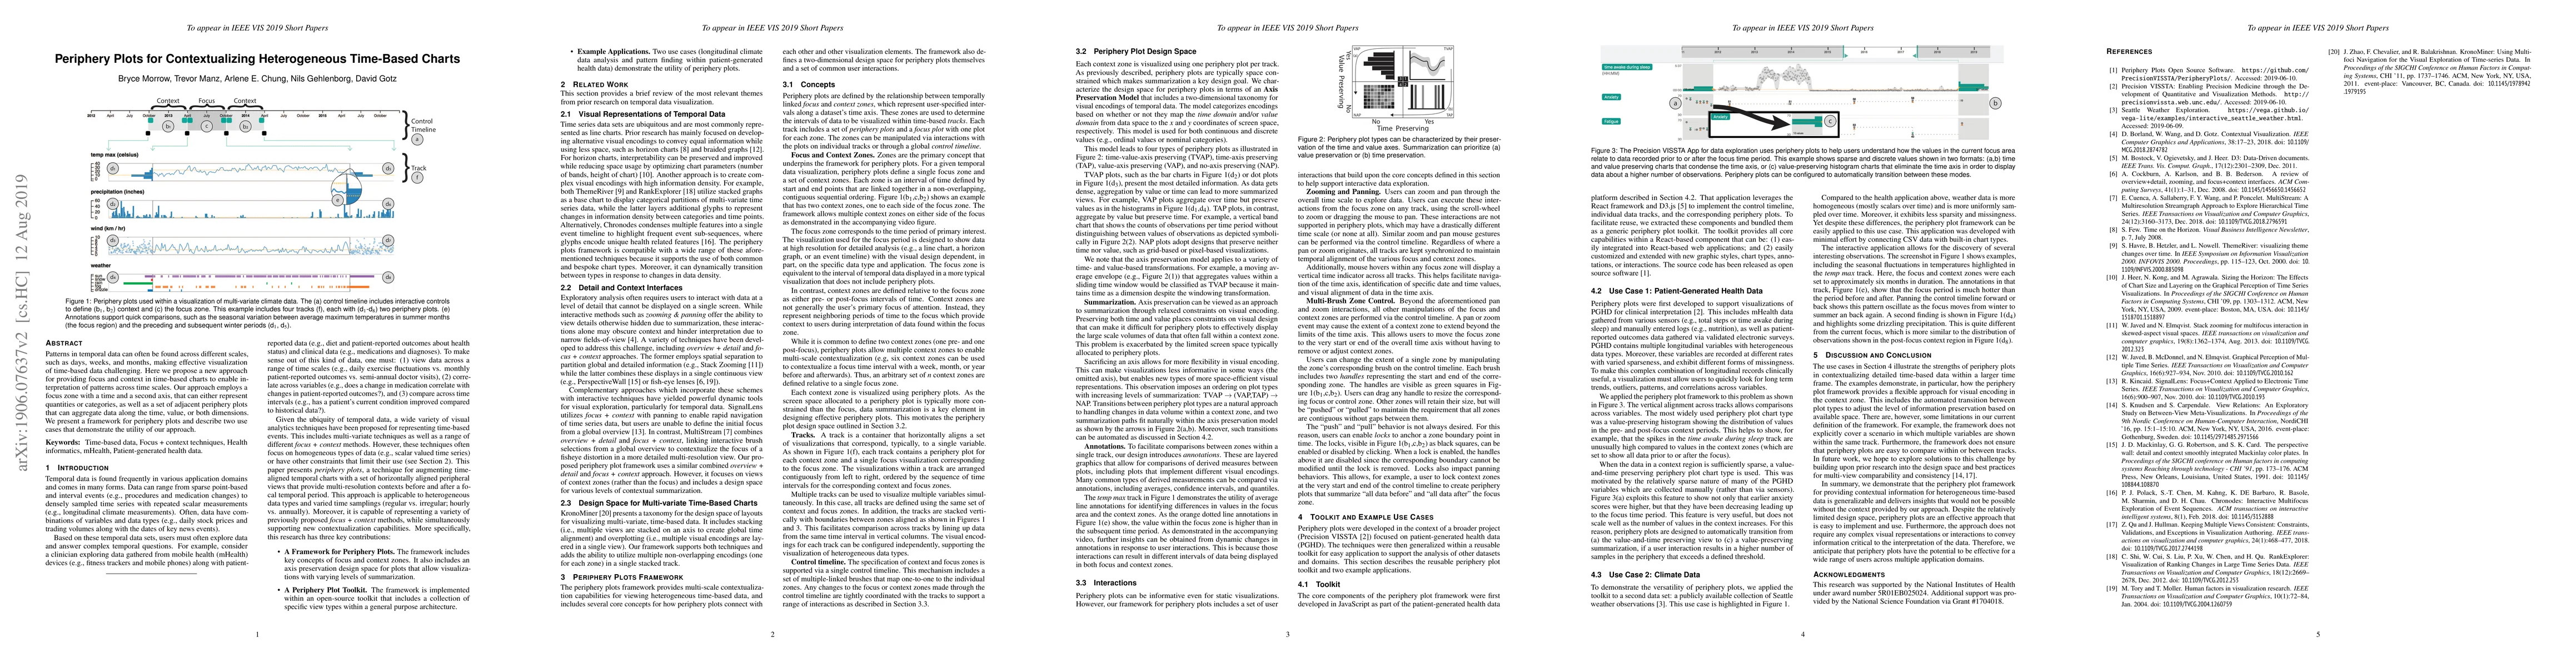
Patterns in temporal data can often be found across different scales, such as days, weeks, and months, making effective visualization of time-based data challenging. Here we propose a new approach f...
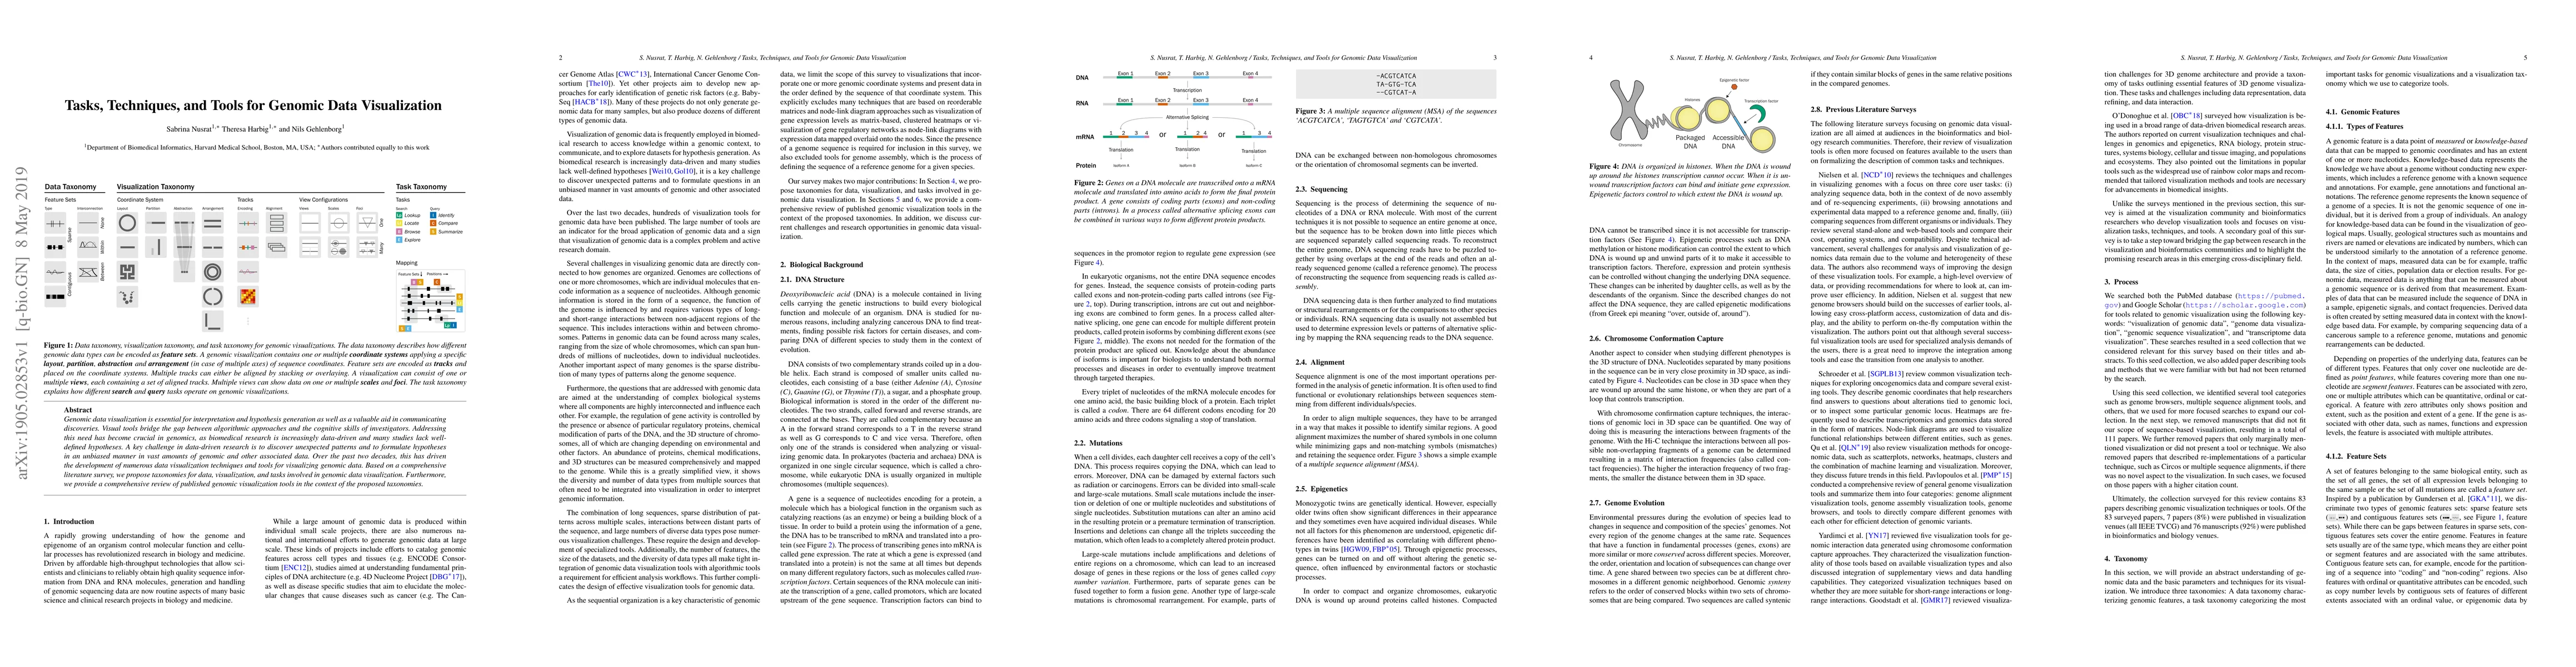
Genomic data visualization is essential for interpretation and hypothesis generation as well as a valuable aid in communicating discoveries. Visual tools bridge the gap between algorithmic approache...
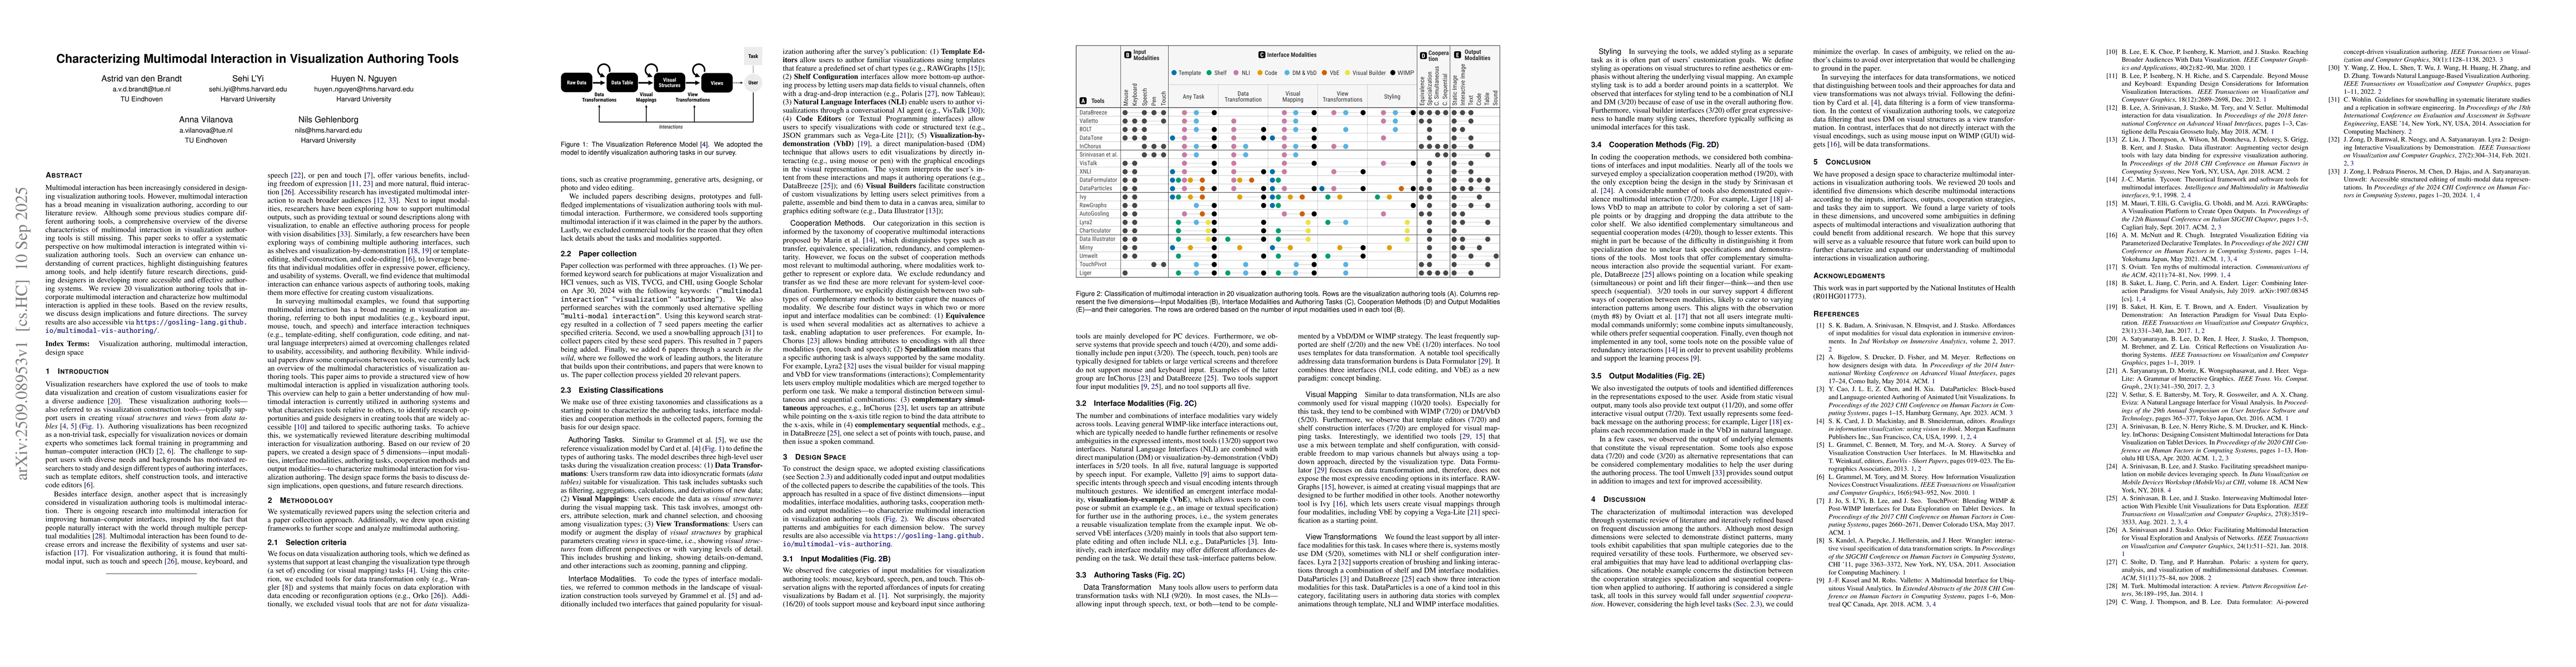
Multimodal interaction has been increasingly considered in designing visualization authoring tools. However, multimodal interaction has a broad meaning in visualization authoring, according to our lit...
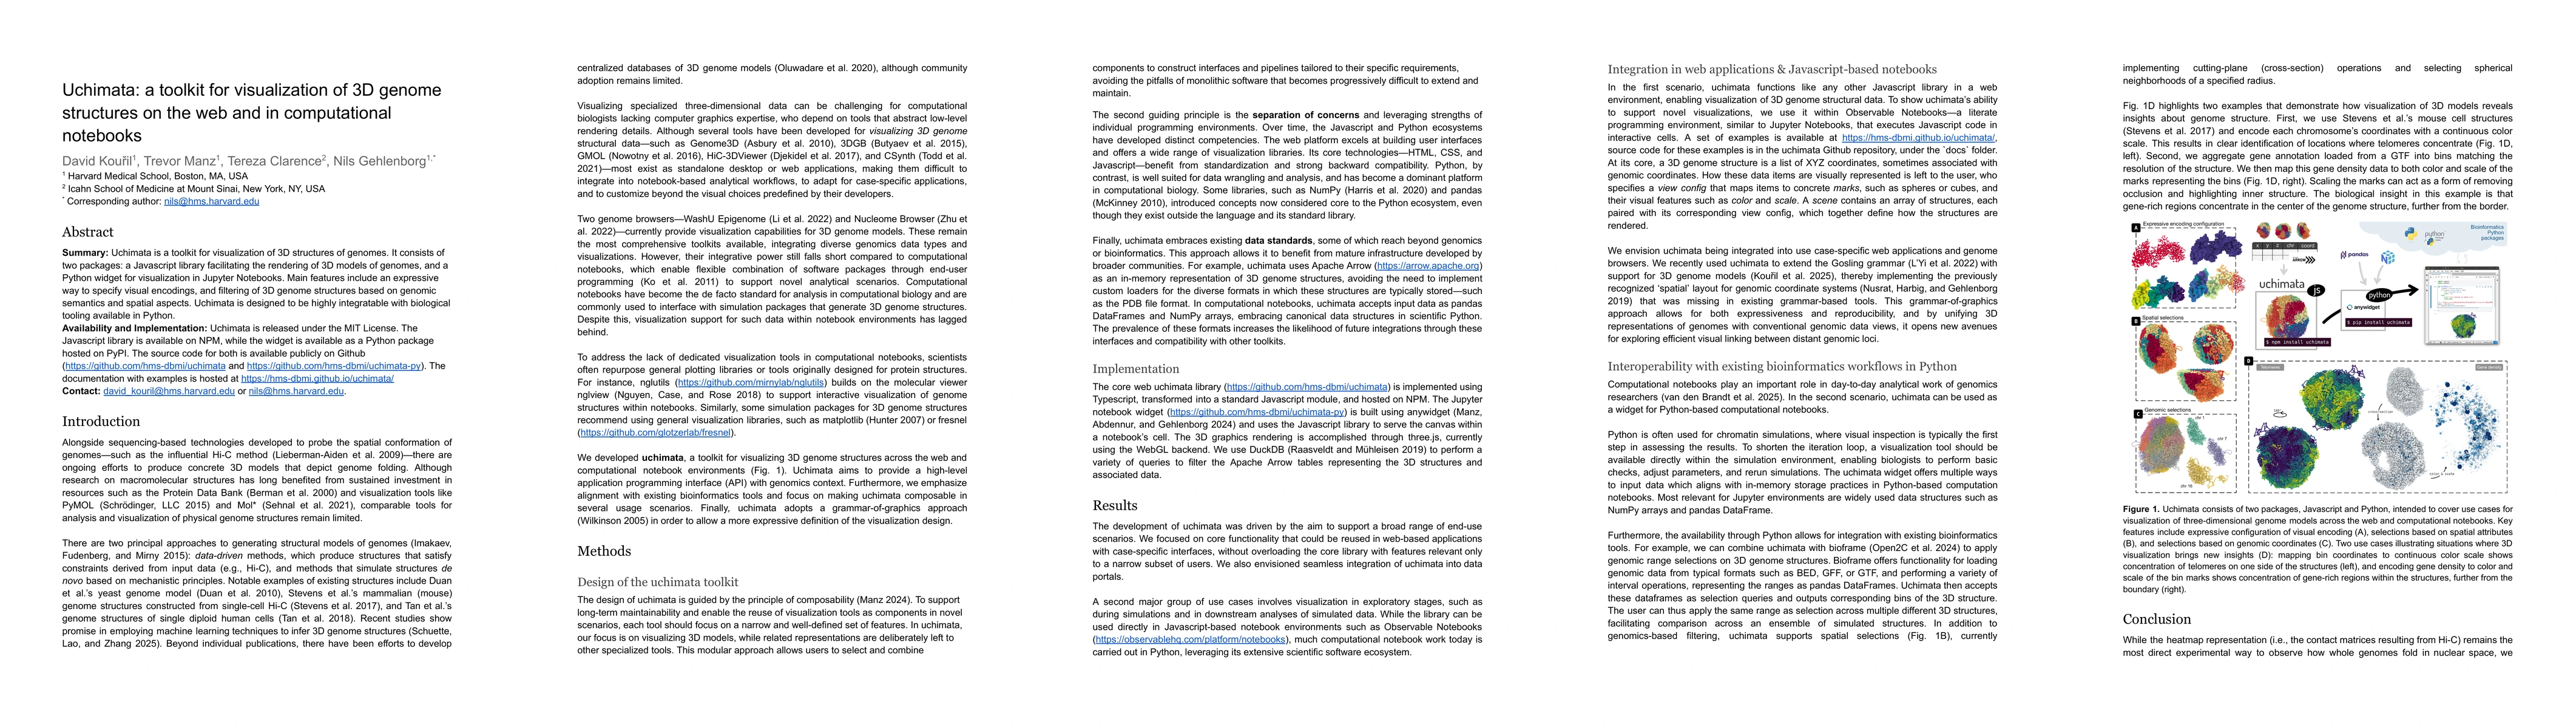
Summary: Uchimata is a toolkit for visualization of 3D structures of genomes. It consists of two packages: a Javascript library facilitating the rendering of 3D models of genomes, and a Python widget ...
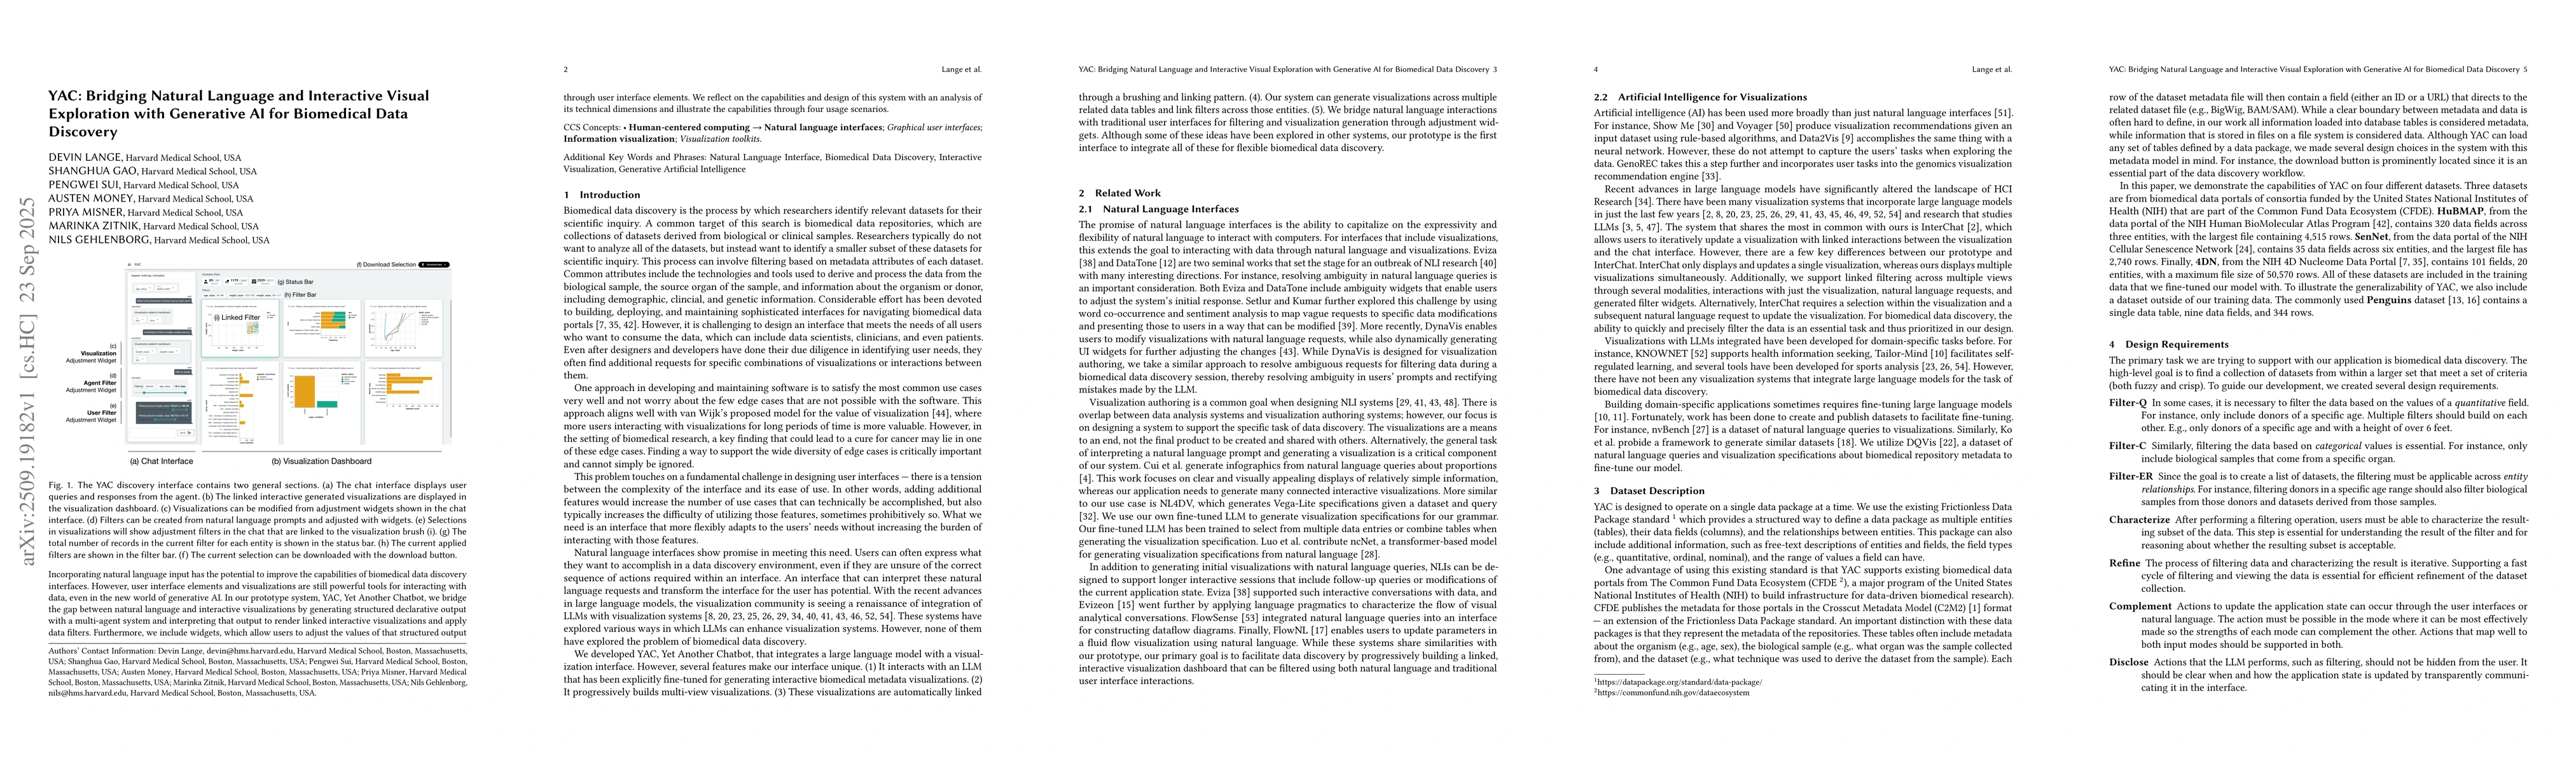
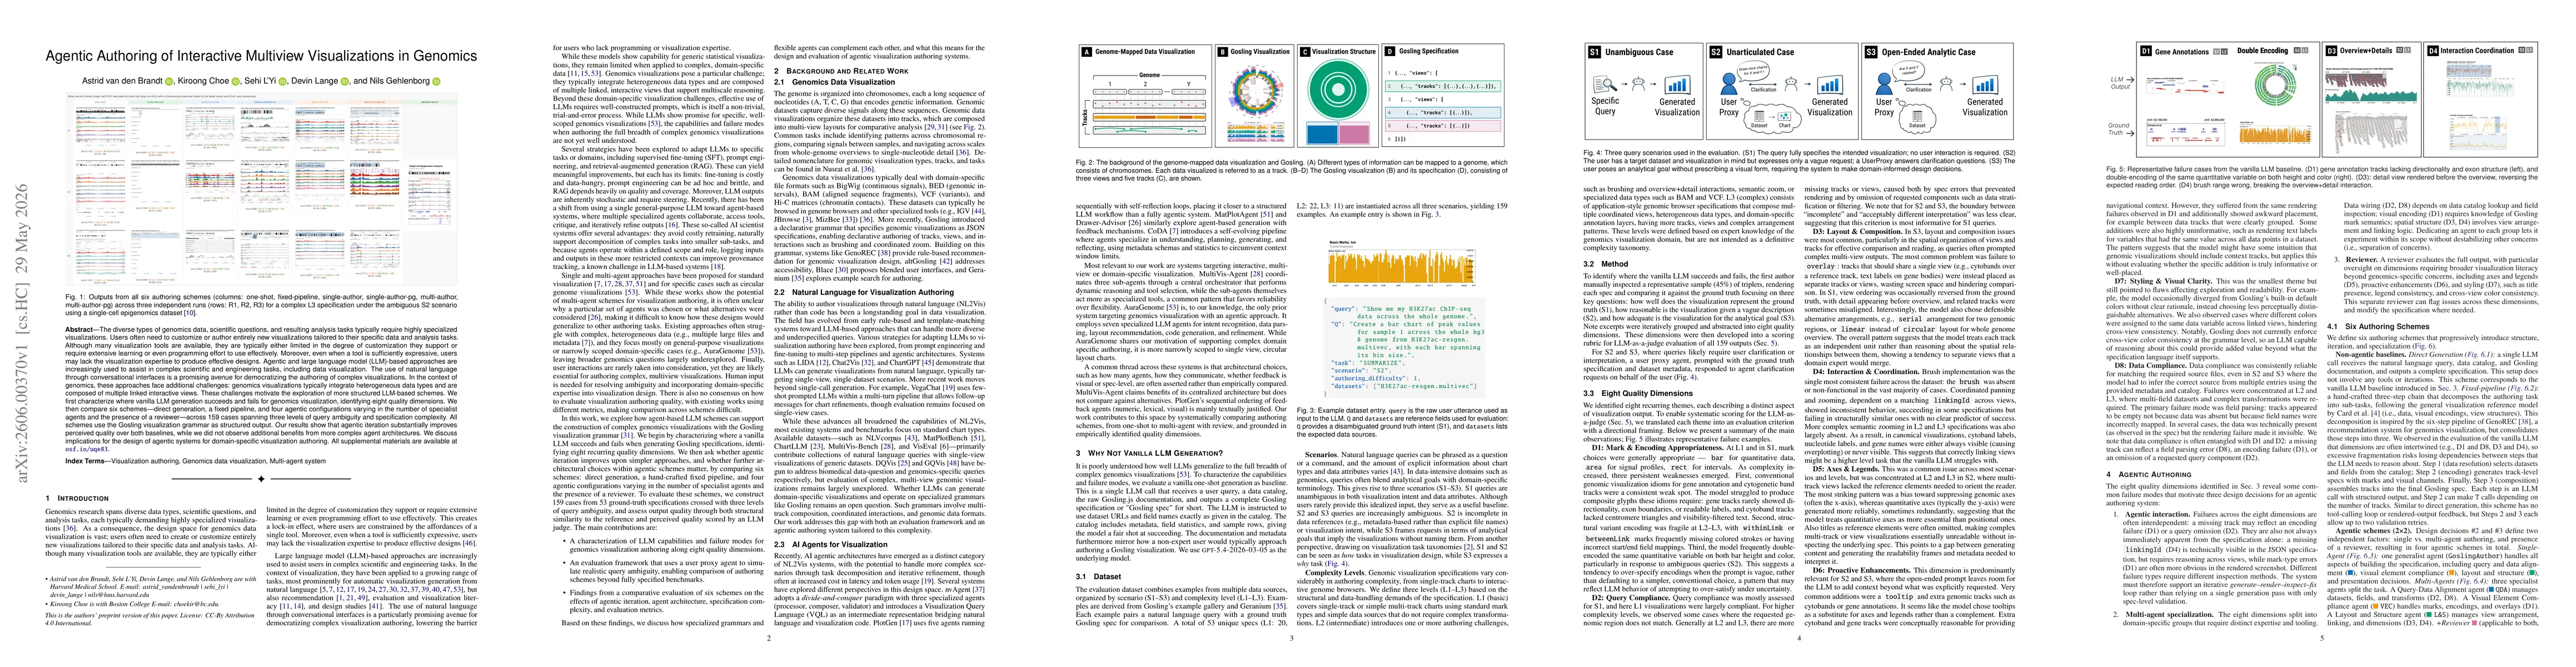
Incorporating natural language input has the potential to improve the capabilities of biomedical data discovery interfaces. However, user interface elements and visualizations are still powerful tools...
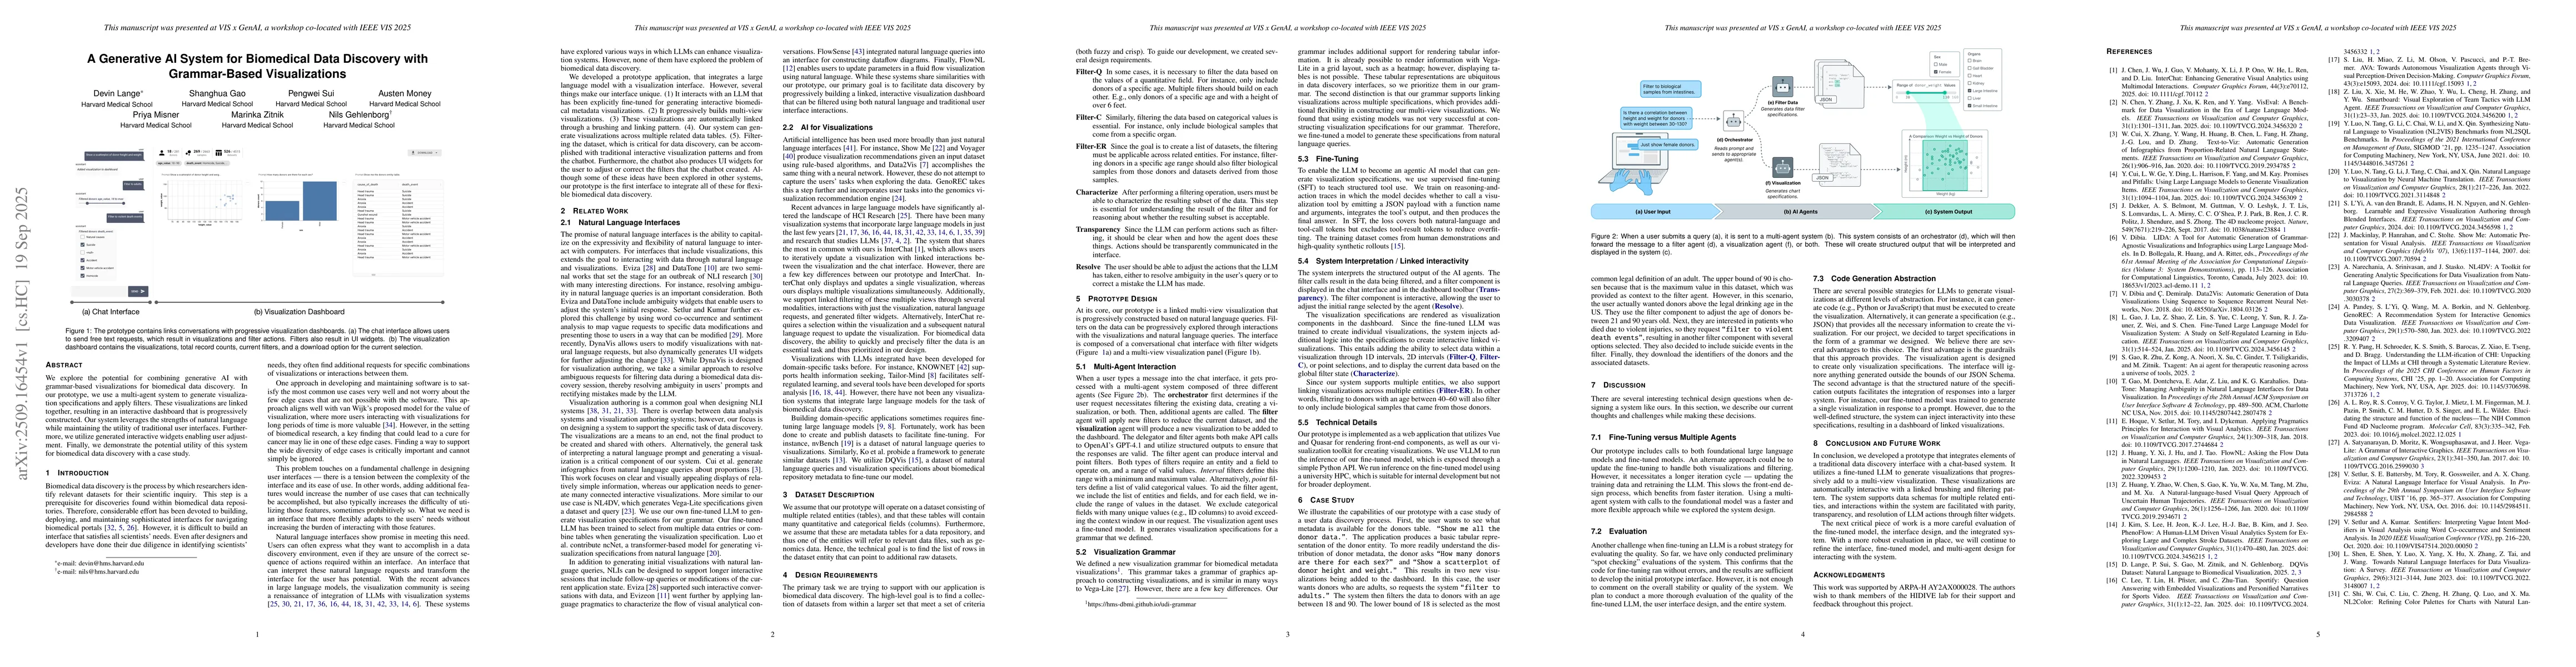
We explore the potential for combining generative AI with grammar-based visualizations for biomedical data discovery. In our prototype, we use a multi-agent system to generate visualization specificat...
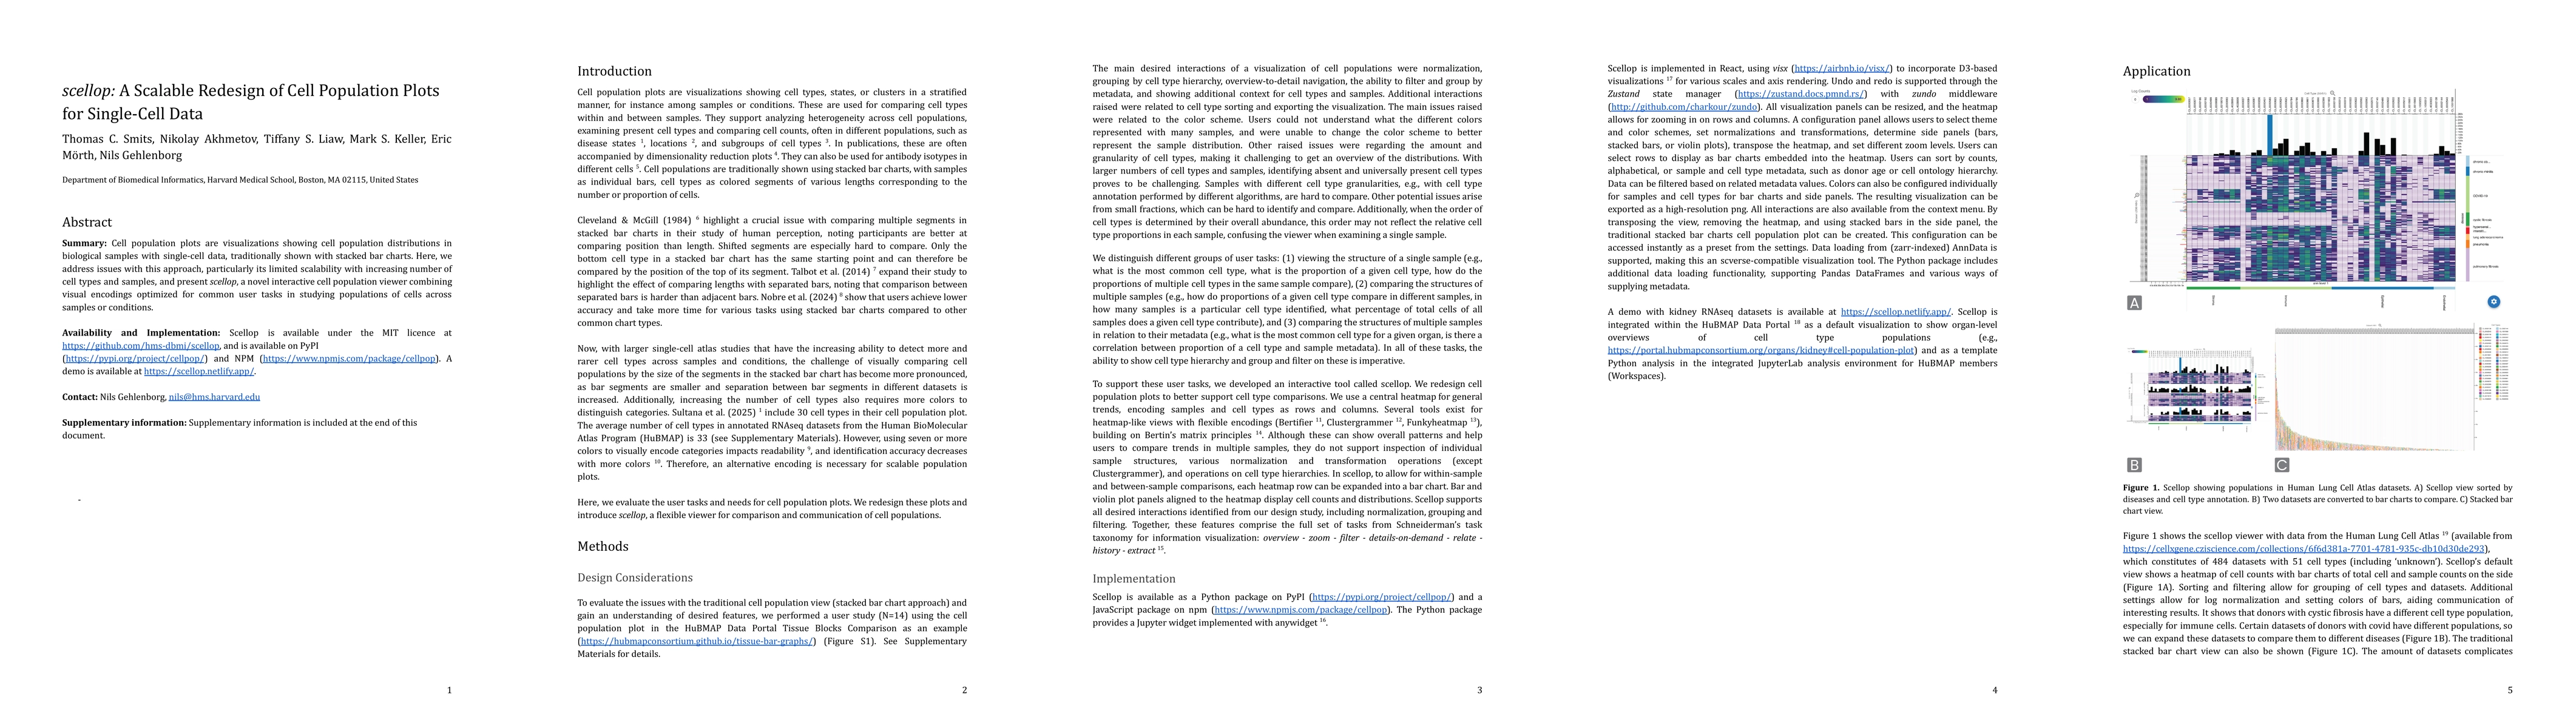
Summary: Cell population plots are visualizations showing cell population distributions in biological samples with single-cell data, traditionally shown with stacked bar charts. Here, we address issue...
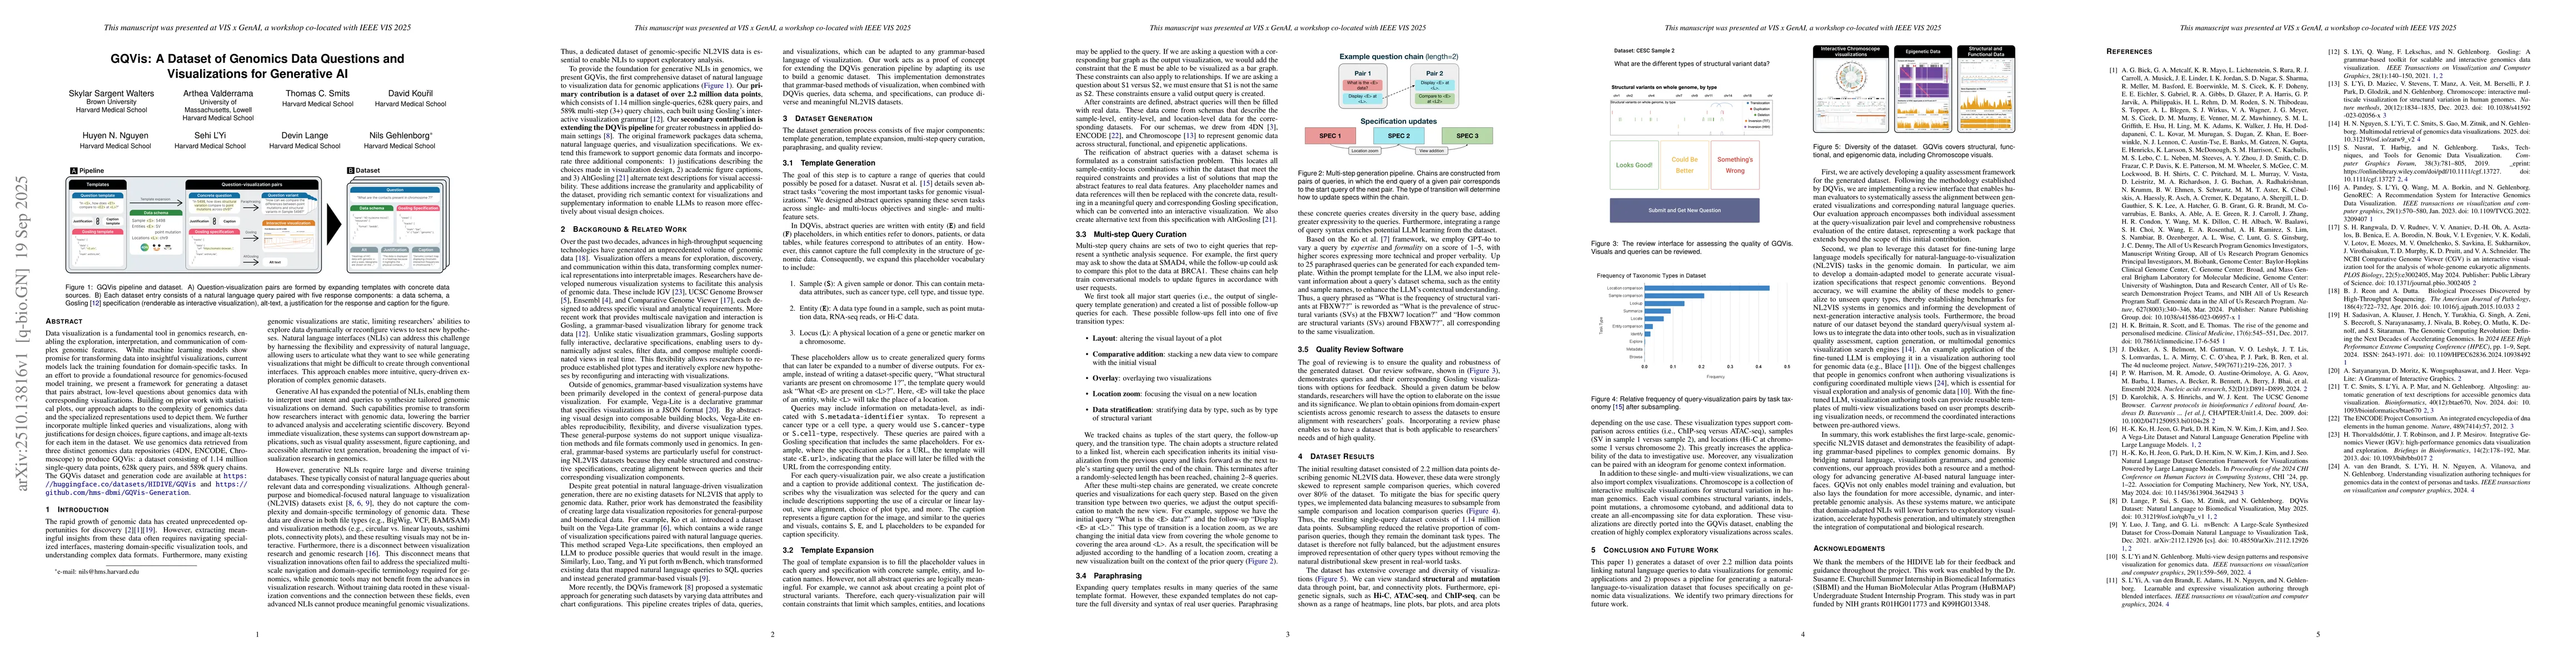
Data visualization is a fundamental tool in genomics research, enabling the exploration, interpretation, and communication of complex genomic features. While machine learning models show promise for t...
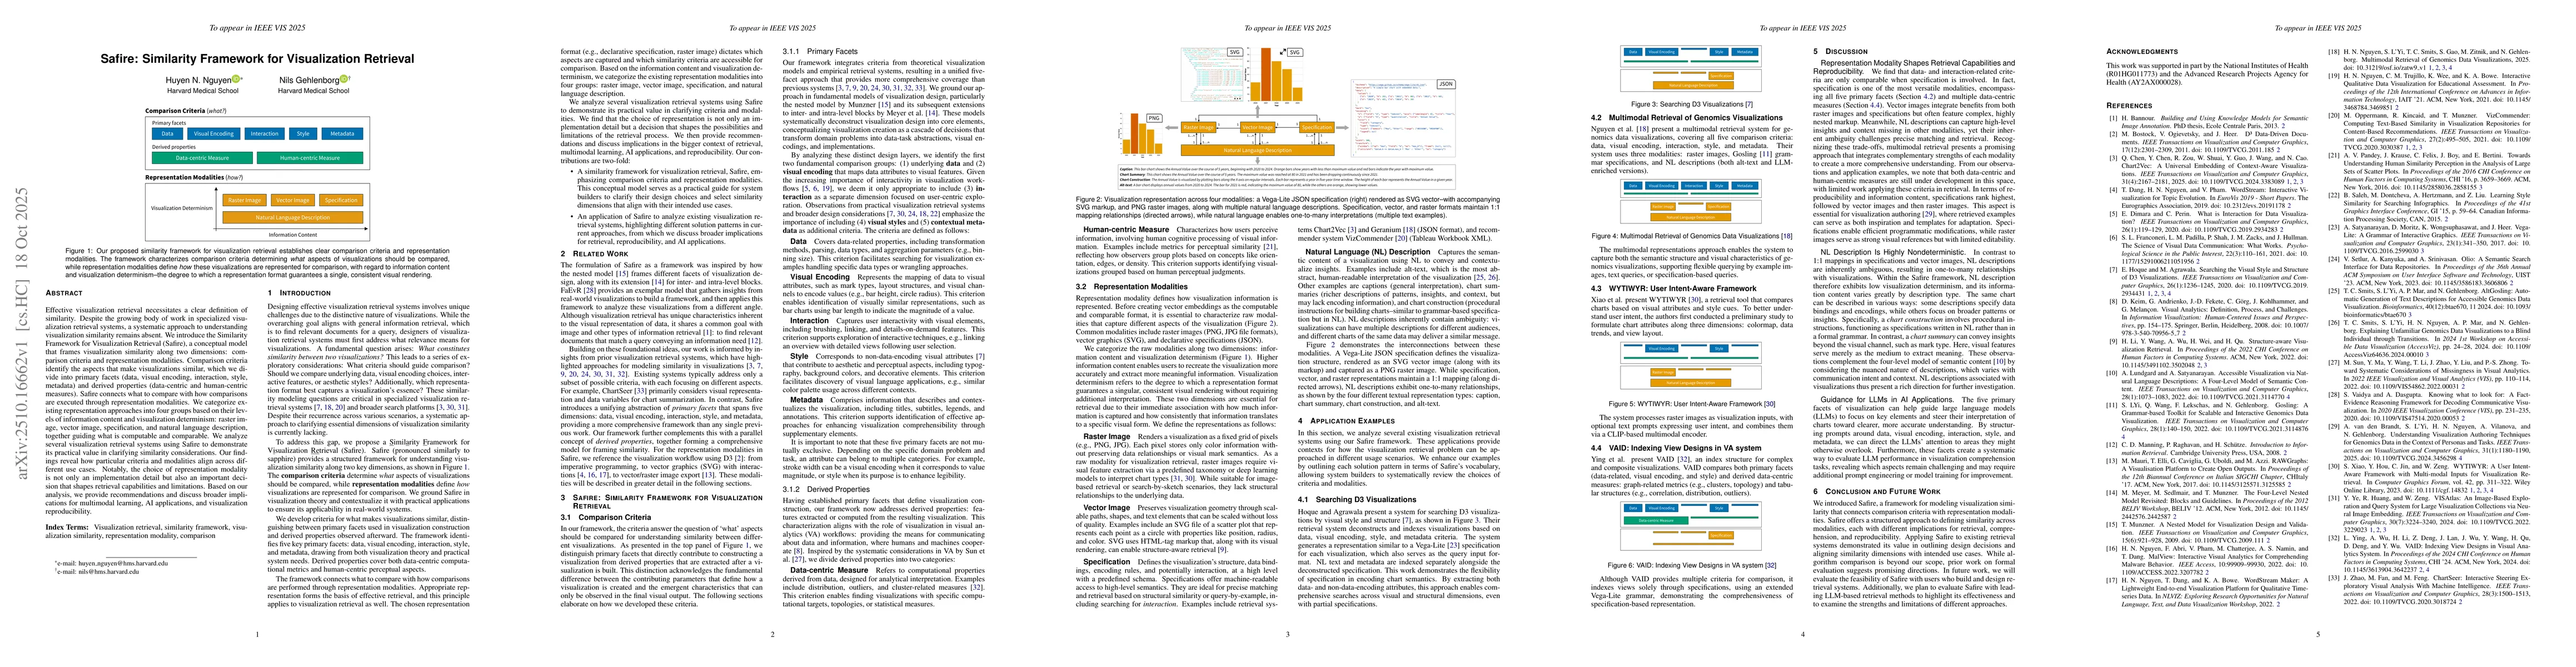
Effective visualization retrieval necessitates a clear definition of similarity. Despite the growing body of work in specialized visualization retrieval systems, a systematic approach to understanding...
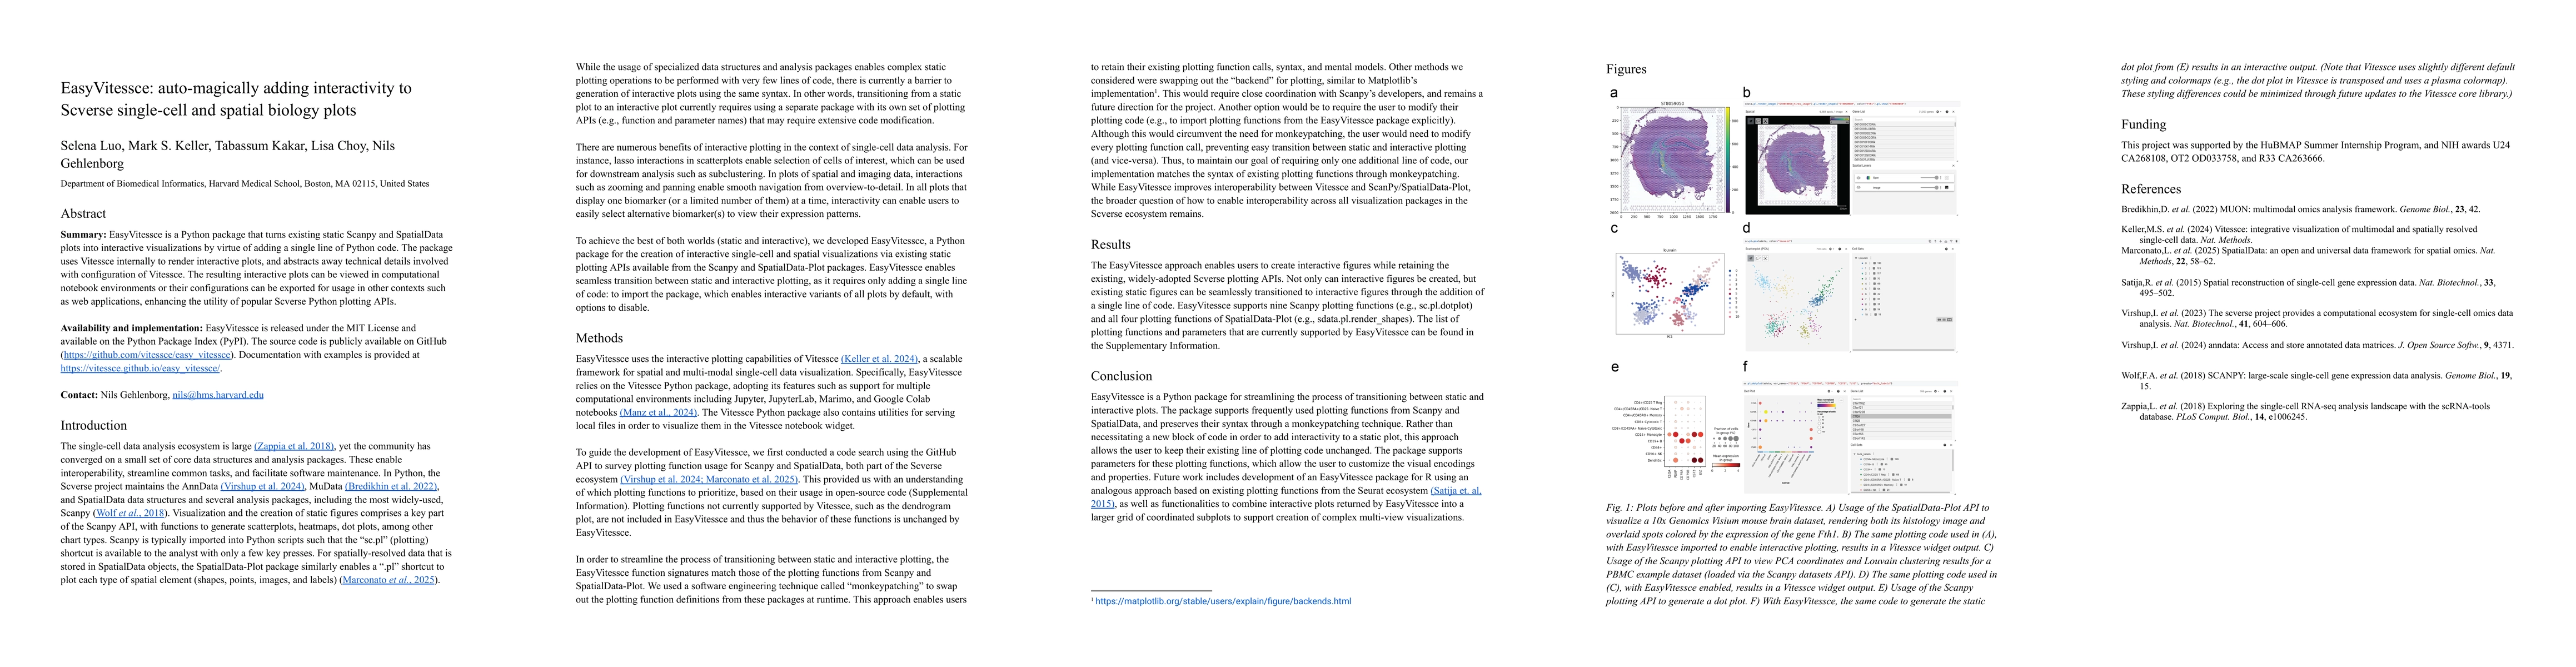
EasyVitessce is a Python package that turns existing static Scanpy and SpatialData plots into interactive visualizations by virtue of adding a single line of Python code. The package uses Vitessce int...
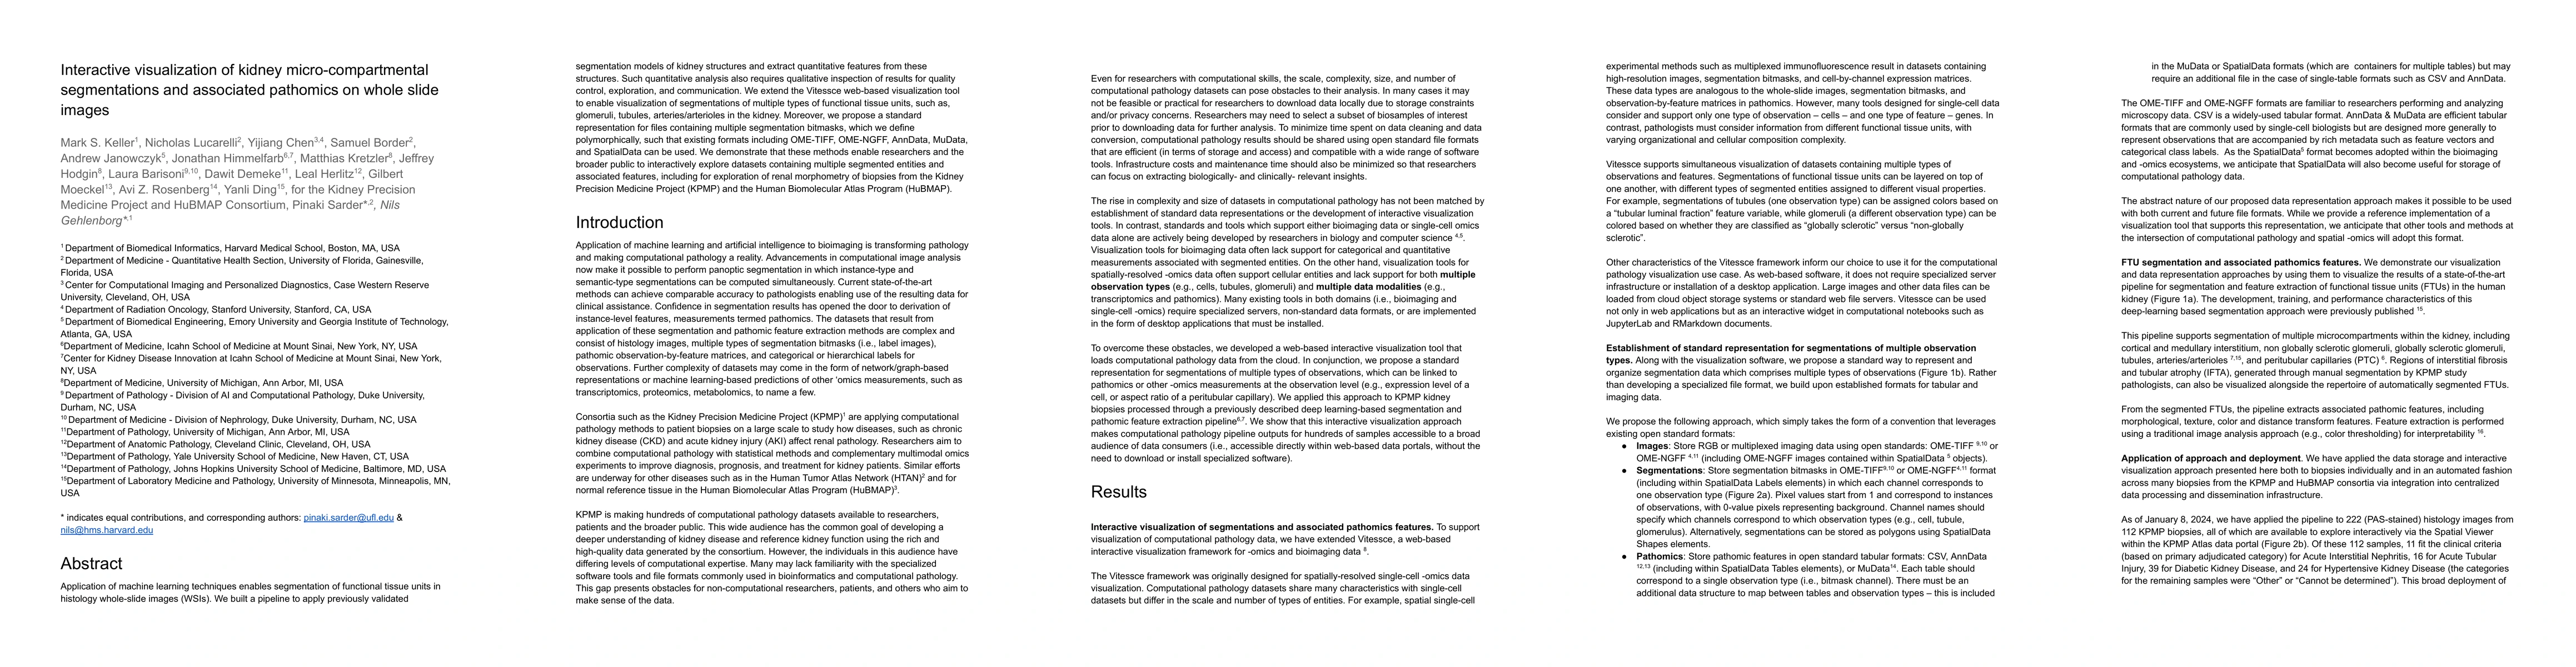
Application of machine learning techniques enables segmentation of functional tissue units in histology whole-slide images (WSIs). We built a pipeline to apply previously validated segmentation models...
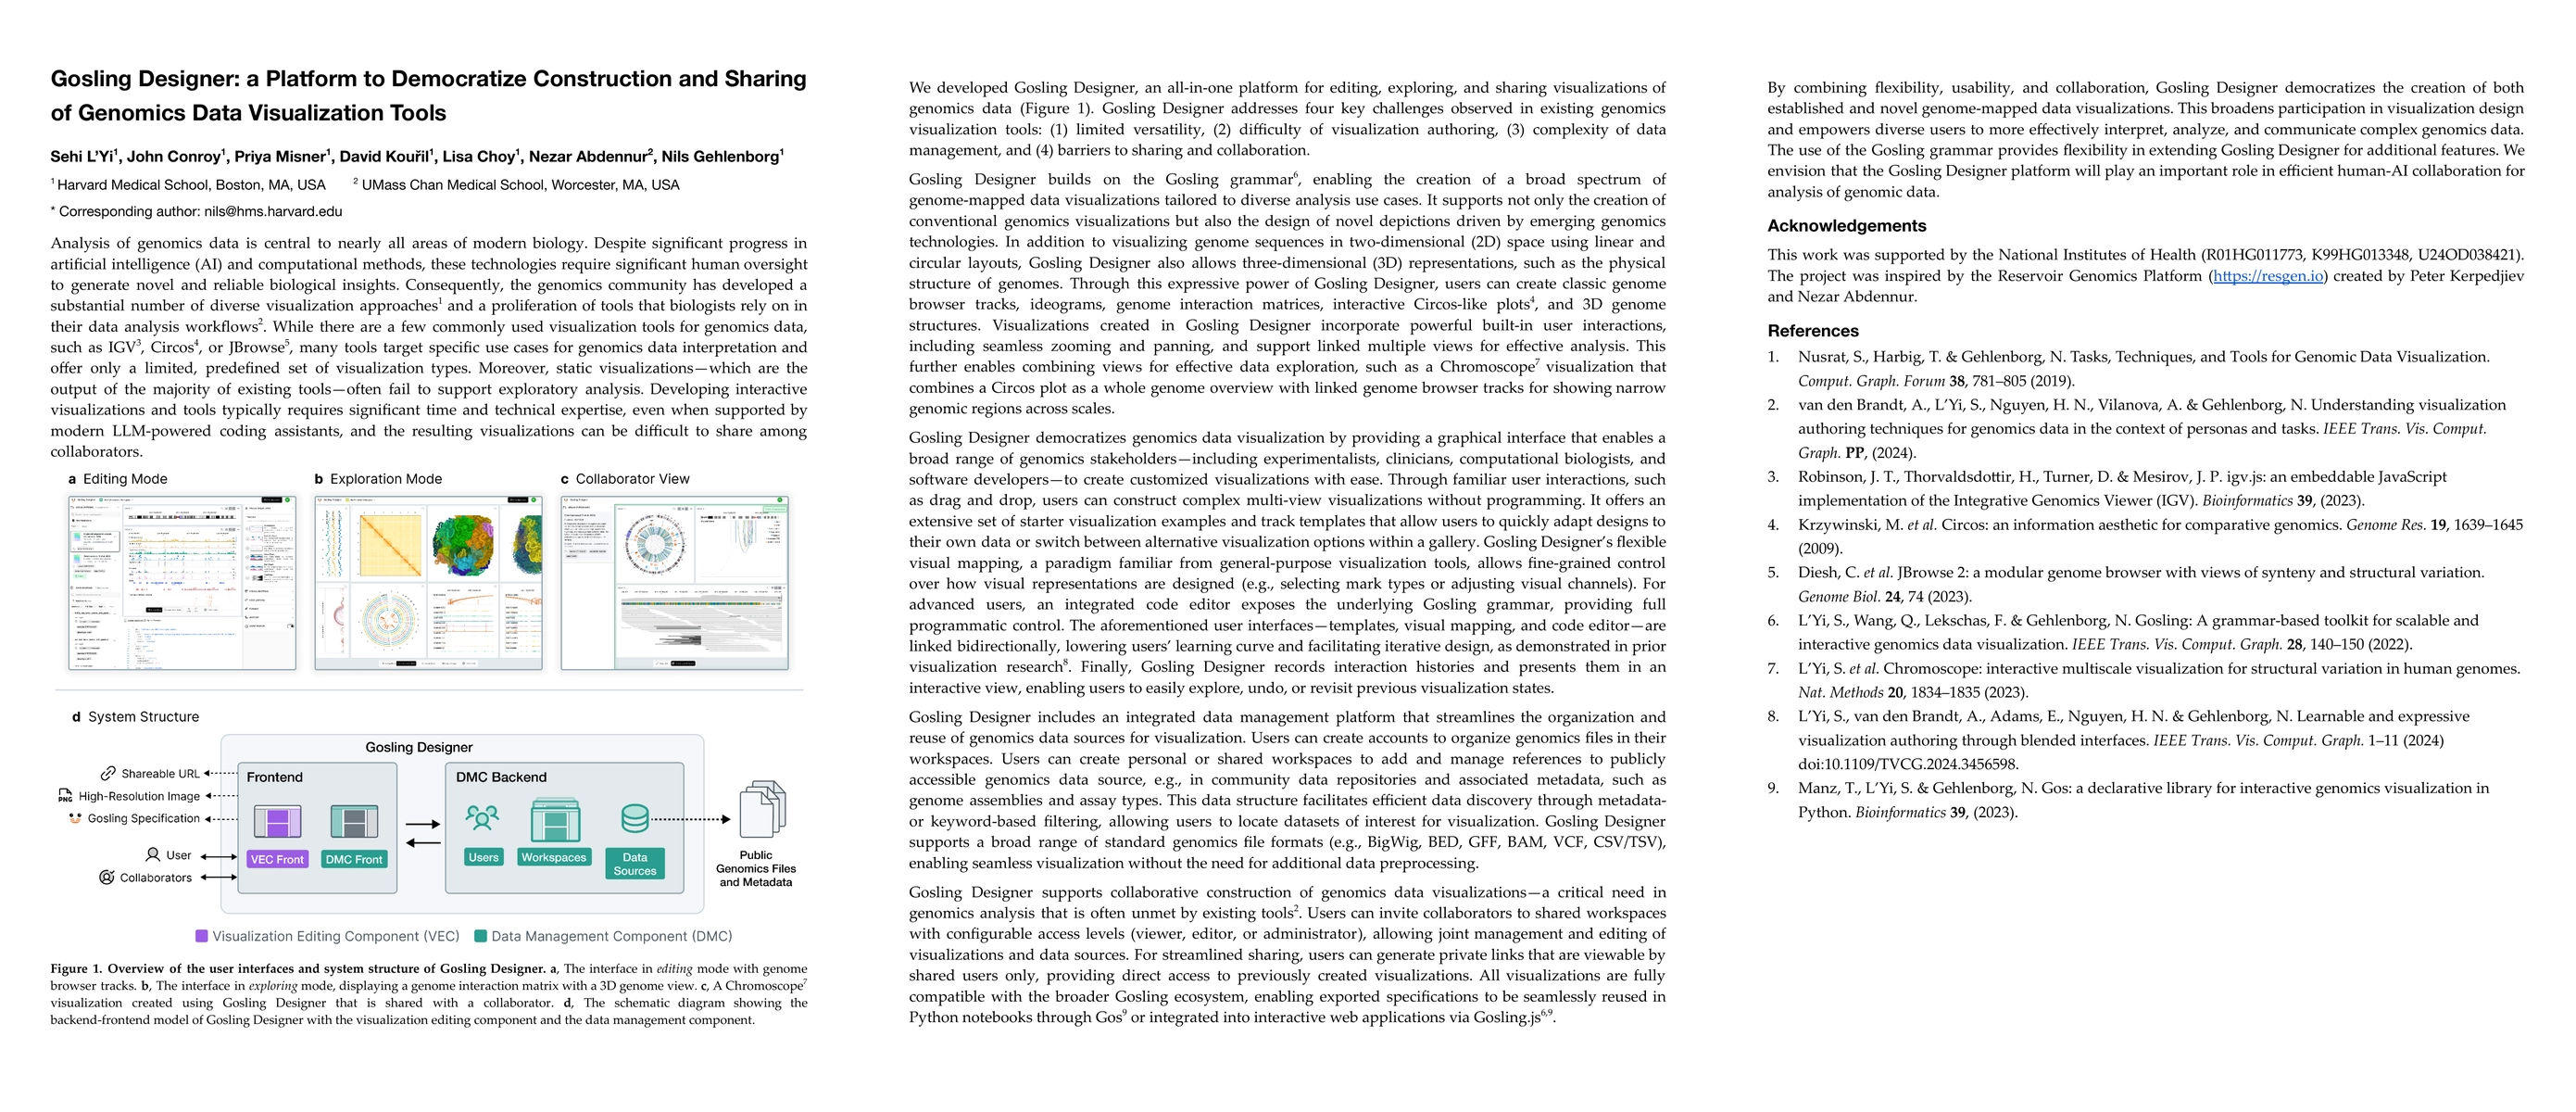
Analysis of genomics data is central to nearly all areas of modern biology. Despite significant progress in artificial intelligence (AI) and computational methods, these technologies require significa...
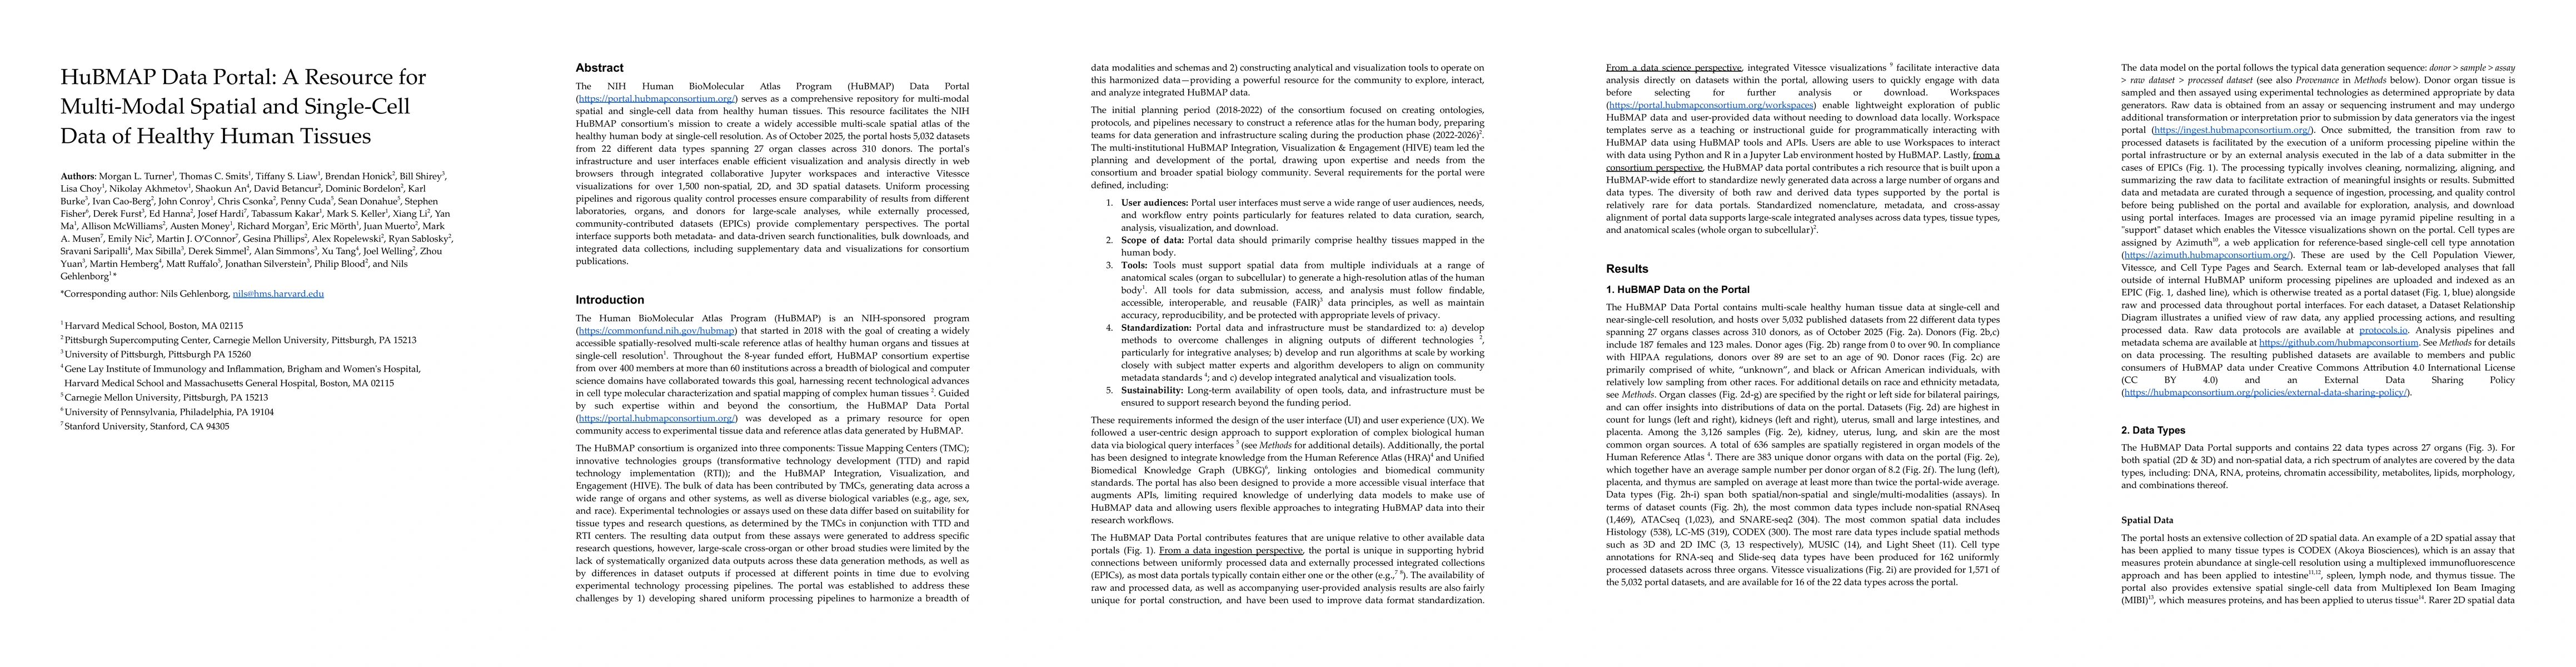
The NIH Human BioMolecular Atlas Program (HuBMAP) Data Portal (https://portal.hubmapconsortium.org/) serves as a comprehensive repository for multi-modal spatial and single-cell data from healthy huma...
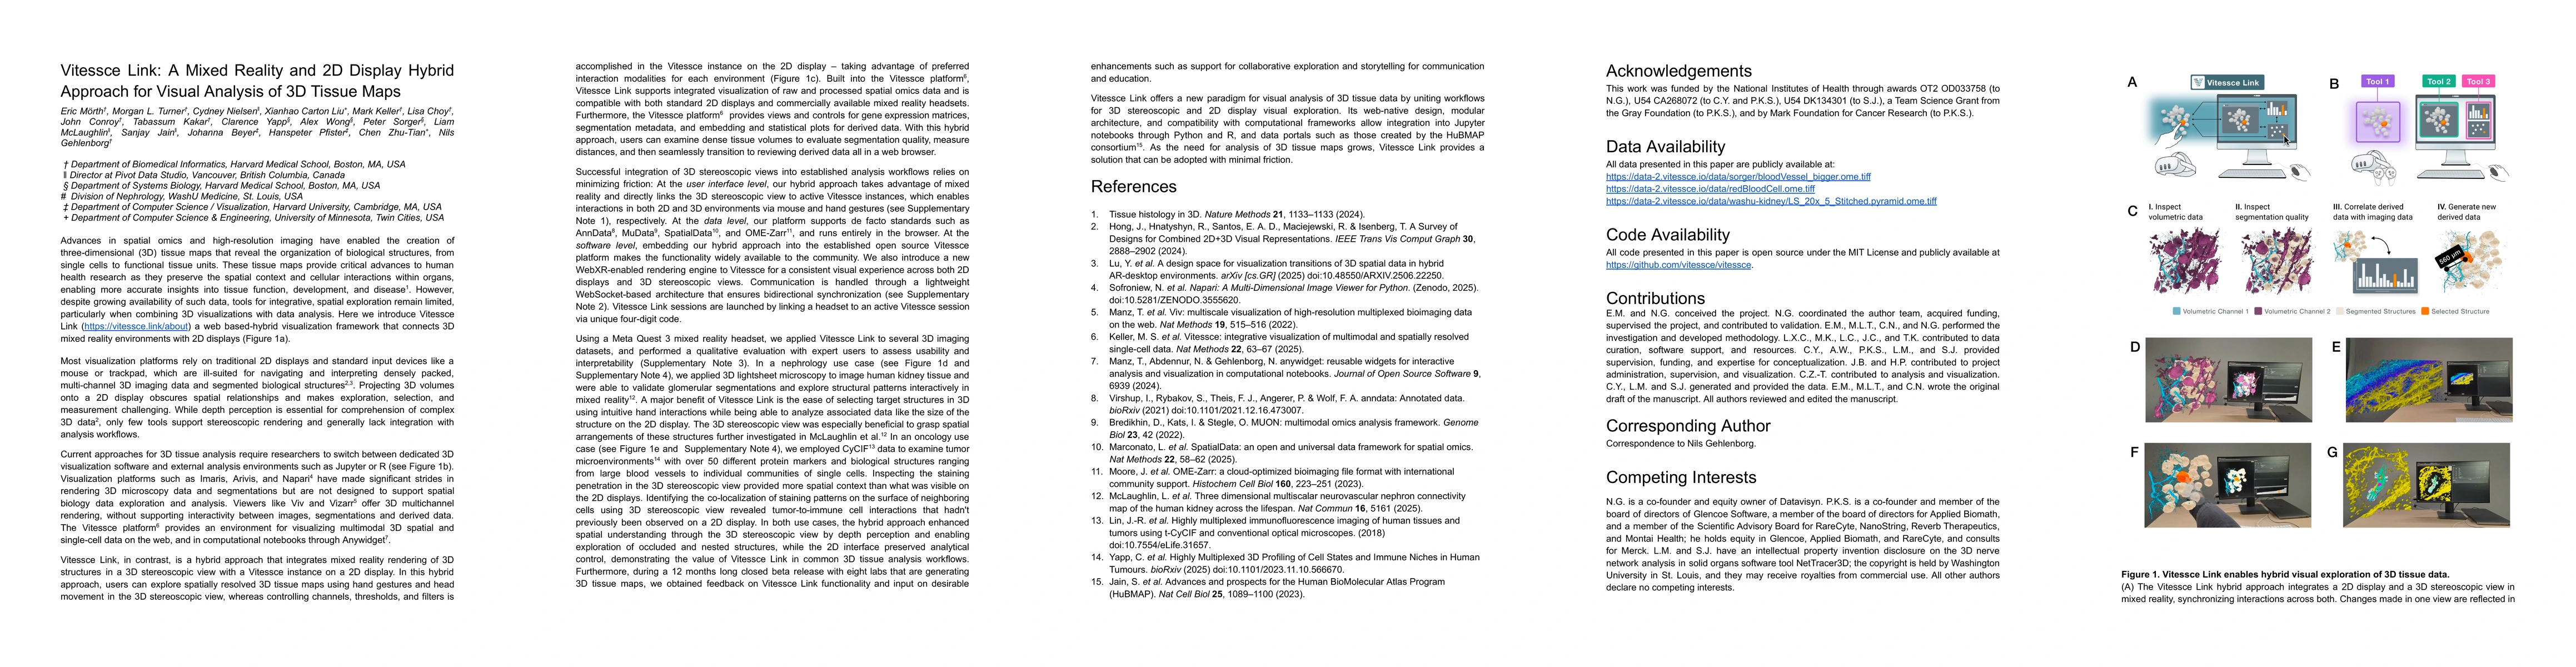
Advances in spatial omics and high-resolution imaging enable the creation of three-dimensional (3D) tissue maps that capture cellular organization and interactions in situ. While these data provide cr...
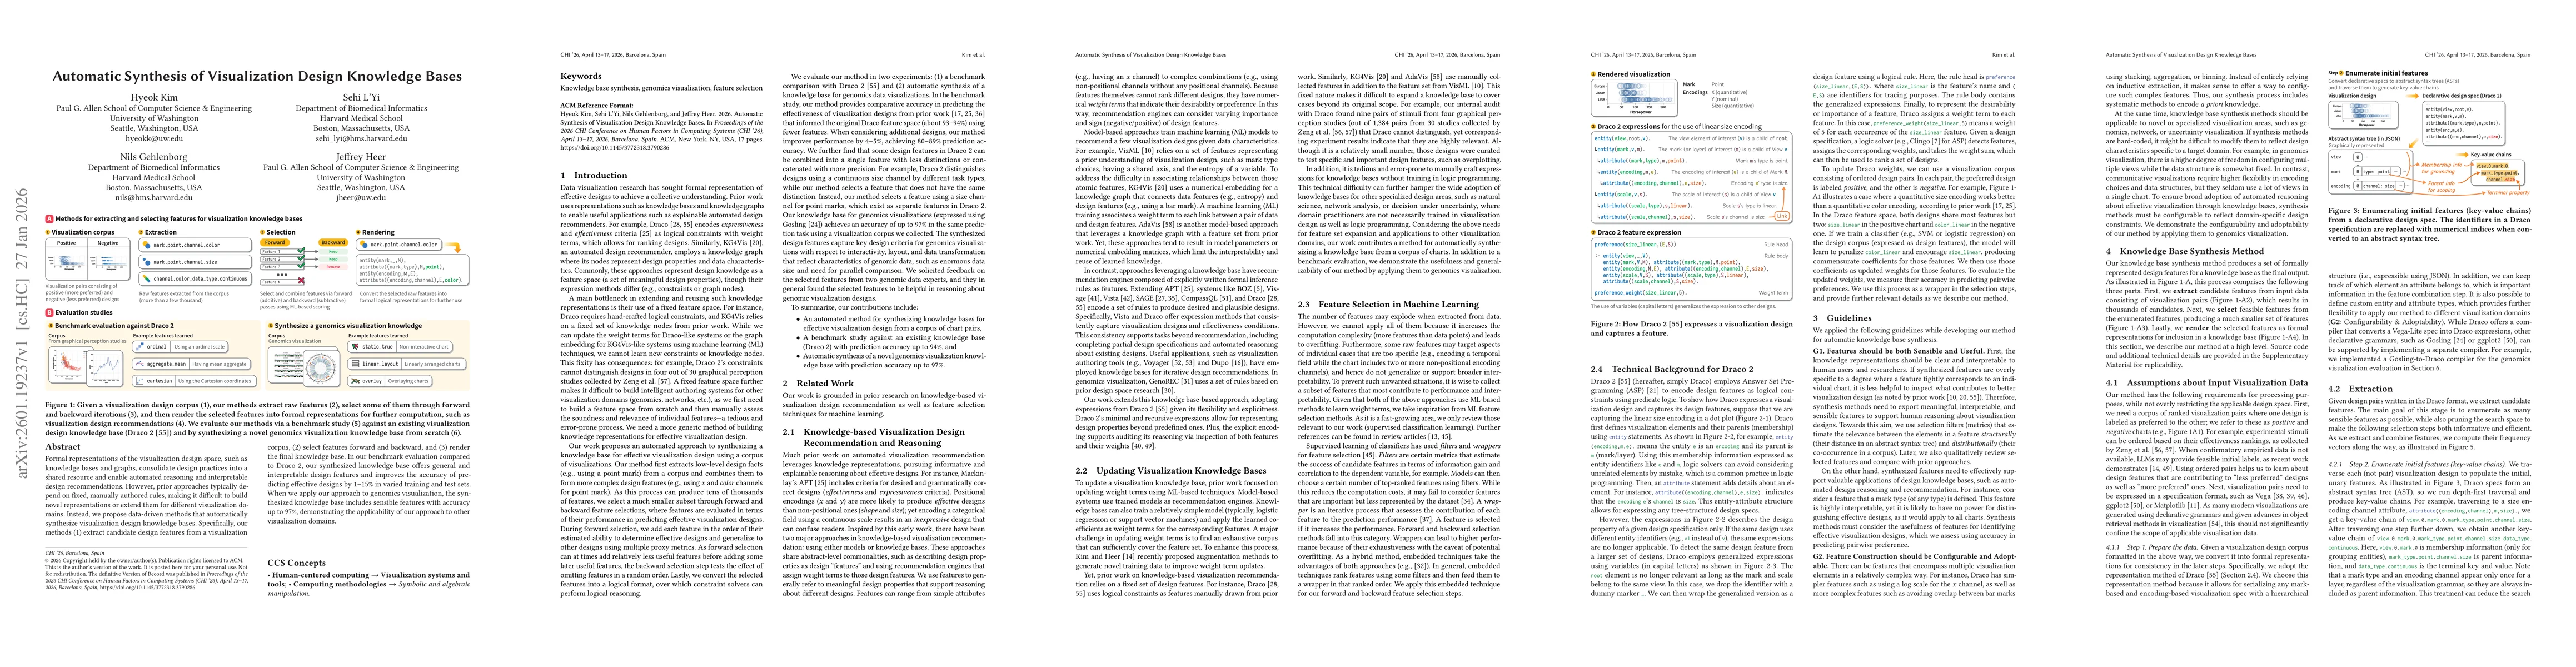
Formal representations of the visualization design space, such as knowledge bases and graphs, consolidate design practices into a shared resource and enable automated reasoning and interpretable desig...
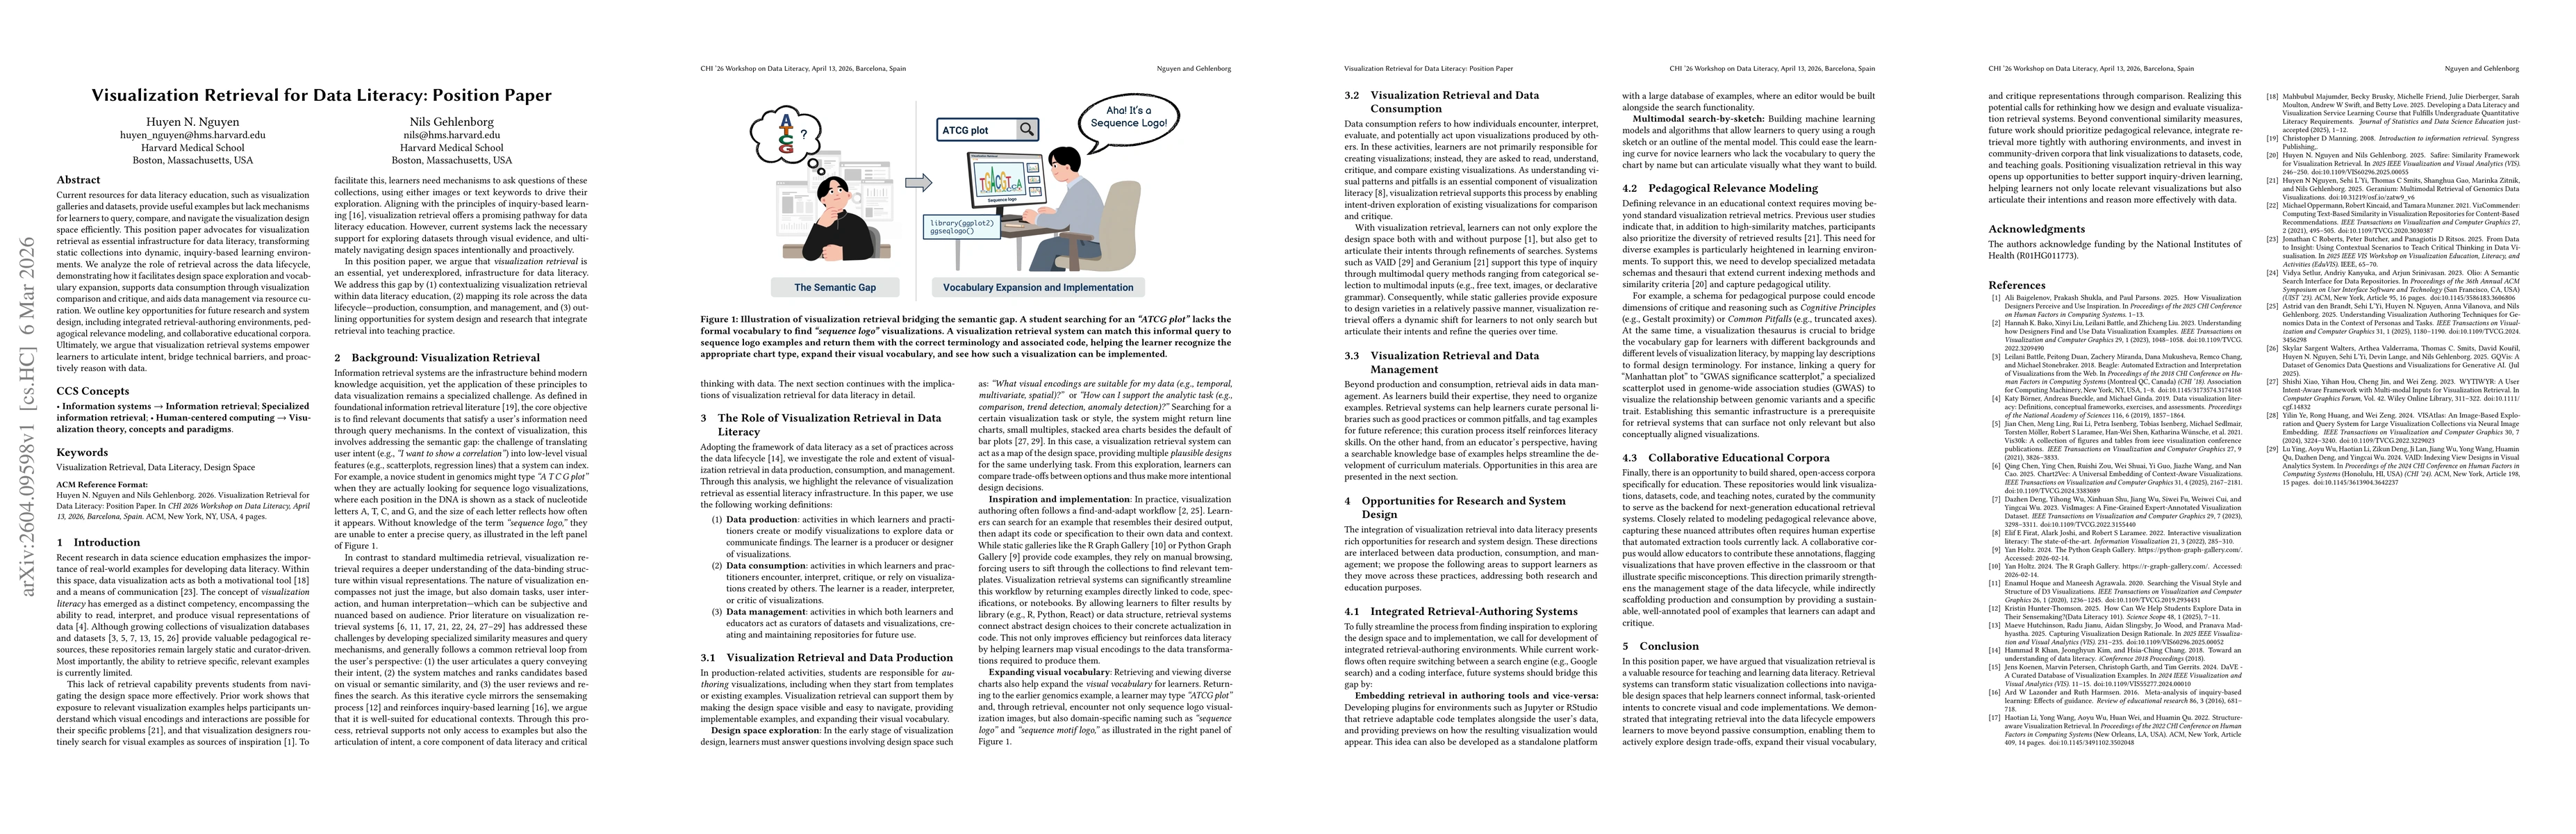
Current resources for data literacy education, such as visualization galleries and datasets, provide useful examples but lack mechanisms for learners to query, compare, and navigate the visualization ...
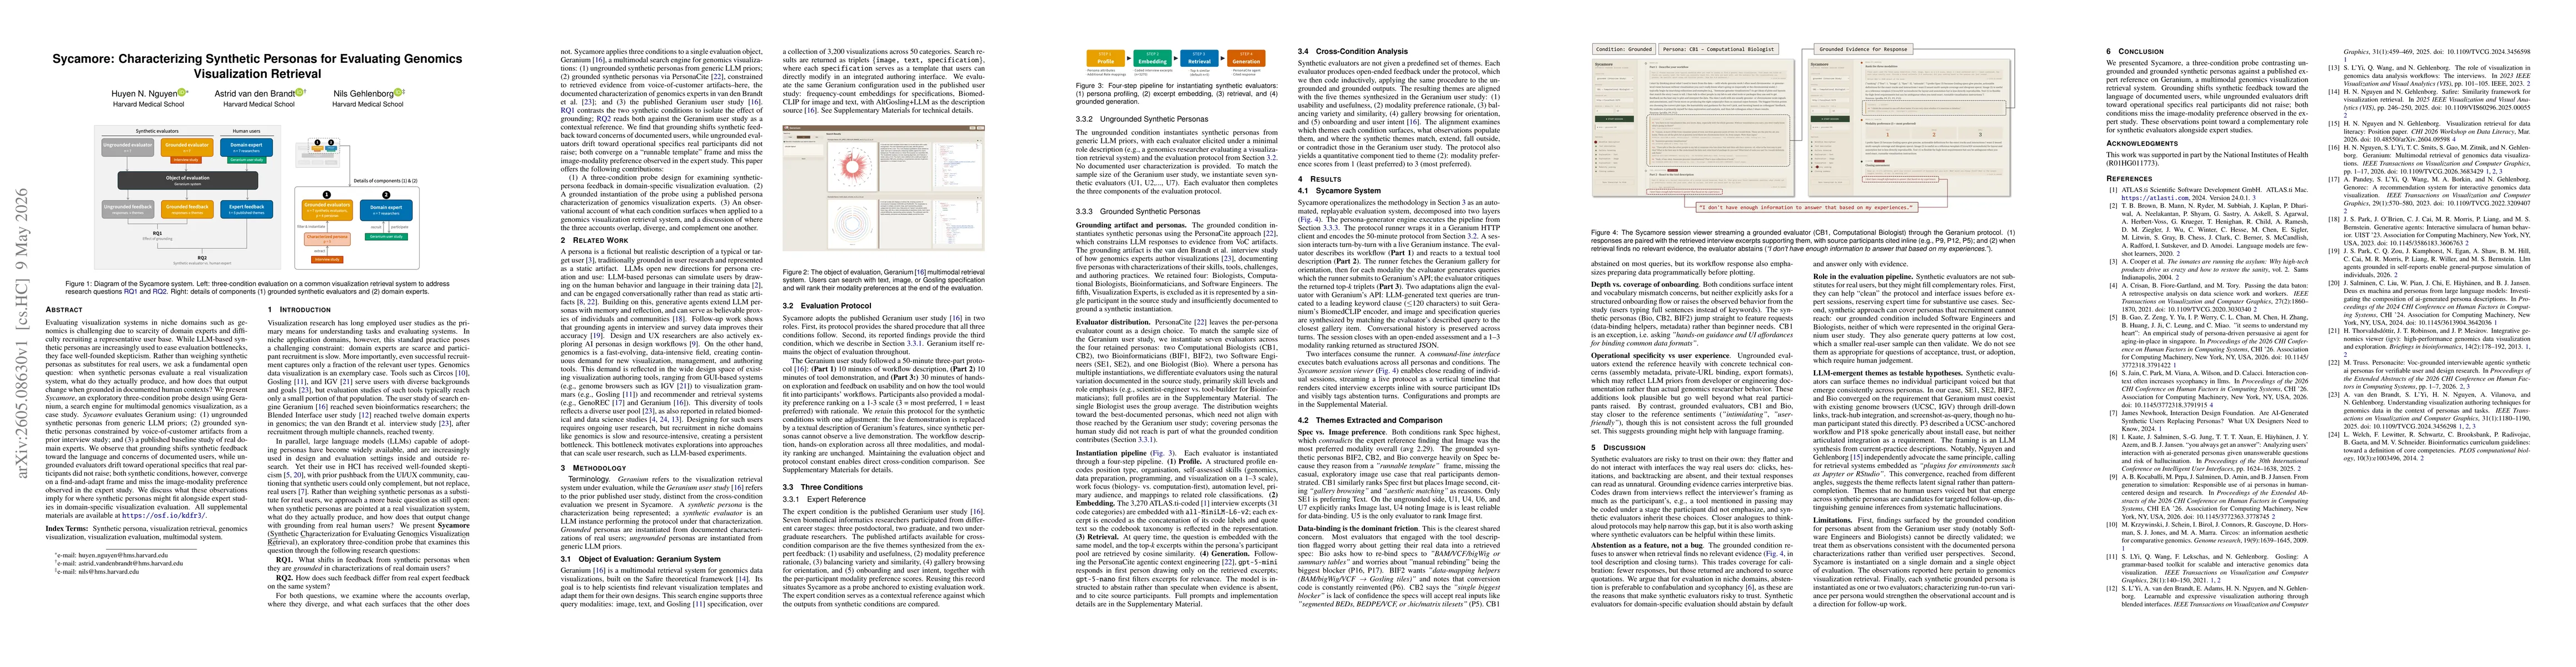
Evaluating visualization systems in niche domains such as genomics is challenging due to scarcity of domain experts and difficulty recruiting a representative user base. While LLM-based synthetic pers...
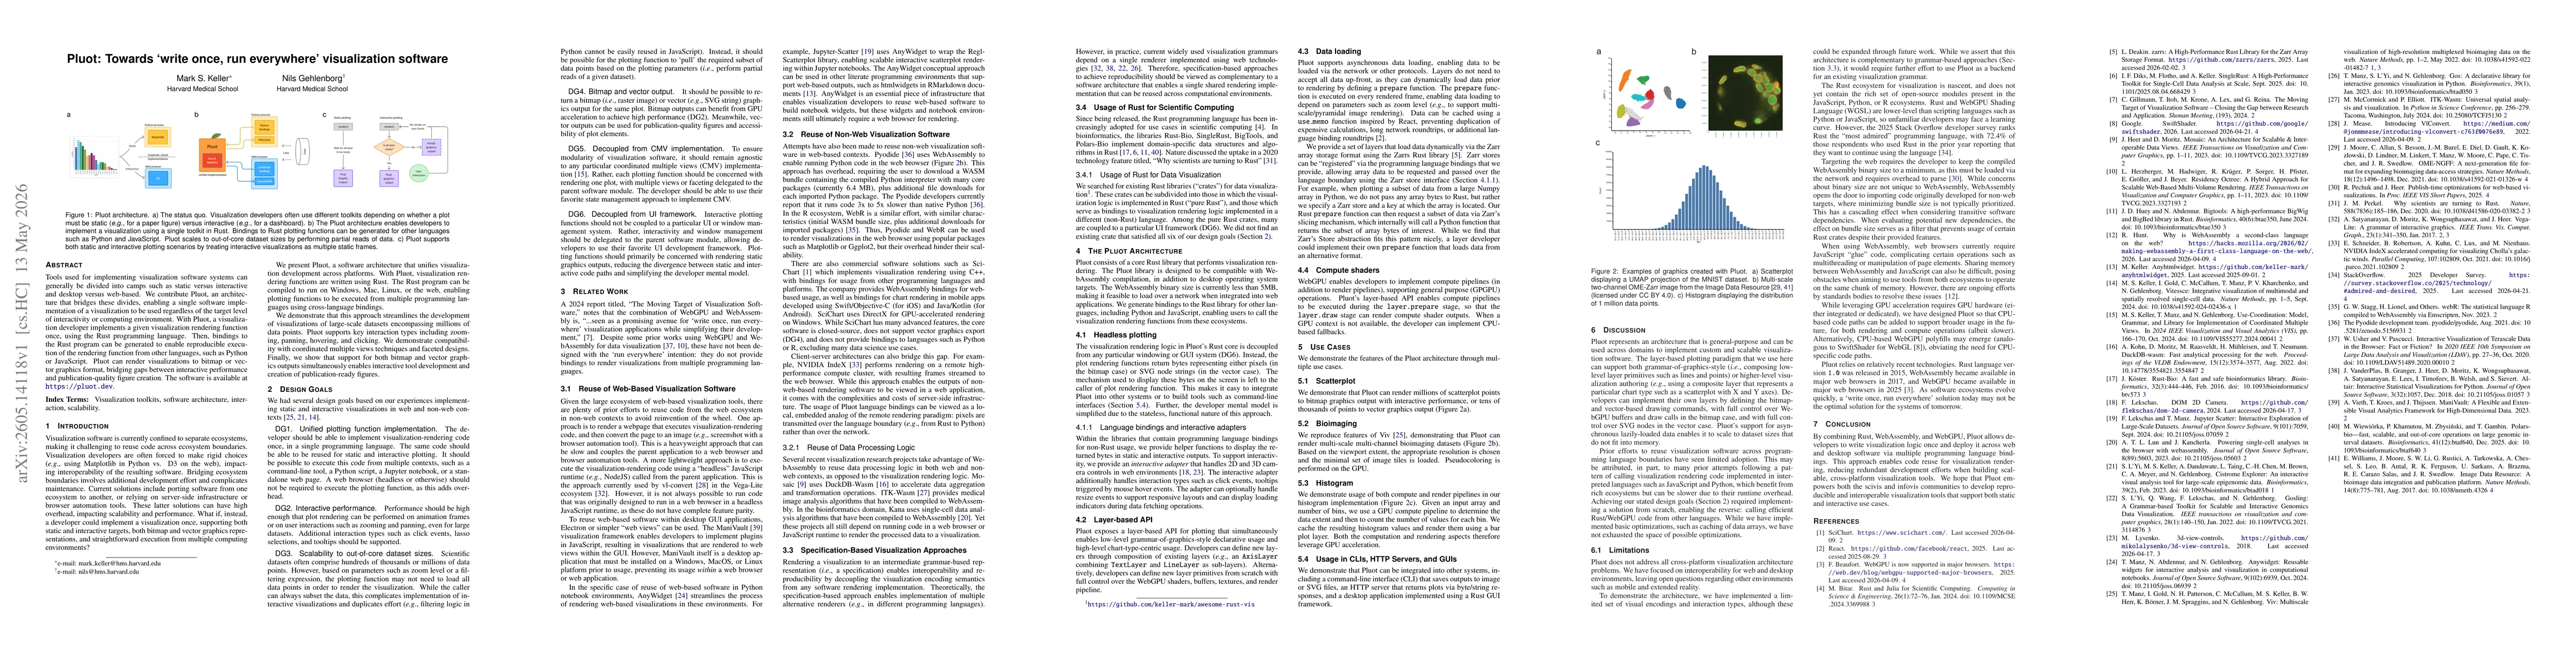
Tools used for implementing visualization software systems can generally be divided into camps such as static versus interactive and desktop versus web-based. We contribute Pluot, an architecture that...
Diverse genomics data, scientific questions, and analysis tasks typically demand highly specialized visualizations. Therefore, users often must customize or author new ones tailored to their data. Exi...