ArxivLens

Publication

Published: Oct 28, 2025
Categories: q-bio.GN

Metrics

Source: ArXiv

Quick Answers

What methodology did the authors use?

The research presents Gosling Designer as an all-in-one platform for genomics data visualization, addressing limitations in existing tools through a combination of user interface design, data management, and collaborative features. More in Methodology →

What are the key results?

Gosling Designer enables the creation of diverse genomics visualizations including 2D, 3D, and interactive plots. — The platform supports collaborative visualization construction with shared workspaces and private links. More in Key Results →

Why is this work significant?

This research is important as it democratizes genomics data visualization, allowing a broader range of stakeholders to create and share visualizations effectively, thereby enhancing data analysis and collaboration in genomics research. More in Significance →

What are the main limitations?

The platform's effectiveness may depend on the availability of standard genomics file formats. — Potential learning curve for users unfamiliar with visualization authoring techniques. More in Limitations →

Paper Preview

Abstract

Analysis of genomics data is central to nearly all areas of modern biology. Despite significant progress in artificial intelligence (AI) and computational methods, these technologies require significant human oversight to generate novel and reliable biological insights. Consequently, the genomics community has developed a substantial number of diverse visualization approaches and a proliferation of tools that biologists rely on in their data analysis workflows. While there are a few commonly used visualization tools for genomics data, many tools target specific use cases for genomics data interpretation and offer only a limited, predefined set of visualization types. Moreover, static visualizations often fail to support exploratory analysis. Developing interactive visualizations and tools typically requires significant time and technical expertise, even when supported by modern LLM-powered coding assistants, and the resulting visualizations can be difficult to share among 
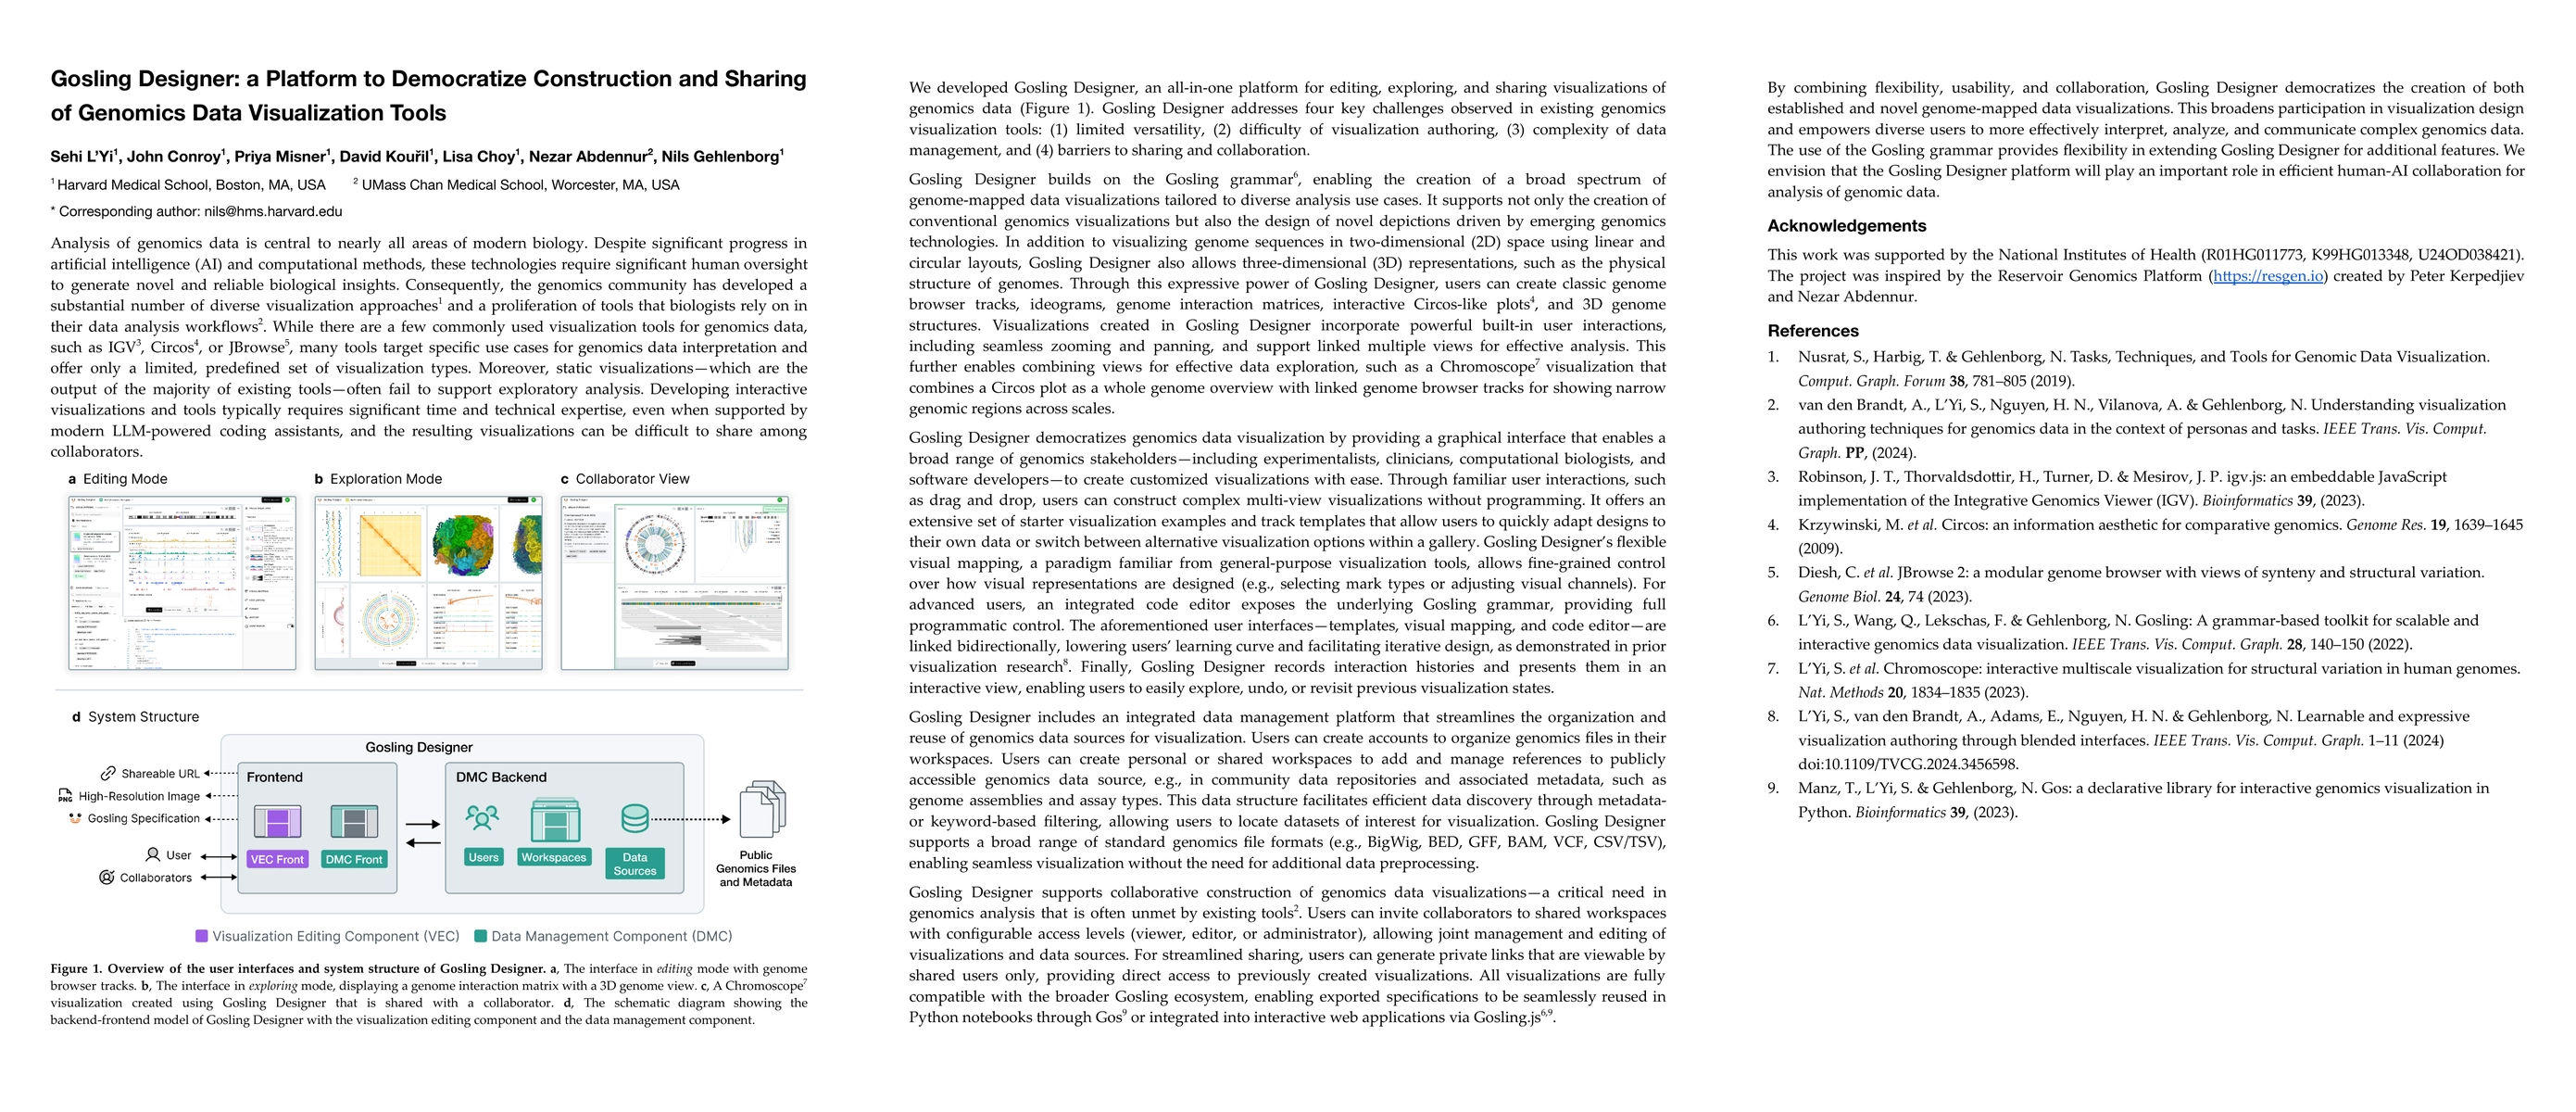
collaborators. We developed Gosling Designer, an all-in-one platform for editing, exploring, and sharing visualizations of genomics data. Gosling Designer addresses four key challenges observed in existing genomics visualization tools: (1) limited versatility, (2) difficulty of visualization authoring, (3) complexity of data management, and (4) barriers to sharing and collaboration.

Key Findings, in focus

Seven facets of this paper, analysed and brought into focus by AI.

AI-generated · verify against source Generated Nov 09, 2025
In focus · one-line synthesis

This research is important as it democratizes genomics data visualization, allowing a broader range of stakeholders to create and share visualizations effectively, thereby enhancing data analysis and collaboration in genomics research.

01
MethodologyHow they did it

The research presents Gosling Designer as an all-in-one platform for genomics data visualization, addressing limitations in existing tools through a combination of user interface design, data management, and collaborative features.

02
ResultsWhat they found
  • Gosling Designer enables the creation of diverse genomics visualizations including 2D, 3D, and interactive plots.
  • The platform supports collaborative visualization construction with shared workspaces and private links.
  • It provides a flexible and user-friendly interface for both novice and advanced users through graphical tools and code editors.
03
SignificanceWhy it matters

This research is important as it democratizes genomics data visualization, allowing a broader range of stakeholders to create and share visualizations effectively, thereby enhancing data analysis and collaboration in genomics research.

04
Technical ContributionsWhat's new technically

Gosling Designer introduces a comprehensive platform leveraging the Gosling grammar to enable flexible, interactive, and collaborative genomics data visualization.

05
NoveltyWhat sets it apart

The novelty lies in combining a graphical interface with a code editor, enabling both non-programmers and developers to create complex visualizations, along with integrated data management and collaboration features.

06
LimitationsWhat to be cautious about
  • The platform's effectiveness may depend on the availability of standard genomics file formats.
  • Potential learning curve for users unfamiliar with visualization authoring techniques.
07
Future WorkWhere it goes next
  • Integration with more genomics data repositories.
  • Enhancing AI-assisted visualization authoring capabilities.
  • Expanding support for additional genomics data formats and visualization types.

Paper Details

Paper ID: 2510.24888
Categories:
q-bio.GN

How to Cite This Paper

Reference manager: RIS EndNote

Related Papers

4 found


Discussion 0

This website uses cookies to ensure you get the best experience. Learn more