Academic Profile
Statistics
Similar Authors
Papers on arXiv
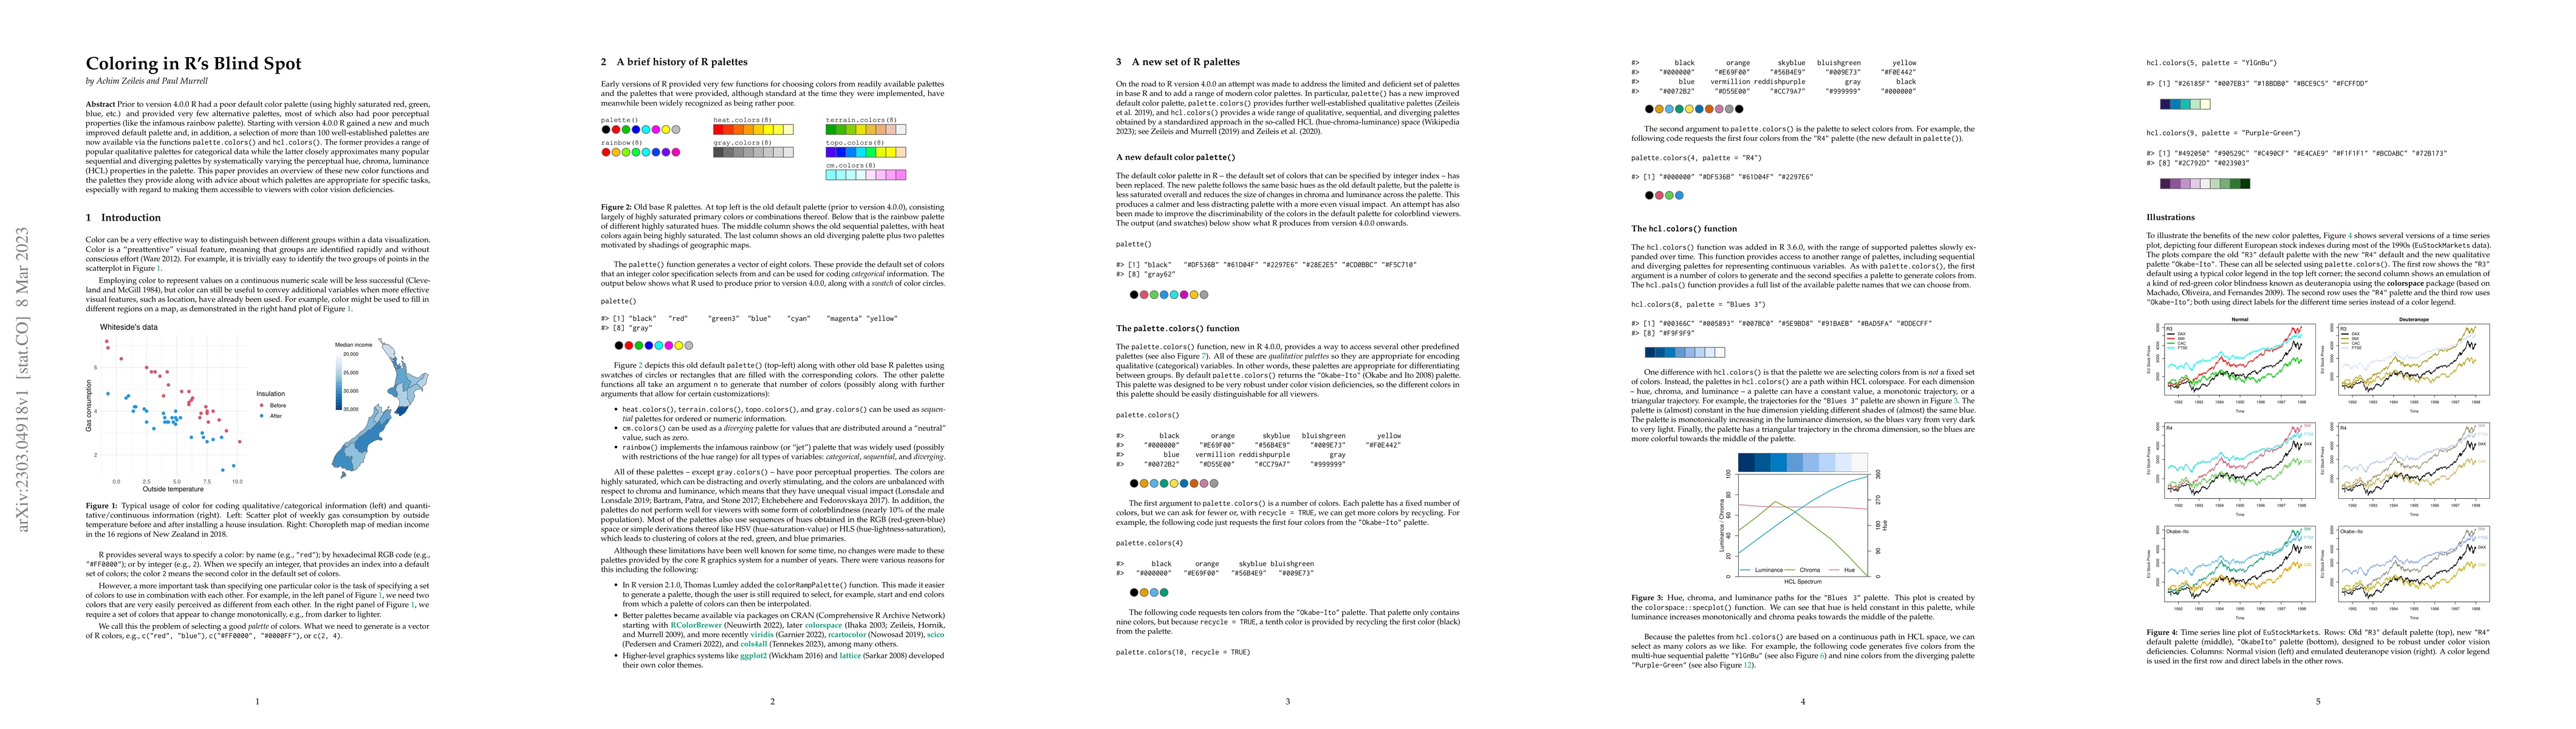
Prior to version 4.0.0 R had a poor default color palette (using highly saturated red, green, blue, etc.) and provided very few alternative palettes, most of which also had poor perceptual propertie...
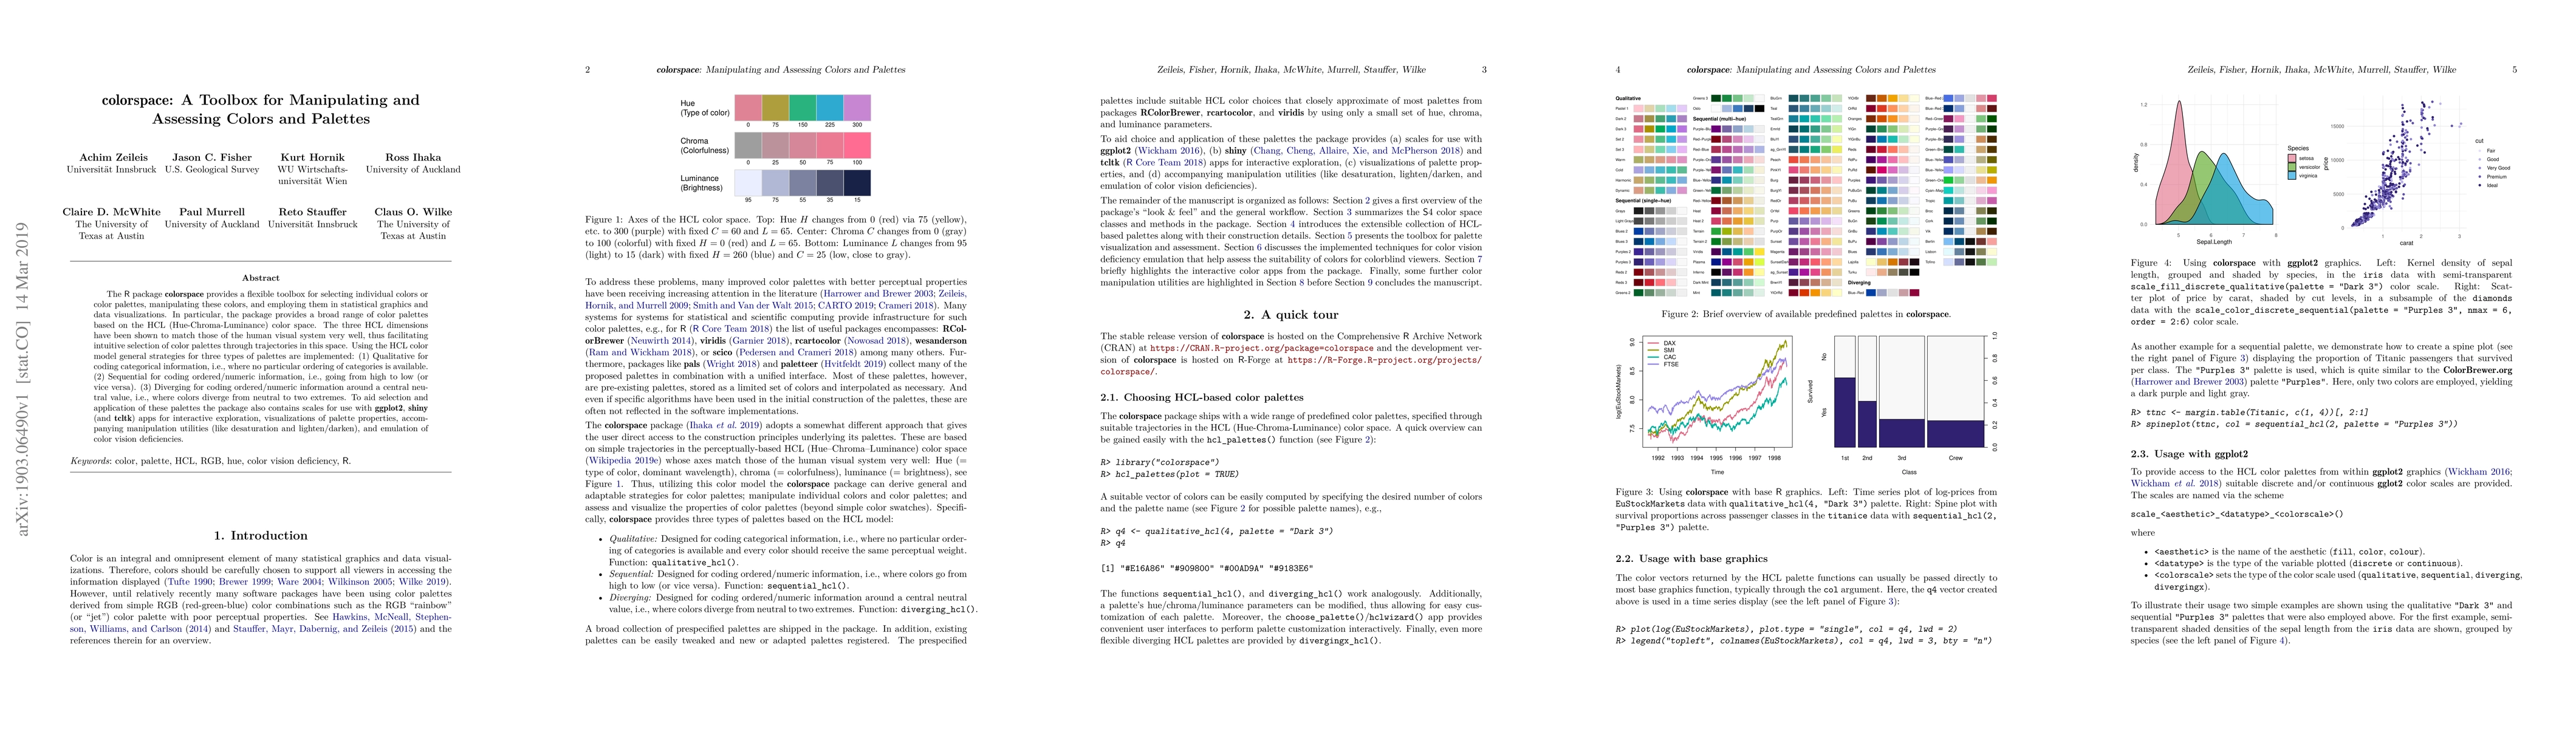
The R package colorspace provides a flexible toolbox for selecting individual colors or color palettes, manipulating these colors, and employing them in statistical graphics and data visualizations....
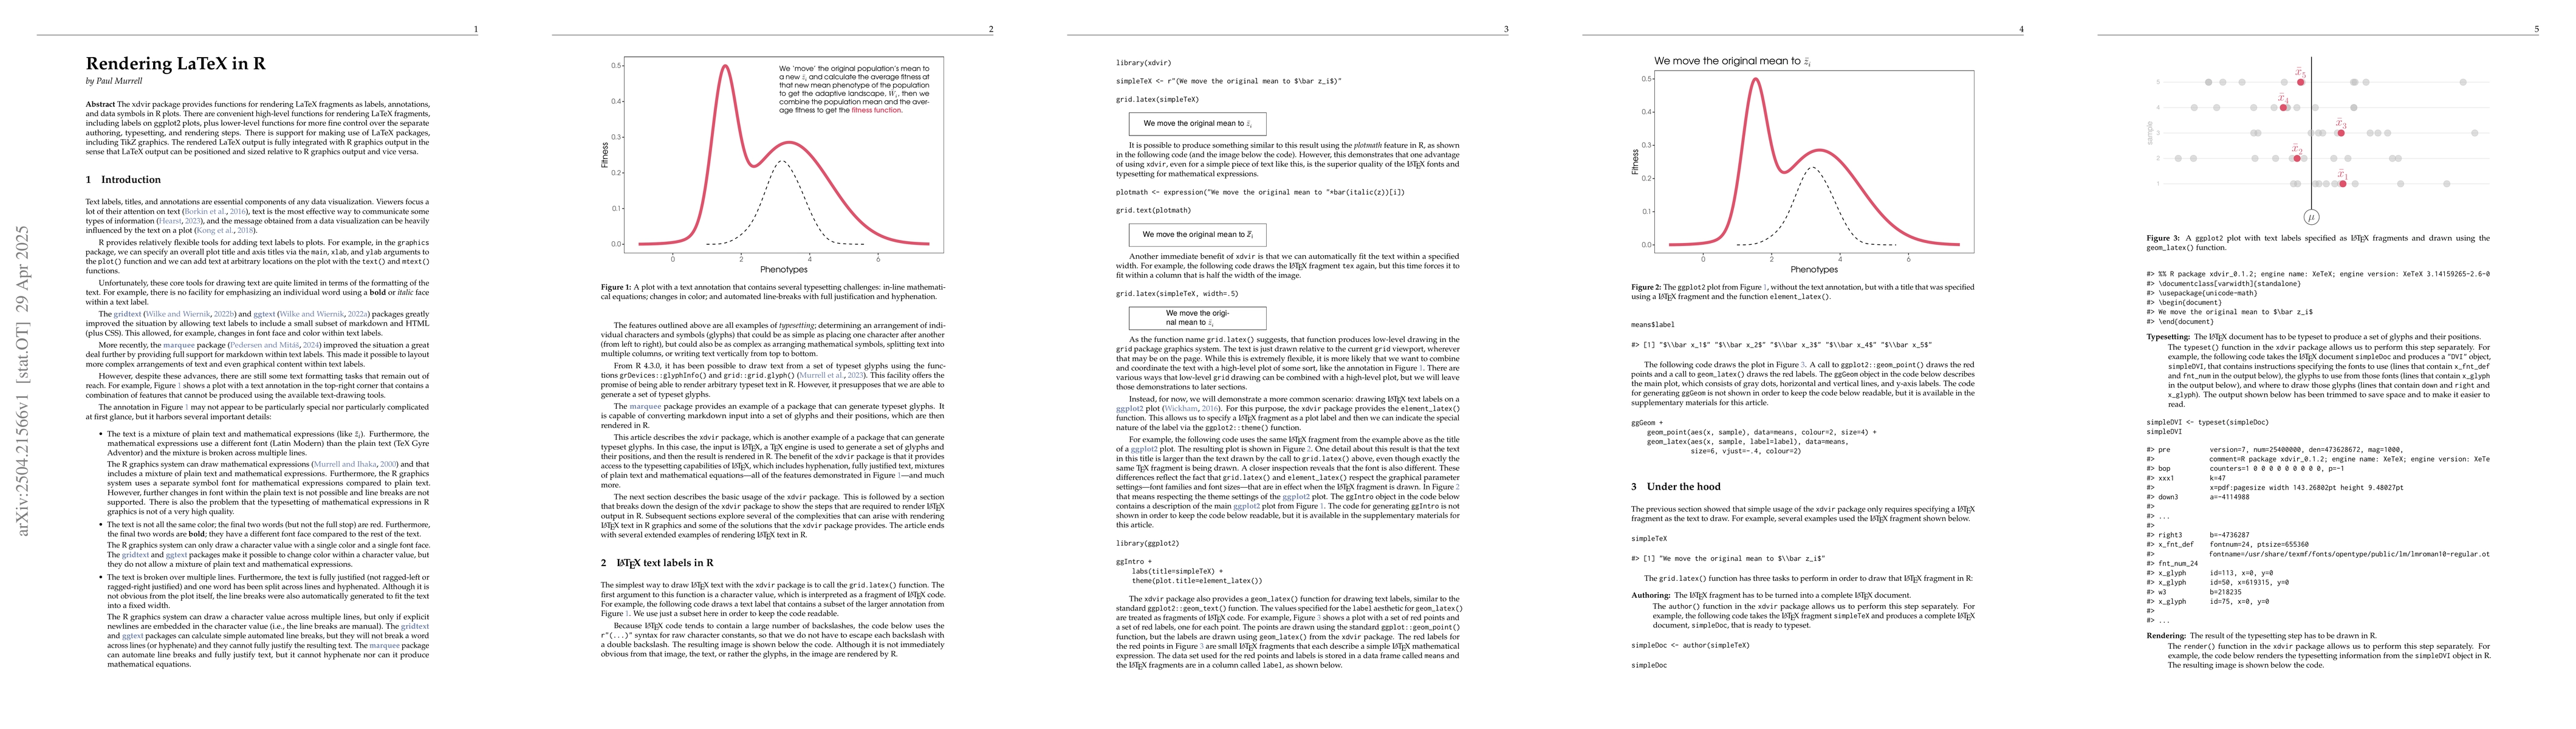
The xdvir package provides functions for rendering LaTeX fragments as labels, annotations, and data symbols in R plots. There are convenient high-level functions for rendering LaTeX fragments, includi...
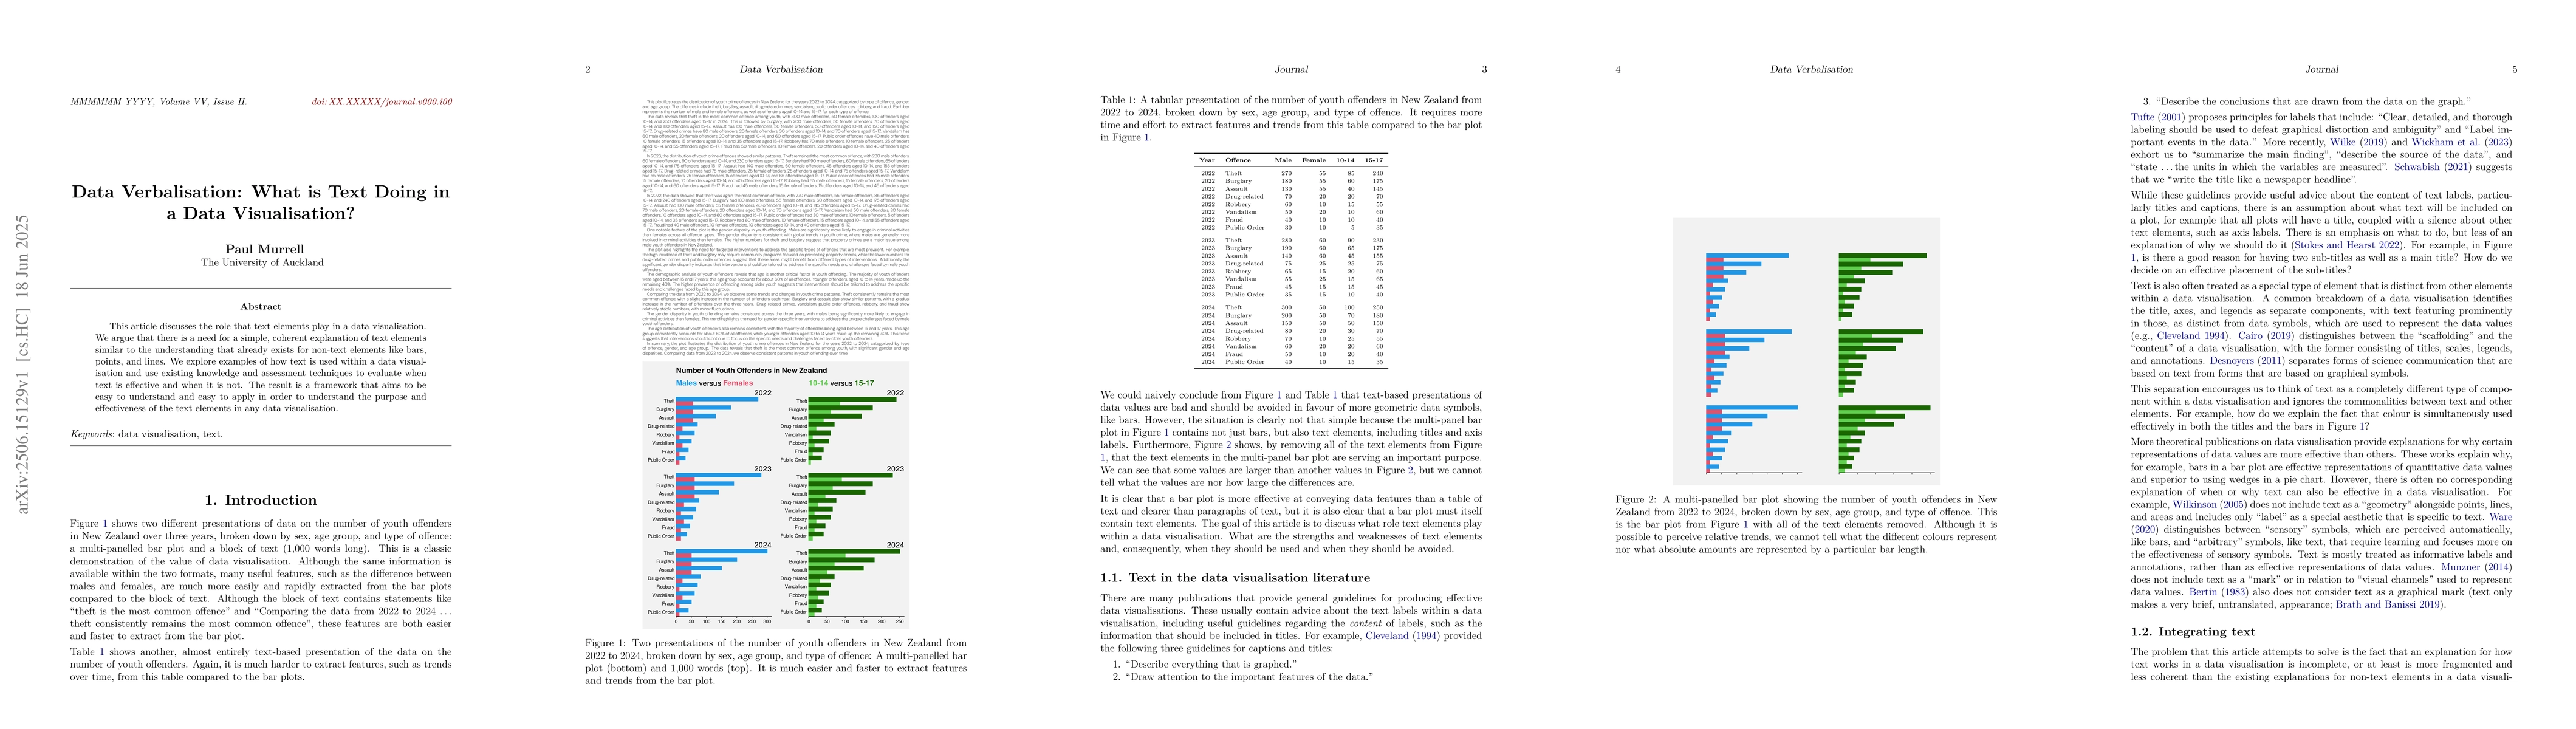
This article discusses the role that text elements play in a data visualisation. We argue that there is a need for a simple, coherent explanation of text elements similar to the understanding that alr...