Data Verbalisation: What is Text Doing in a Data Visualisation?
Publication
Metrics
Paper Preview
Abstract
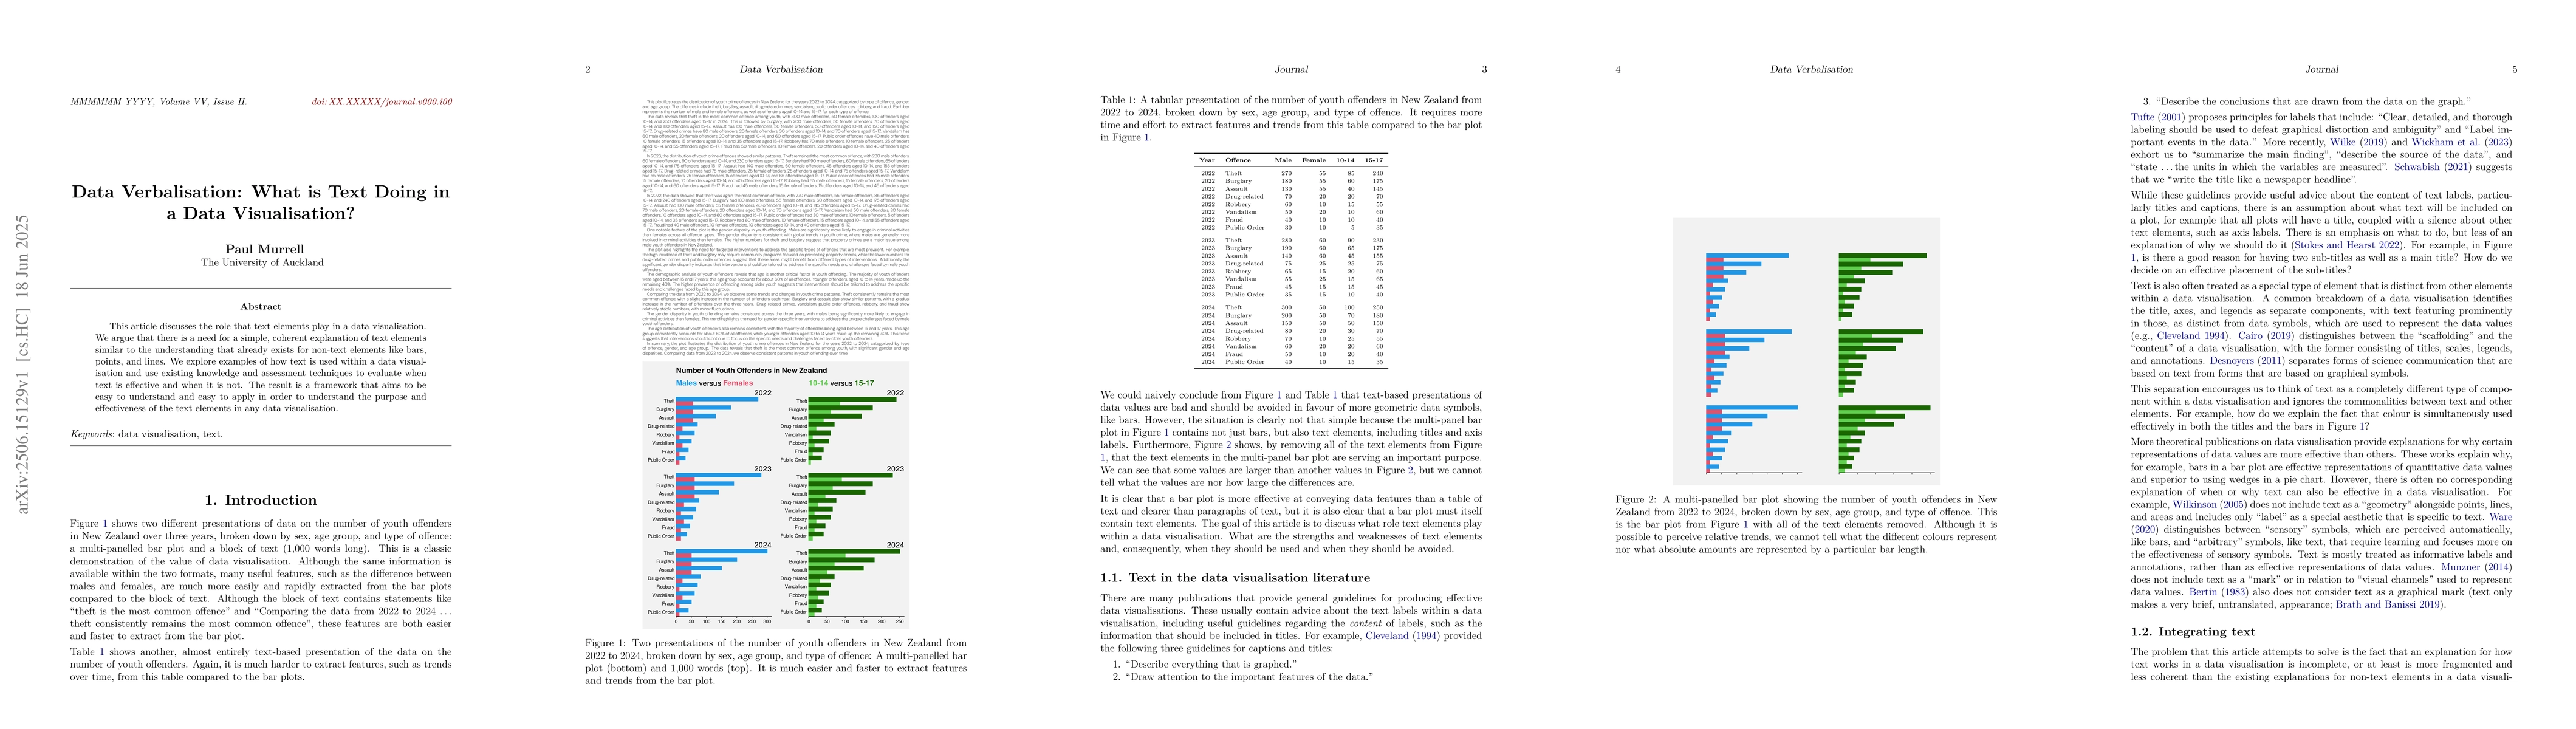
This article discusses the role that text elements play in a data visualisation. We argue that there is a need for a simple, coherent explanation of text elements similar to the understanding that already exists for non-text elements like bars, points, and lines. We explore examples of how text is used within a data visualisation and use existing knowledge and assessment techniques to evaluate when text is effective and when it is not. The result is a framework that aims to be easy to understand and easy to apply in order to understand the purpose and effectiveness of the text elements in any data visualisation.
AI Key Findings
Get AI-generated insights about this paper's methodology, results, significance, and more — seven facets brought into focus.
Impact
Paper Details
Authors
PDF Preview
Citation Network
Current paper (gray), citations (green), references (blue)
Display is limited for performance on very large graphs.
Discussion 0