Academic Profile
Statistics
Similar Authors
Papers on arXiv
We analyse the evolution of the largest ionized region using the topological and morphological evolution of the redshifted 21-cm signal coming from the neutral hydrogen distribution during the diffe...
The evolution of topology and morphology of ionized or neutral hydrogen during different stages of the Epoch of Reionization (EoR) have the potential to provide us a great amount of information abou...
The Largest Cluster Statistics\,(LCS) analysis of the redshifted 21\,cm maps has been demonstrated to be an efficient and robust method for following the time evolution of the largest ionized regions\...
Inferring astrophysical parameters from radio interferometric observations of the redshifted 21-cm signal from the Epoch of Reionization (EoR) is a challenging yet crucial task. The 21-cm signal from ...
Line intensity mapping (LIM) is an emerging technique for probing the large scale structure (LSS) in the post-reionisation era. This captures the integrated flux of a particular spectral line emission...
The redshifted 21-cm signal emitted by neutral Hydrogen (HI) is a promising probe to understand the evolution of the topology of ionized regions during the Epoch of Reionization (EoR). The topology of...
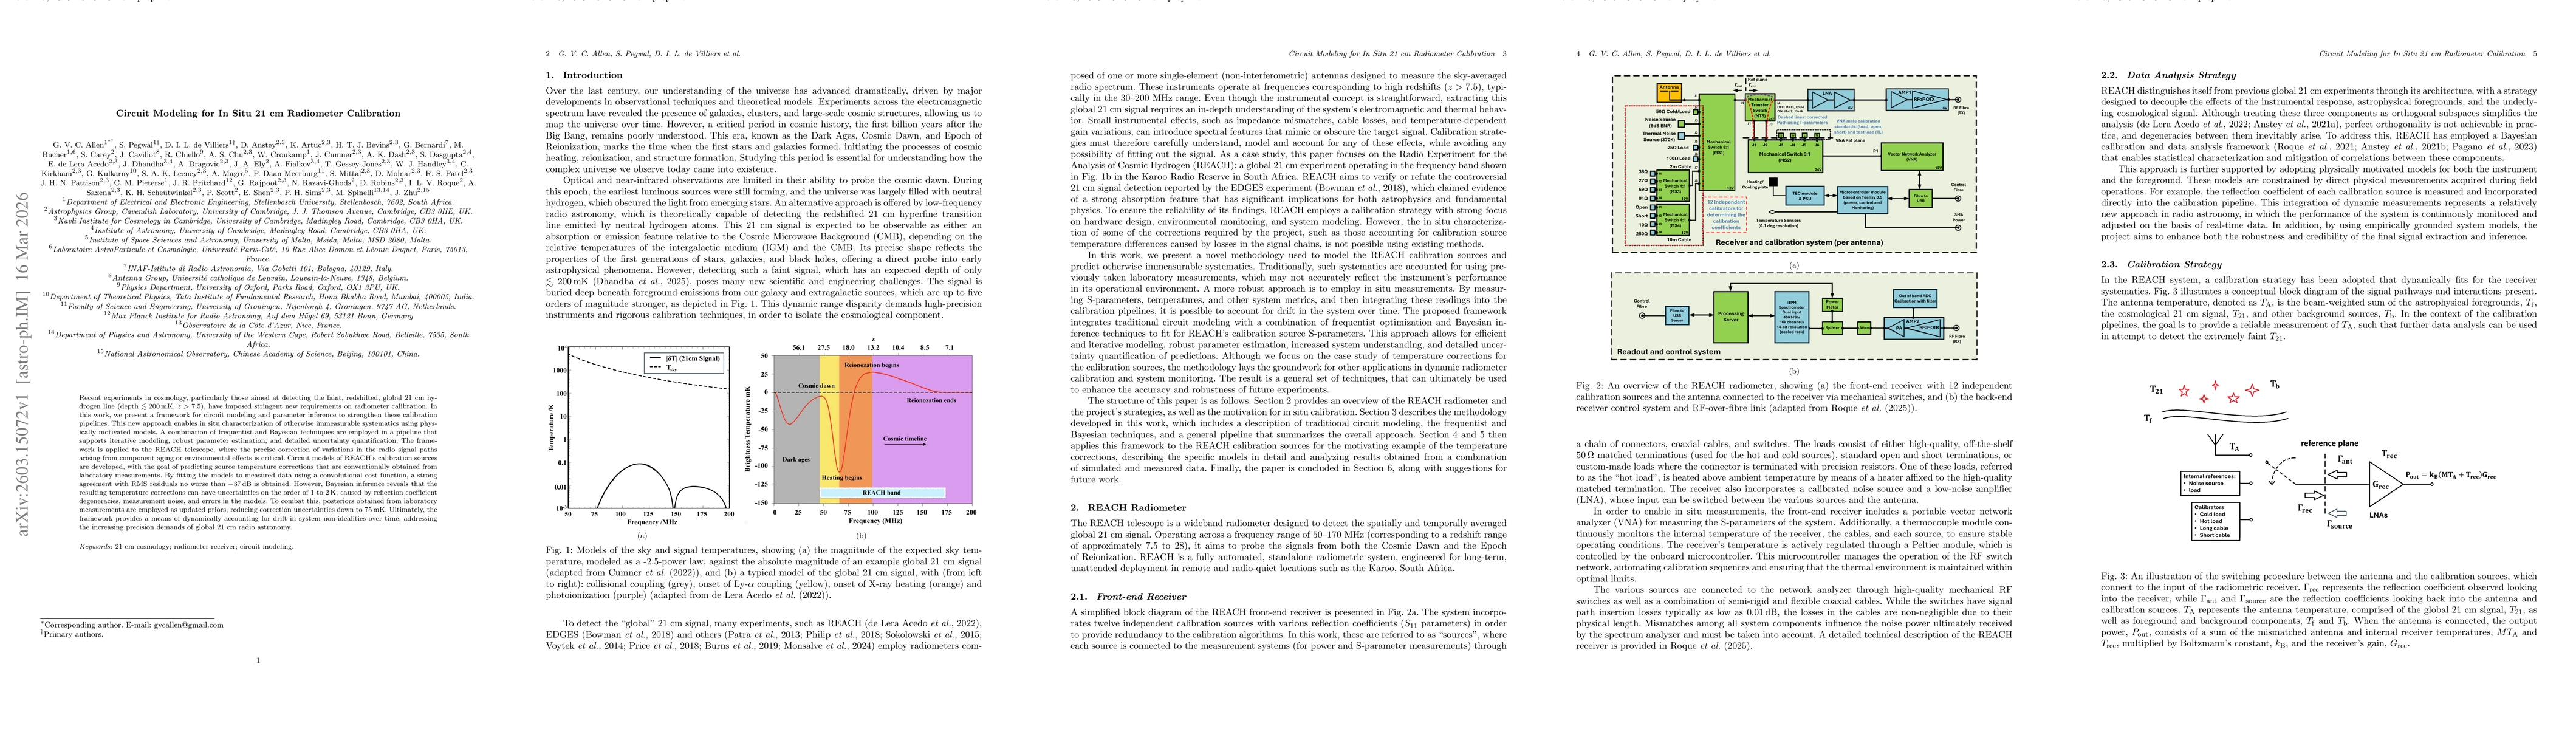
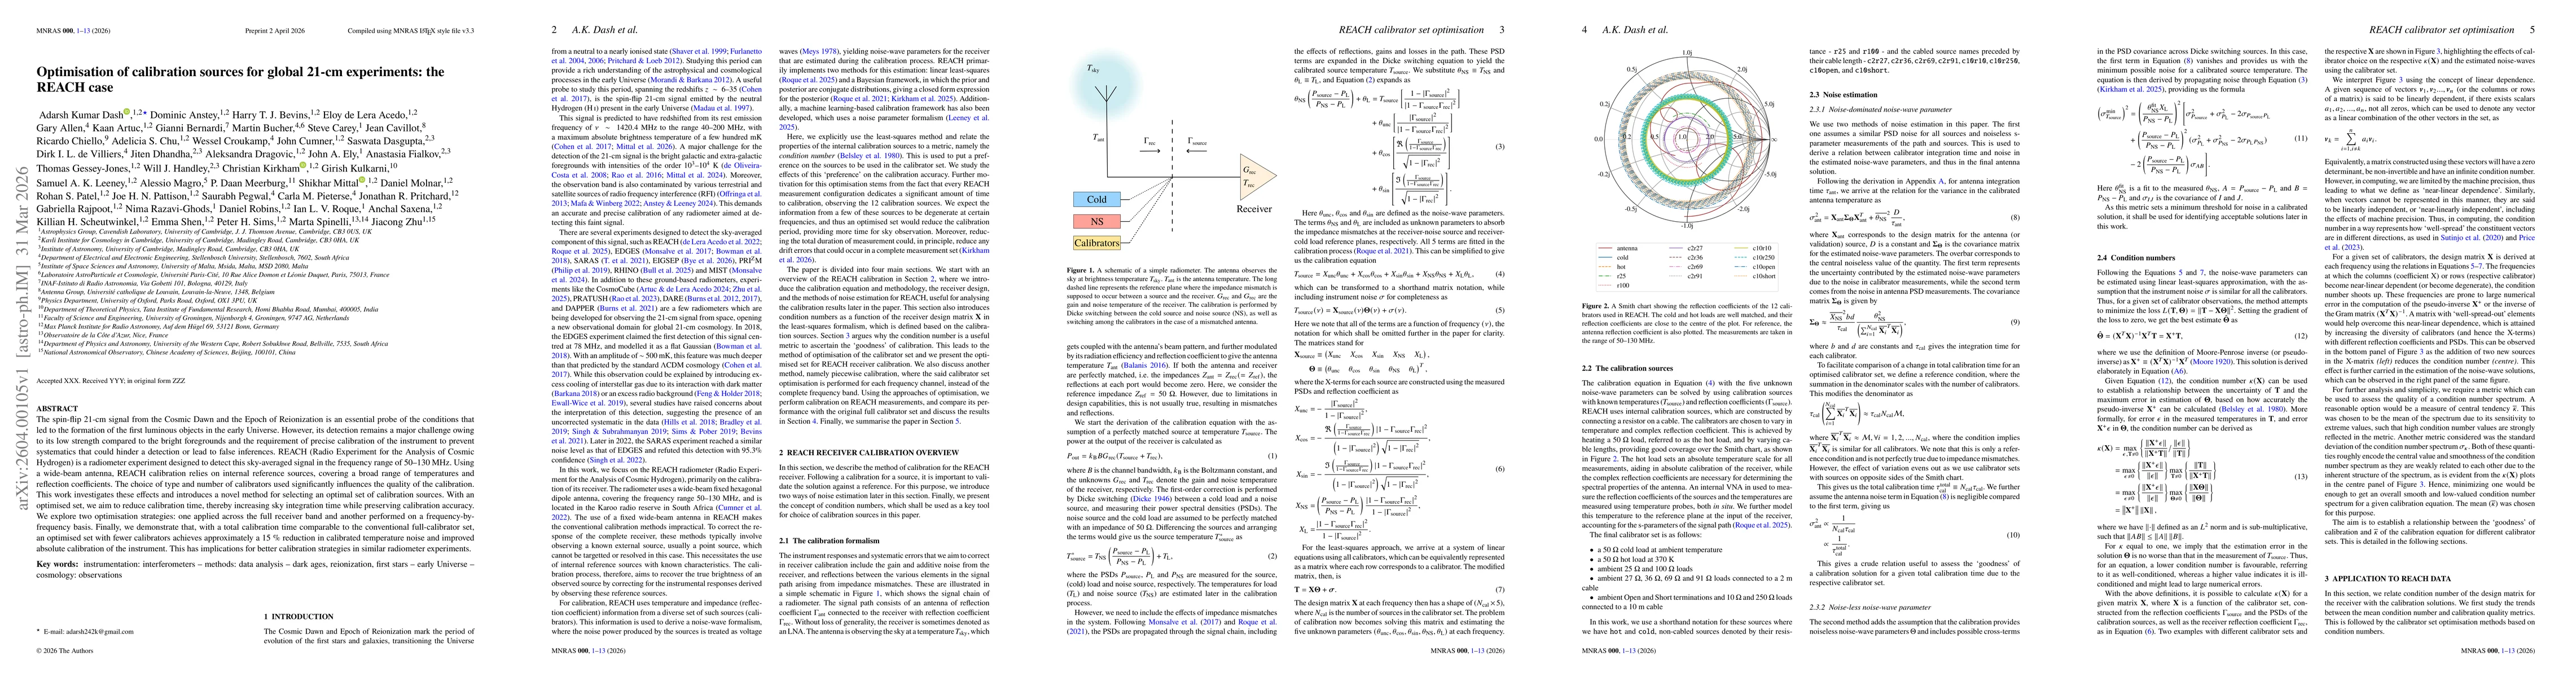
Recent experiments in cosmology, particularly those aimed at detecting the faint, redshifted, global 21 cm hydrogen line (depth < ~200 mK, z > 7.5), have imposed stringent new requirements on radiomet...
The spin-flip 21-cm signal from the Cosmic Dawn and the Epoch of Reionization is an essential probe of the conditions that led to the formation of the first luminous objects in the early Universe. How...

High-mass X-ray binaries are one of the primary drivers of the 21-cm signal from Cosmic Dawn and Reionization, playing a leading role in the thermal history of the intergalactic medium. In traditional...
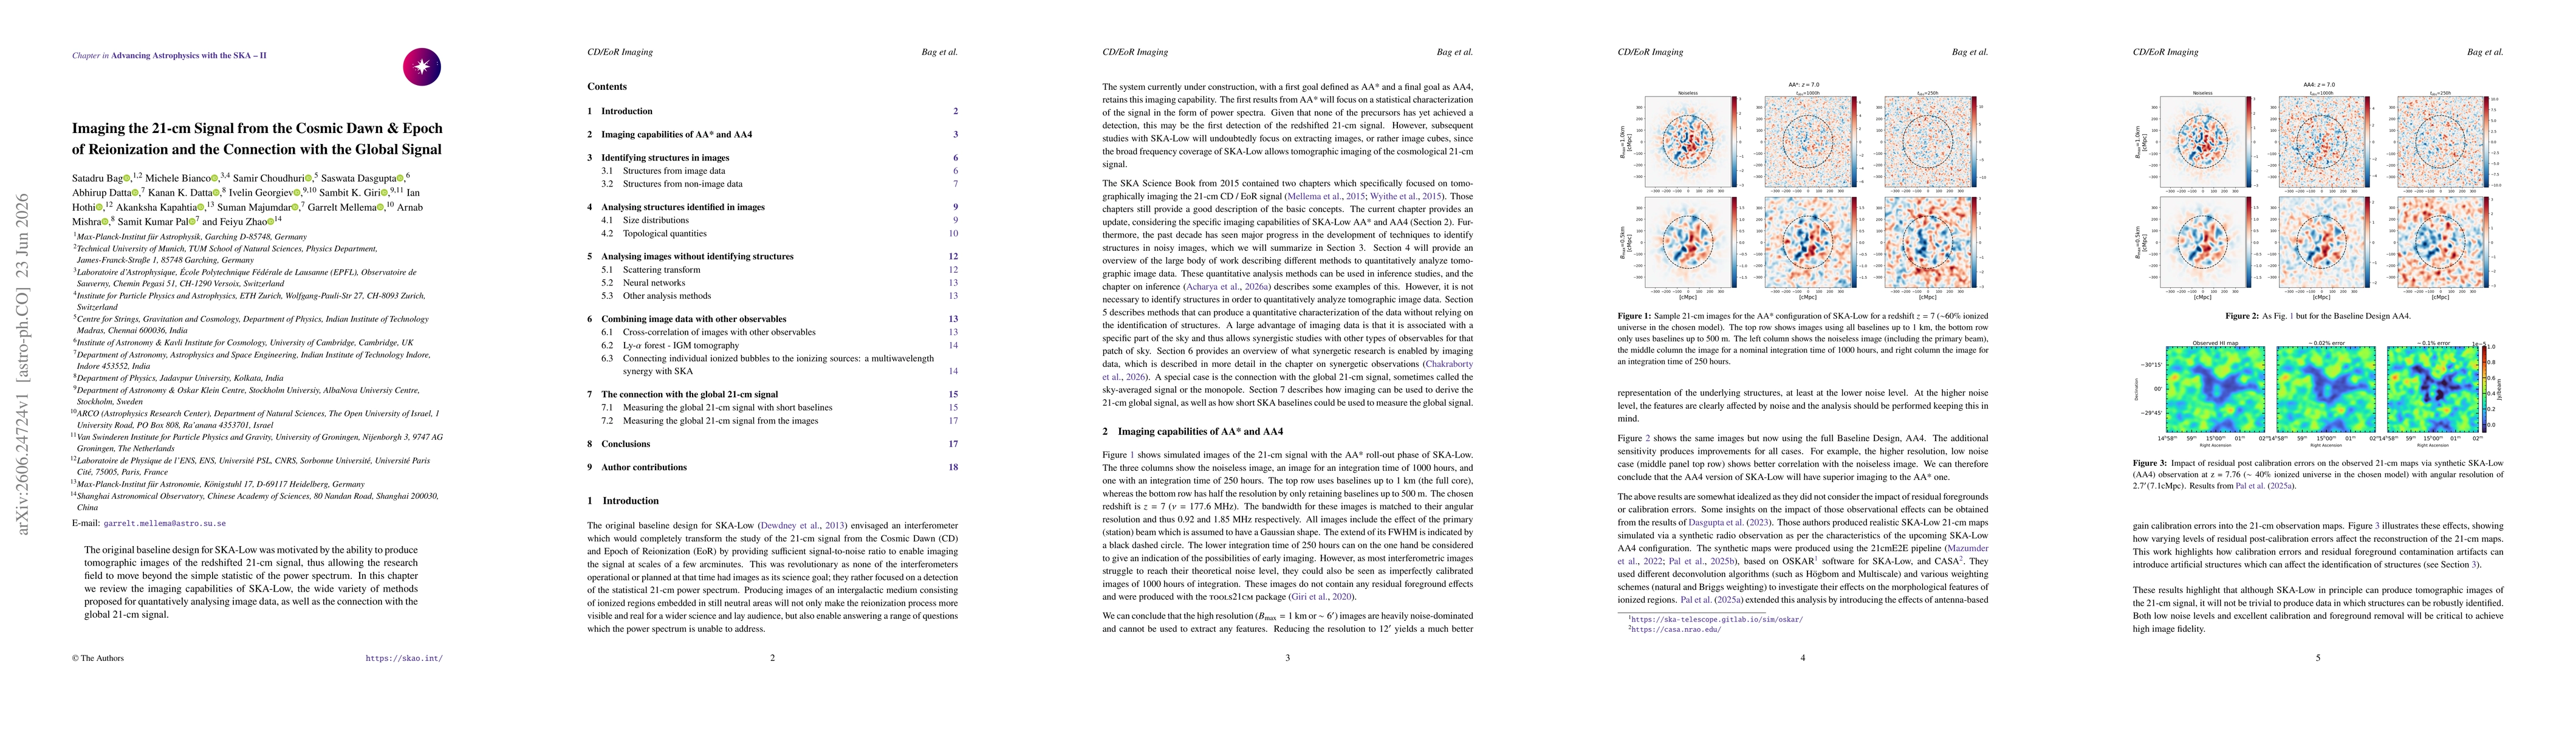
The original baseline design for SKA-Low was motivated by the ability to produce tomographic images of the redshifted 21-cm signal, thus allowing the research field to move beyond the simple statistic...
We provide an overview of the eight SKAO Science Book chapters that motivate the Epoch of Reionisation and Cosmic Dawn experiments with SKA-Low. We describe the individual SKA-Low experiments and expe...
The Square Kilometre Array's low frequency telescope (SKA-Low) will enable inference of astrophysical and cosmological parameters from the redshifted 21 cm signal, probing the Cosmic Dawn and Epoch of...
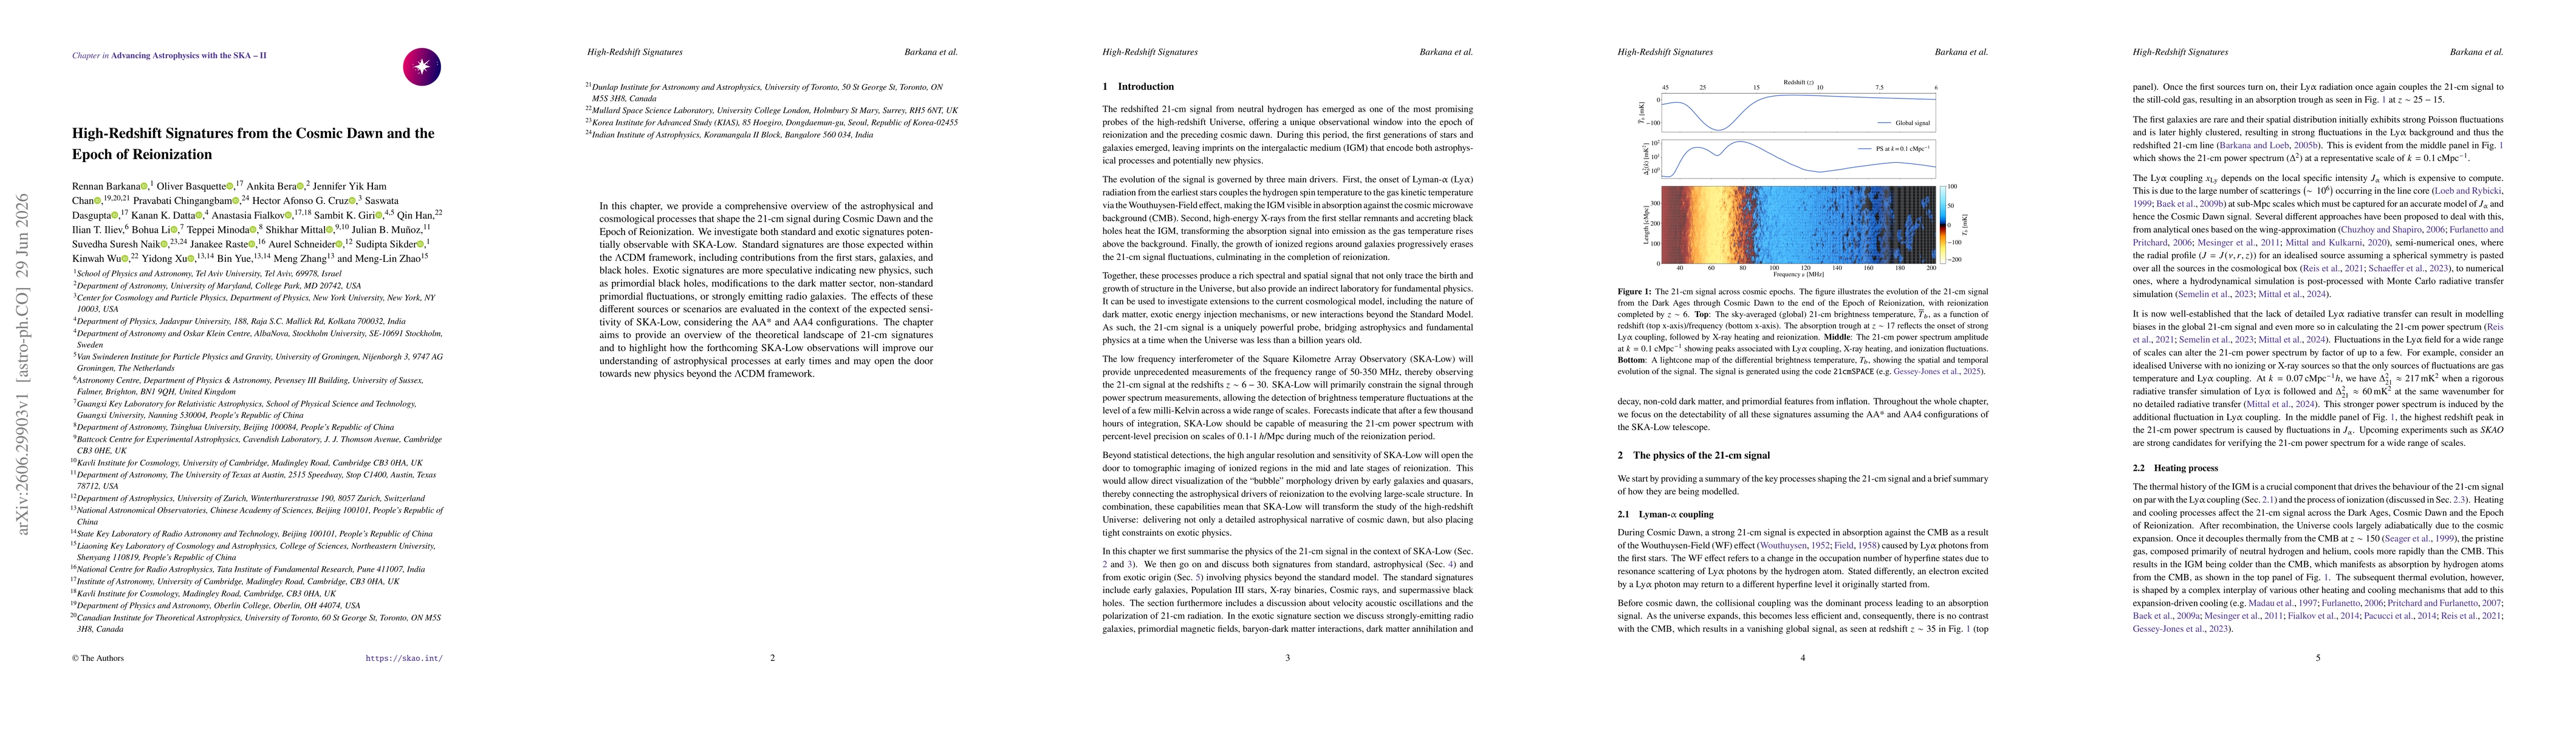
In this chapter, we provide a comprehensive overview of the astrophysical and cosmological processes that shape the 21-cm signal during Cosmic Dawn and the Epoch of Reionization. We investigate both s...