Tracing Large Scale Structure Morphology with Multiwavelength Line Intensity Maps
Publication
Metrics
Paper Preview
Abstract
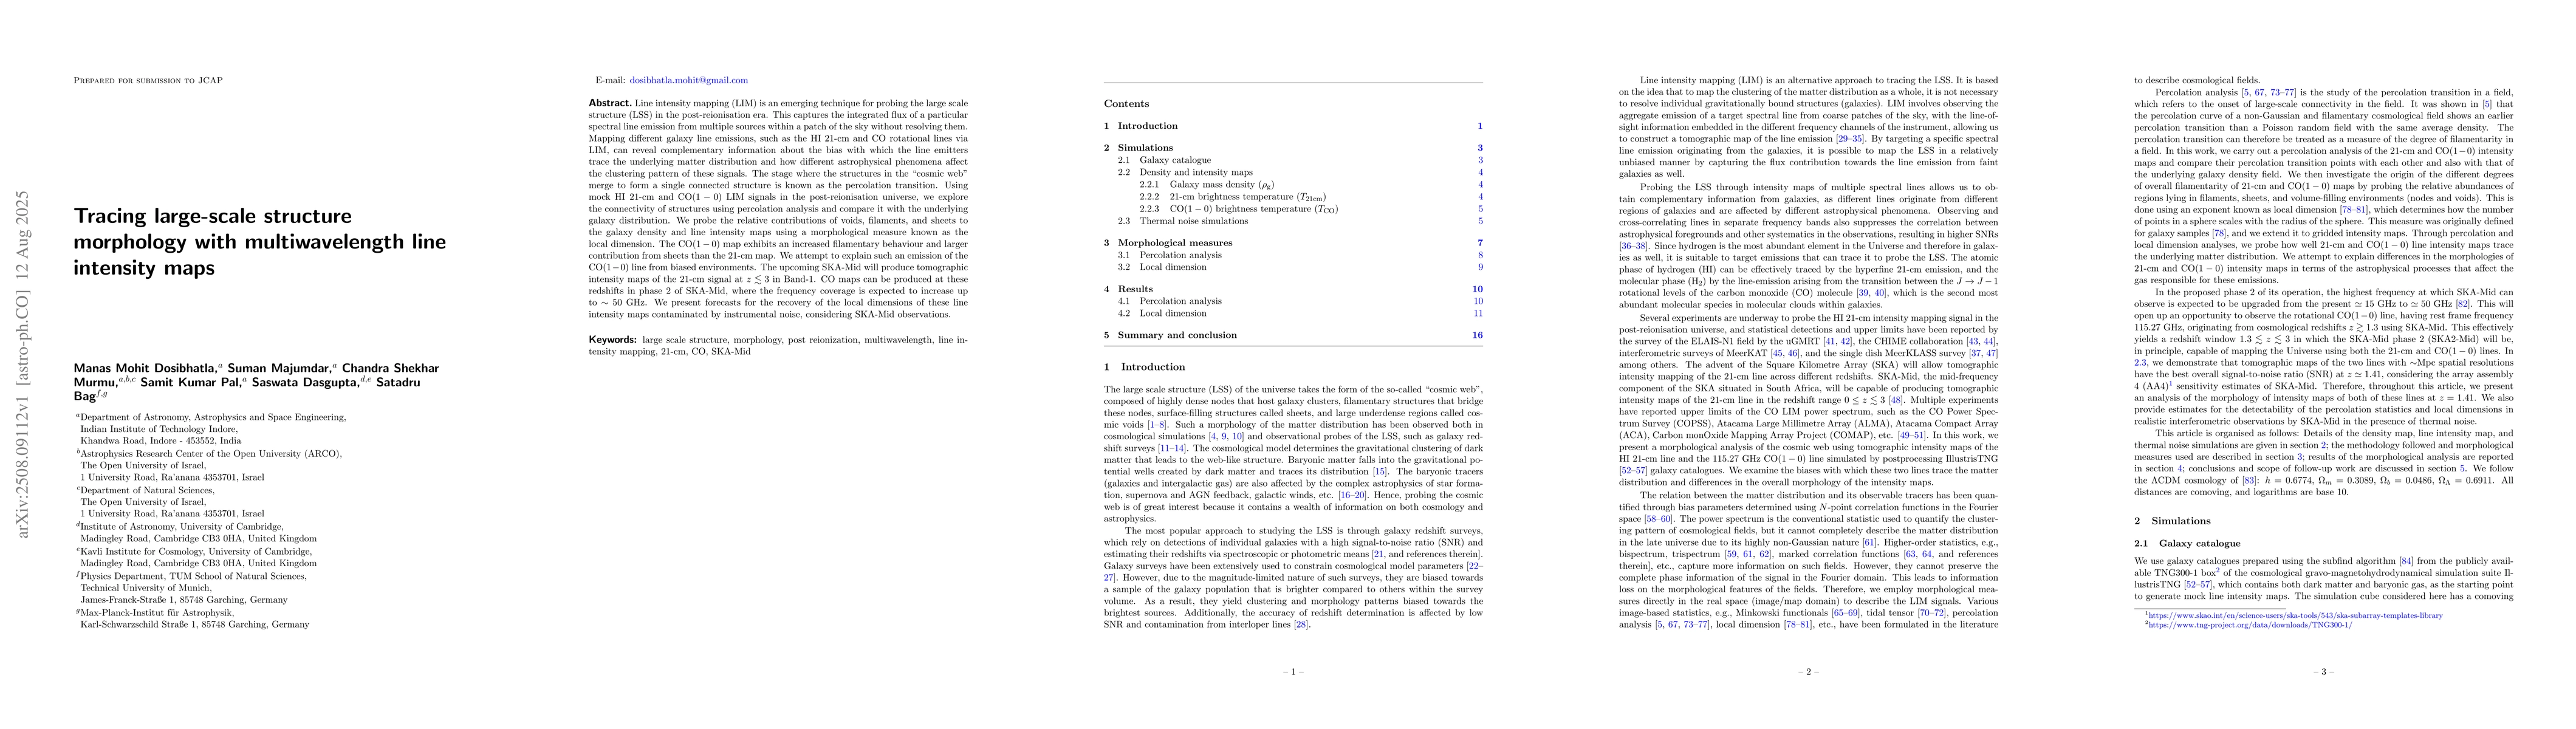
Line intensity mapping (LIM) is an emerging technique for probing the large scale structure (LSS) in the post-reionisation era. This captures the integrated flux of a particular spectral line emission from multiple sources within a patch of the sky without resolving them. Mapping different galaxy line emissions, such as the HI $21$-cm and CO rotational lines via LIM, can reveal complementary information about the bias with which the line emitters trace the underlying matter distribution and how different astrophysical phenomena affect the clustering pattern of these signals. The stage where the structures in the cosmic web merge to form a single connected structure is known as the percolation transition. Using mock HI $21$-cm and CO($1-0$) LIM signals in the post-reionisation universe, we explore the connectivity of structures through percolation analysis and compare it with that of the underlying galaxy distribution. We probe the relative contributions of voids, filaments, and sheets to the galaxy density and line intensity maps using a morphological measure known as the local dimension. The CO($1-0$) map exhibits an increased filamentary behaviour and larger contribution from sheets than the $21$-cm map. We attempt to explain such an emission of the CO($1-0$) line from biased environments. The upcoming SKA-Mid will produce tomographic intensity maps of the $21$-cm signal at $z \lesssim 3$ in Band-1. CO maps can be produced at these redshifts in phase 2 of SKA-Mid, where the frequency coverage is expected to increase up to $\sim 50$ GHz. We present forecasts for the recovery of the local dimensions of these intensity maps contaminated by instrumental noise, considering SKA-Mid observations.
AI Key Findings
Get AI-generated insights about this paper's methodology, results, significance, and more — seven facets brought into focus.
Discussion 0