Publication
Metrics
AI Quick Summary
This paper analyzes the 1/f noise in the FAST telescope's receiver system using drift-scan data, finding that 1/f fluctuations are present in all 19 beams. The study employs Singular Value Decomposition to reduce the noise, achieving a significant reduction in the knee frequency to $1.8 \times 10^{-3}\Hz$. The residual 1/f noise is uncorrelated in frequency and can bias HI intensity mapping measurements by up to 10 percent.
Paper Preview
Abstract
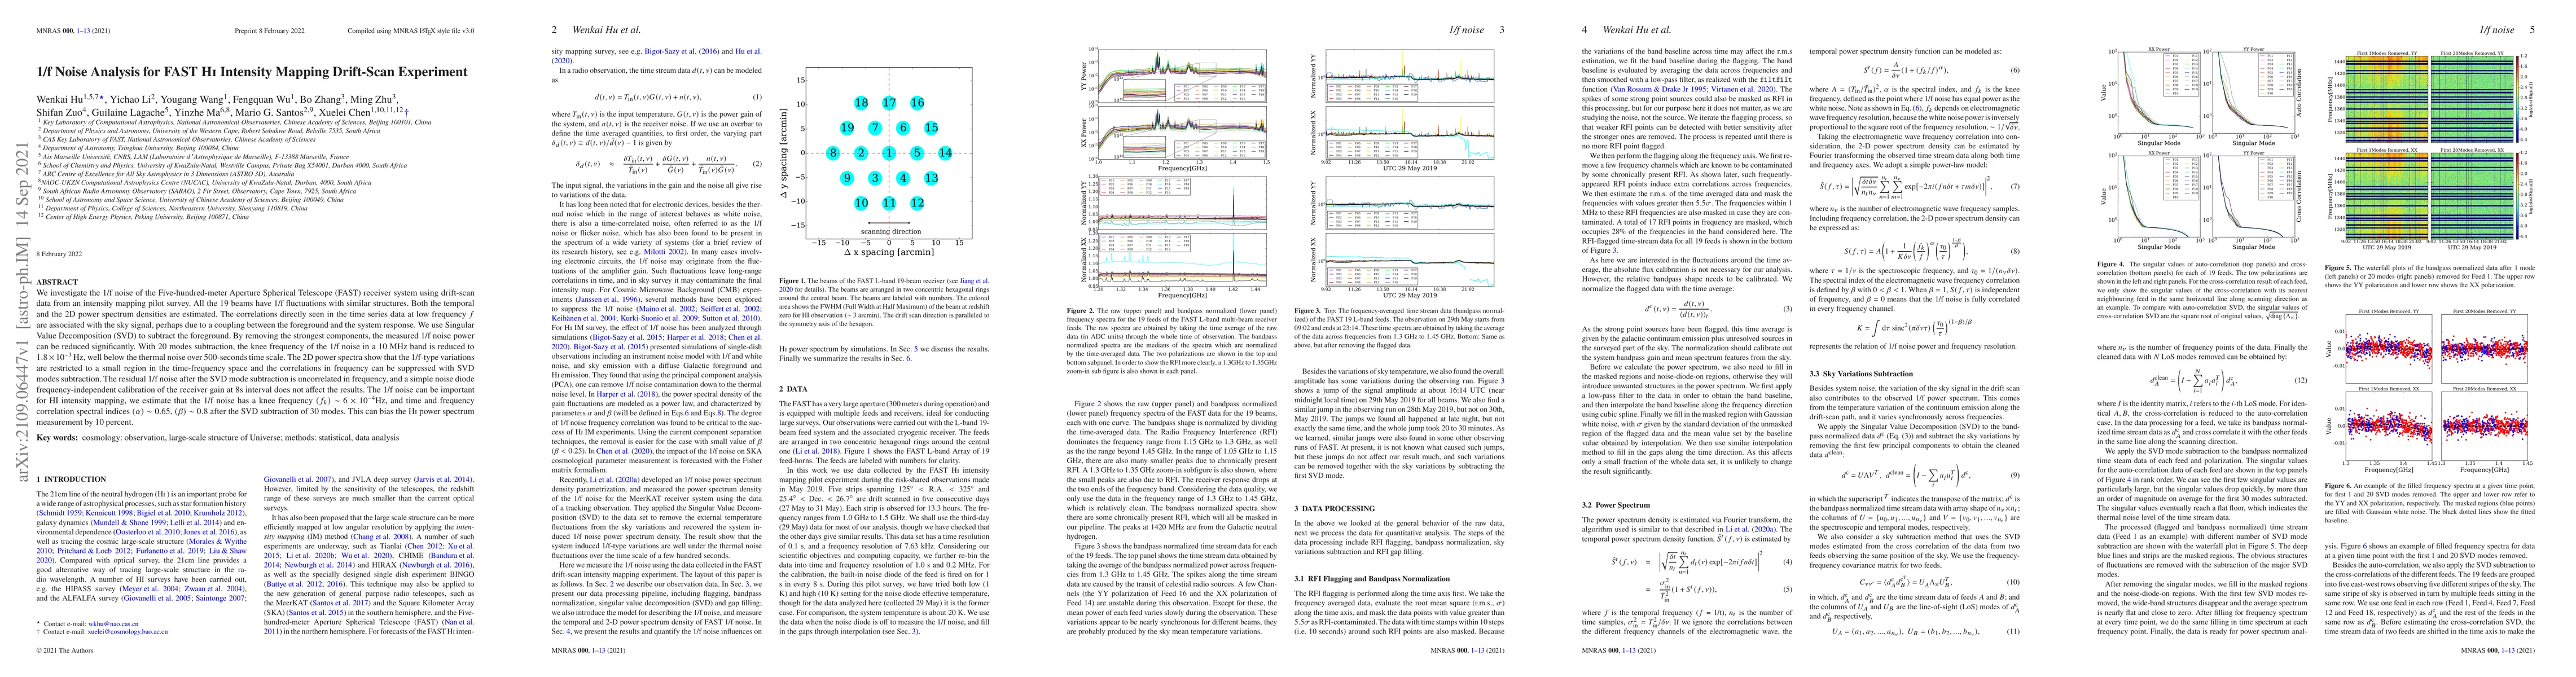
We investigate the 1/f noise of the Five-hundred-meter Aperture Spherical Telescope (FAST) receiver system using drift-scan data from an intensity mapping pilot survey. All the 19 beams have 1/f fluctuations with similar structures. Both the temporal and the 2D power spectrum densities are estimated. The correlations directly seen in the time series data at low frequency $f$ are associated with the sky signal, perhaps due to a coupling between the foreground and the system response. We use Singular Value Decomposition (SVD) to subtract the foreground. By removing the strongest components, the measured 1/f noise power can be reduced significantly. With 20 modes subtraction, the knee frequency of the 1/f noise in a 10 MHz band is reduced to $1.8 \times 10^{-3}\Hz$, well below the thermal noise over 500-seconds time scale. The 2D power spectra show that the 1/f-type variations are restricted to a small region in the time-frequency space and the correlations in frequency can be suppressed with SVD modes subtraction. The residual 1/f noise after the SVD mode subtraction is uncorrelated in frequency, and a simple noise diode frequency-independent calibration of the receiver gain at 8s interval does not affect the results. The 1/f noise can be important for HI intensity mapping, we estimate that the 1/f noise has a knee frequency $(f_{k}) \sim$ 6 $\times$ 10$^{-4}$Hz, and time and frequency correlation spectral indices $(\alpha) \sim 0.65$, $(\beta) \sim 0.8$ after the SVD subtraction of 30 modes. This can bias the HI power spectrum measurement by 10 percent.
AI Key Findings
Get AI-generated insights about this paper's methodology, results, significance, and more — seven facets brought into focus.
Impact
Paper Details
Authors
PDF Preview
Key Terms
Citation Network
Current paper (gray), citations (green), references (blue)
Display is limited for performance on very large graphs.
Discussion 0