FAST drift scan survey for HI intensity mapping: I. preliminary data analysis
Publication
Metrics
AI Quick Summary
This paper reports preliminary results from the FAST drift-scan survey for HI intensity mapping, showing successful calibration strategies and continuum maps with noise levels slightly above forecasts. The survey covers $60\,{\rm deg}^2$ sky area, with flux measurements consistent with literature and NVSS catalog.
Paper Preview
Abstract
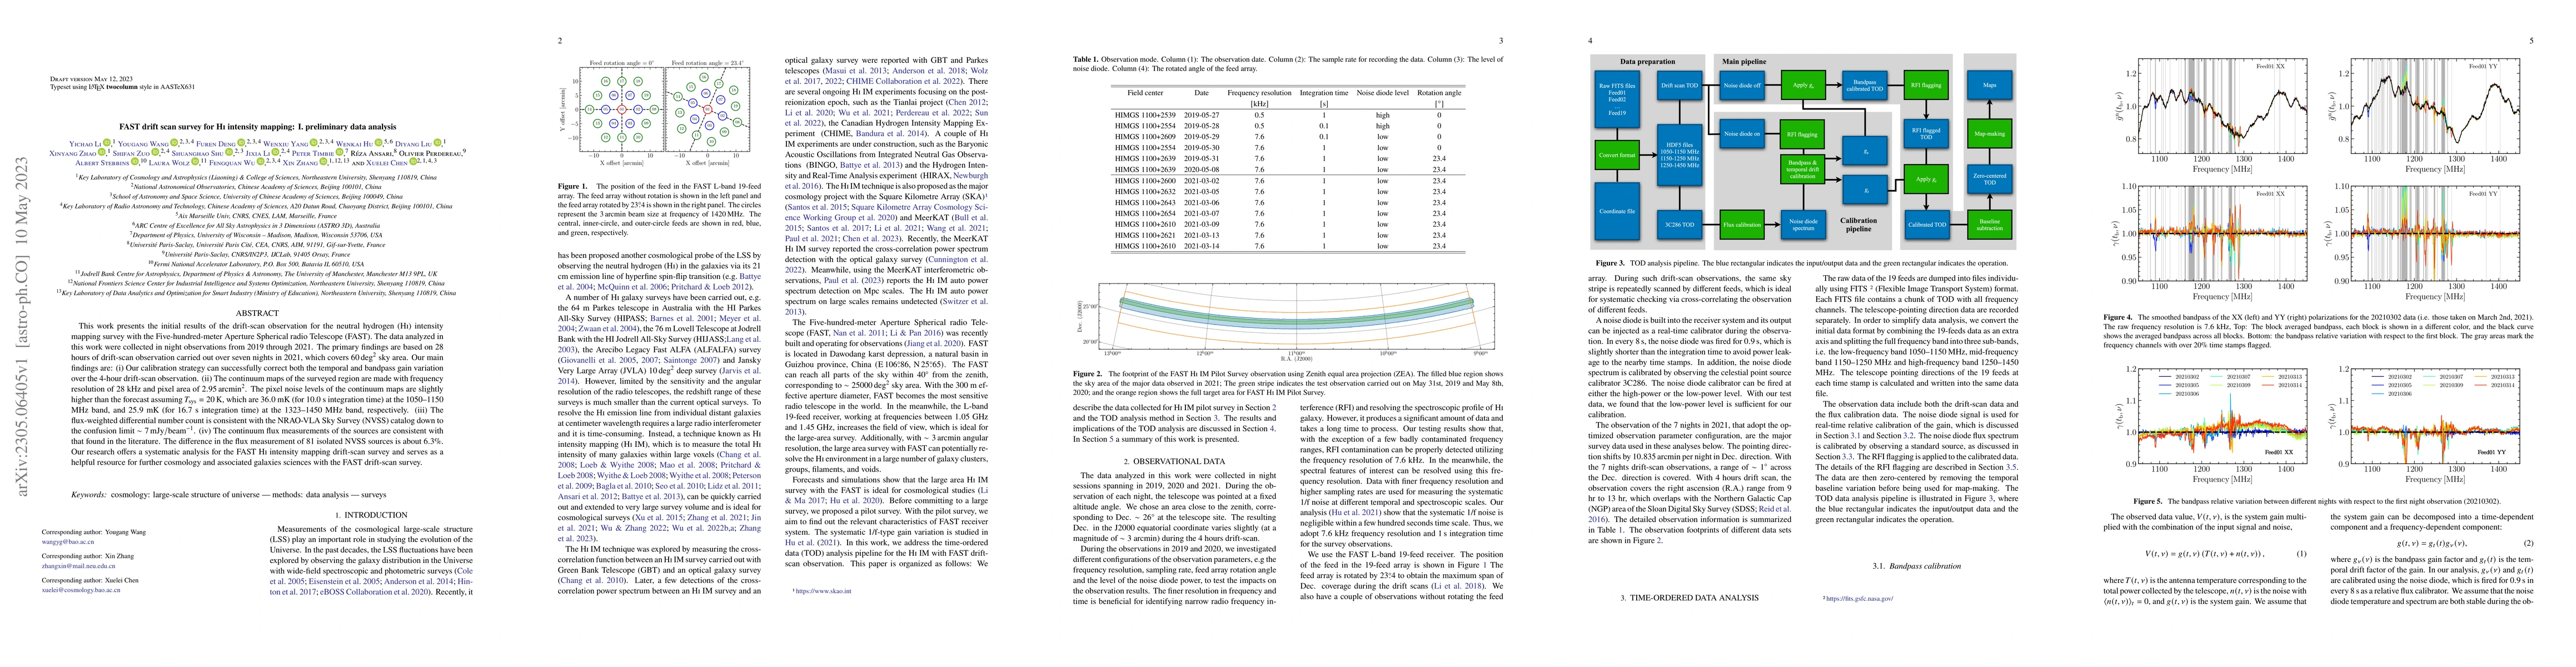
This work presents the initial results of the drift-scan observation for the neutral hydrogen (HI) intensity mapping survey with the Five-hundred-meter Aperture Spherical radio Telescope (FAST). The data analyzed in this work were collected in night observations from 2019 through 2021. The primary findings are based on 28 hours of drift-scan observation carried out over seven nights in 2021, which covers $60\,{\rm deg}^2$ sky area. Our main findings are: (i) Our calibration strategy can successfully correct both the temporal and bandpass gain variation over the $4$-hour drift-scan observation. (ii) The continuum maps of the surveyed region are made with frequency resolution of $28$ kHz and pixel area of $2.95\,{\rm arcmin}^2$. The pixel noise levels of the continuum maps are slightly higher than the forecast assuming $T_{\rm sys}=20\,{\rm K}$, which are $36.0$ mK (for 10.0 s integration time) at the $1050$--$1150$ MHz band, and $25.9$ mK (for 16.7 s integration time) at the $1323$--$1450$ MHz band, respectively. (iii) The flux-weighted differential number count is consistent with the NRAO-VLA Sky Survey (NVSS) catalog down to the confusion limit $\sim7\,{\rm mJy}/{\rm beam}^{-1}$. (iv) The continuum flux measurements of the sources are consistent with that found in the literature. The difference in the flux measurement of $81$ isolated NVSS sources is about $6.3\%$. Our research offers a systematic analysis for the FAST HI intensity mapping drift-scan survey and serves as a helpful resource for further cosmology and associated galaxies sciences with the FAST drift-scan survey.
AI Key Findings
Get AI-generated insights about this paper's methodology, results, significance, and more — seven facets brought into focus.
Impact
Paper Details
Authors
PDF Preview
Key Terms
Citation Network
Current paper (gray), citations (green), references (blue)
Display is limited for performance on very large graphs.
Discussion 0