Summary
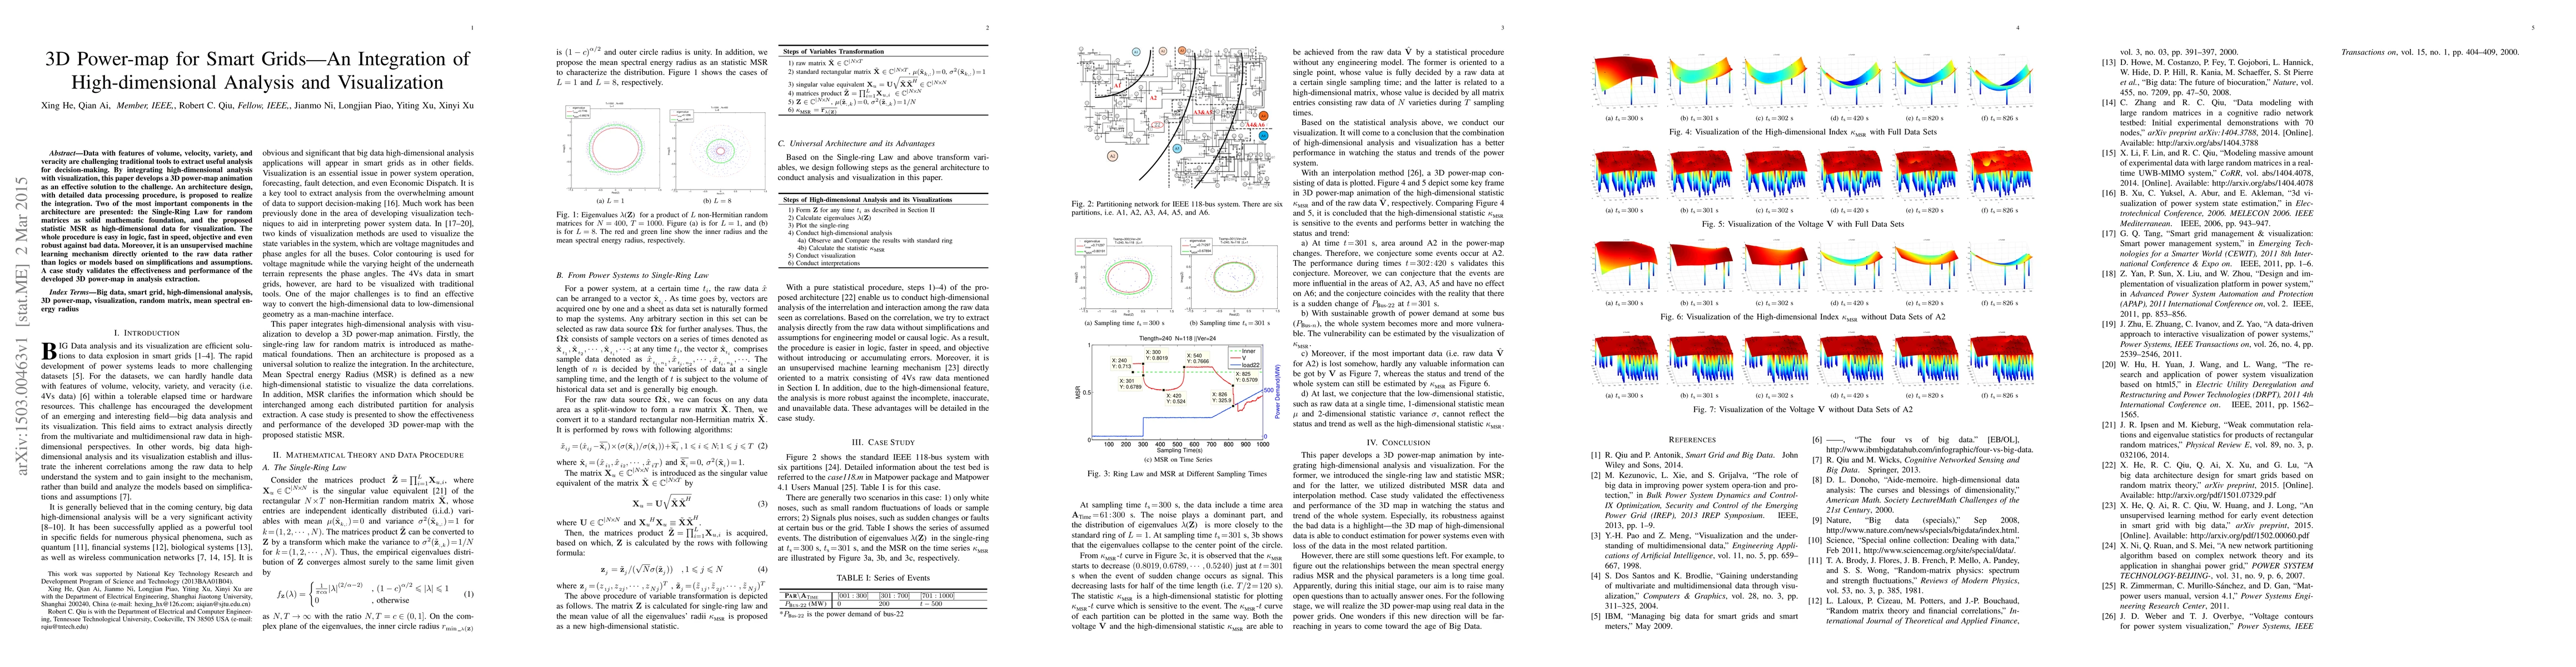
Data with features of volume, velocity, variety, and veracity are challenging traditional tools to extract useful analysis for decision-making. By integrating high-dimensional analysis with visualization, this paper develops a 3D power-map animation as an effective solution to the challenge. An architecture design, with detailed data processing procedure, is proposed to realize the integration. Two of the most important components in the architecture are presented: the Single-Ring Law for random matrices as solid mathematic foundation, and the proposed statistical index MSR as high-dimensional data for visualization. The whole procedure is easy in logic, fast in speed, objective and even robust against bad data. Moreover, it is an unsupervised machine learning mechanism directly oriented to the raw data rather than logics or models based on simplifications and assumptions. A case study validates the effectiveness and performance of the developed 3D power-map in analysis extraction.
AI Key Findings
Get AI-generated insights about this paper's methodology, results, and significance.
Paper Details
PDF Preview
Key Terms
Citation Network
Current paper (gray), citations (green), references (blue)
Display is limited for performance on very large graphs.
Similar Papers
Found 4 papersTowards a Survey of Visualization Methods for Power Grids
Daniel A. Keim, Maximilian T. Fischer
Integration of Data Driven Technologies in Smart Grids for Resilient and Sustainable Smart Cities: A Comprehensive Review
Georges Kaddoum, Muhammad Adnan, Nadir Adam et al.
| Title | Authors | Year | Actions |
|---|
Comments (0)