A 3D super-resolution of wind fields via physics-informed pixel-wise self-attention generative adversarial network
Publication
Metrics
AI Quick Summary
This paper introduces a 3D super-resolution GAN with a pixel-wise self-attention module to upscale low-resolution wind fields by x9, aiding in the monitoring of greenhouse gas sources. The method significantly reduces computational costs while maintaining high-fidelity wind field resolution.
Paper Preview
Abstract
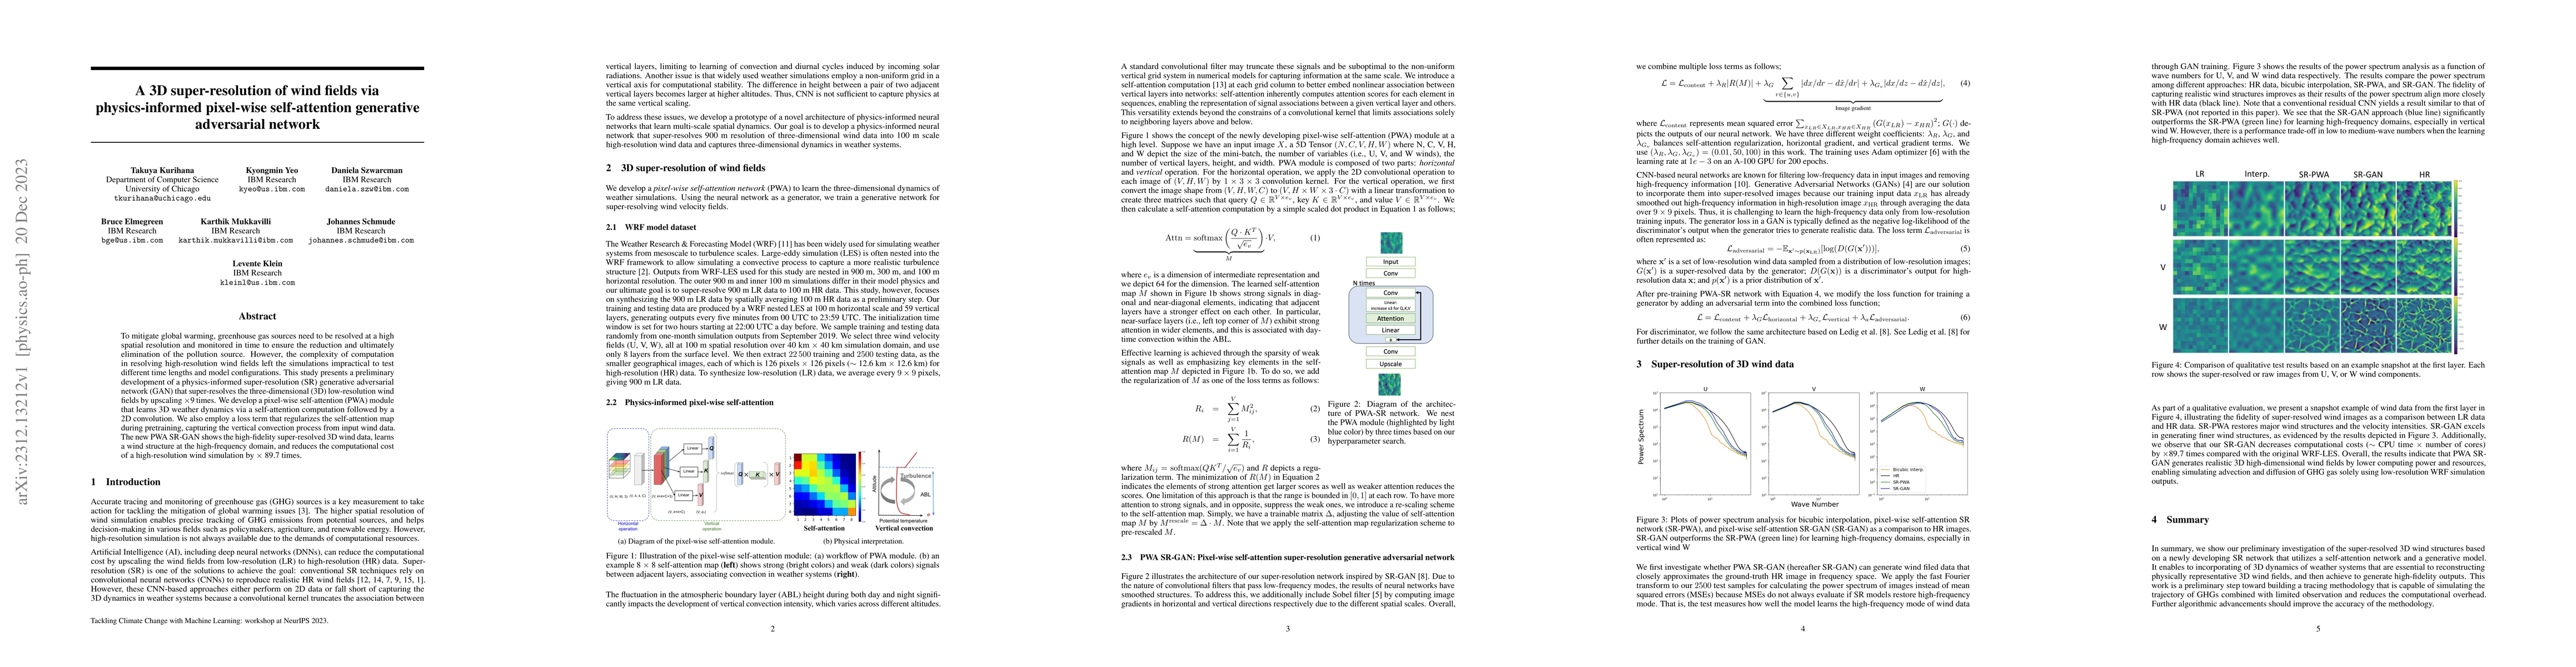
To mitigate global warming, greenhouse gas sources need to be resolved at a high spatial resolution and monitored in time to ensure the reduction and ultimately elimination of the pollution source. However, the complexity of computation in resolving high-resolution wind fields left the simulations impractical to test different time lengths and model configurations. This study presents a preliminary development of a physics-informed super-resolution (SR) generative adversarial network (GAN) that super-resolves the three-dimensional (3D) low-resolution wind fields by upscaling x9 times. We develop a pixel-wise self-attention (PWA) module that learns 3D weather dynamics via a self-attention computation followed by a 2D convolution. We also employ a loss term that regularizes the self-attention map during pretraining, capturing the vertical convection process from input wind data. The new PWA SR-GAN shows the high-fidelity super-resolved 3D wind data, learns a wind structure at the high-frequency domain, and reduces the computational cost of a high-resolution wind simulation by x89.7 times.
AI Key Findings
Get AI-generated insights about this paper's methodology, results, significance, and more — seven facets brought into focus.
Impact
Paper Details
Authors
PDF Preview
Key Terms
Citation Network
Current paper (gray), citations (green), references (blue)
Display is limited for performance on very large graphs.
Discussion 0