A Comprehensive Analytical Survey on Unsupervised and Semi-Supervised Graph Representation Learning Methods
Publication
Metrics
AI Quick Summary
This paper provides a comprehensive survey of unsupervised and semi-supervised graph representation learning methods, evaluating various techniques for node classification, link prediction, clustering, and visualization. It categorizes and rigorously compares algorithms based on performance metrics across different hardware platforms.
Paper Preview
Abstract
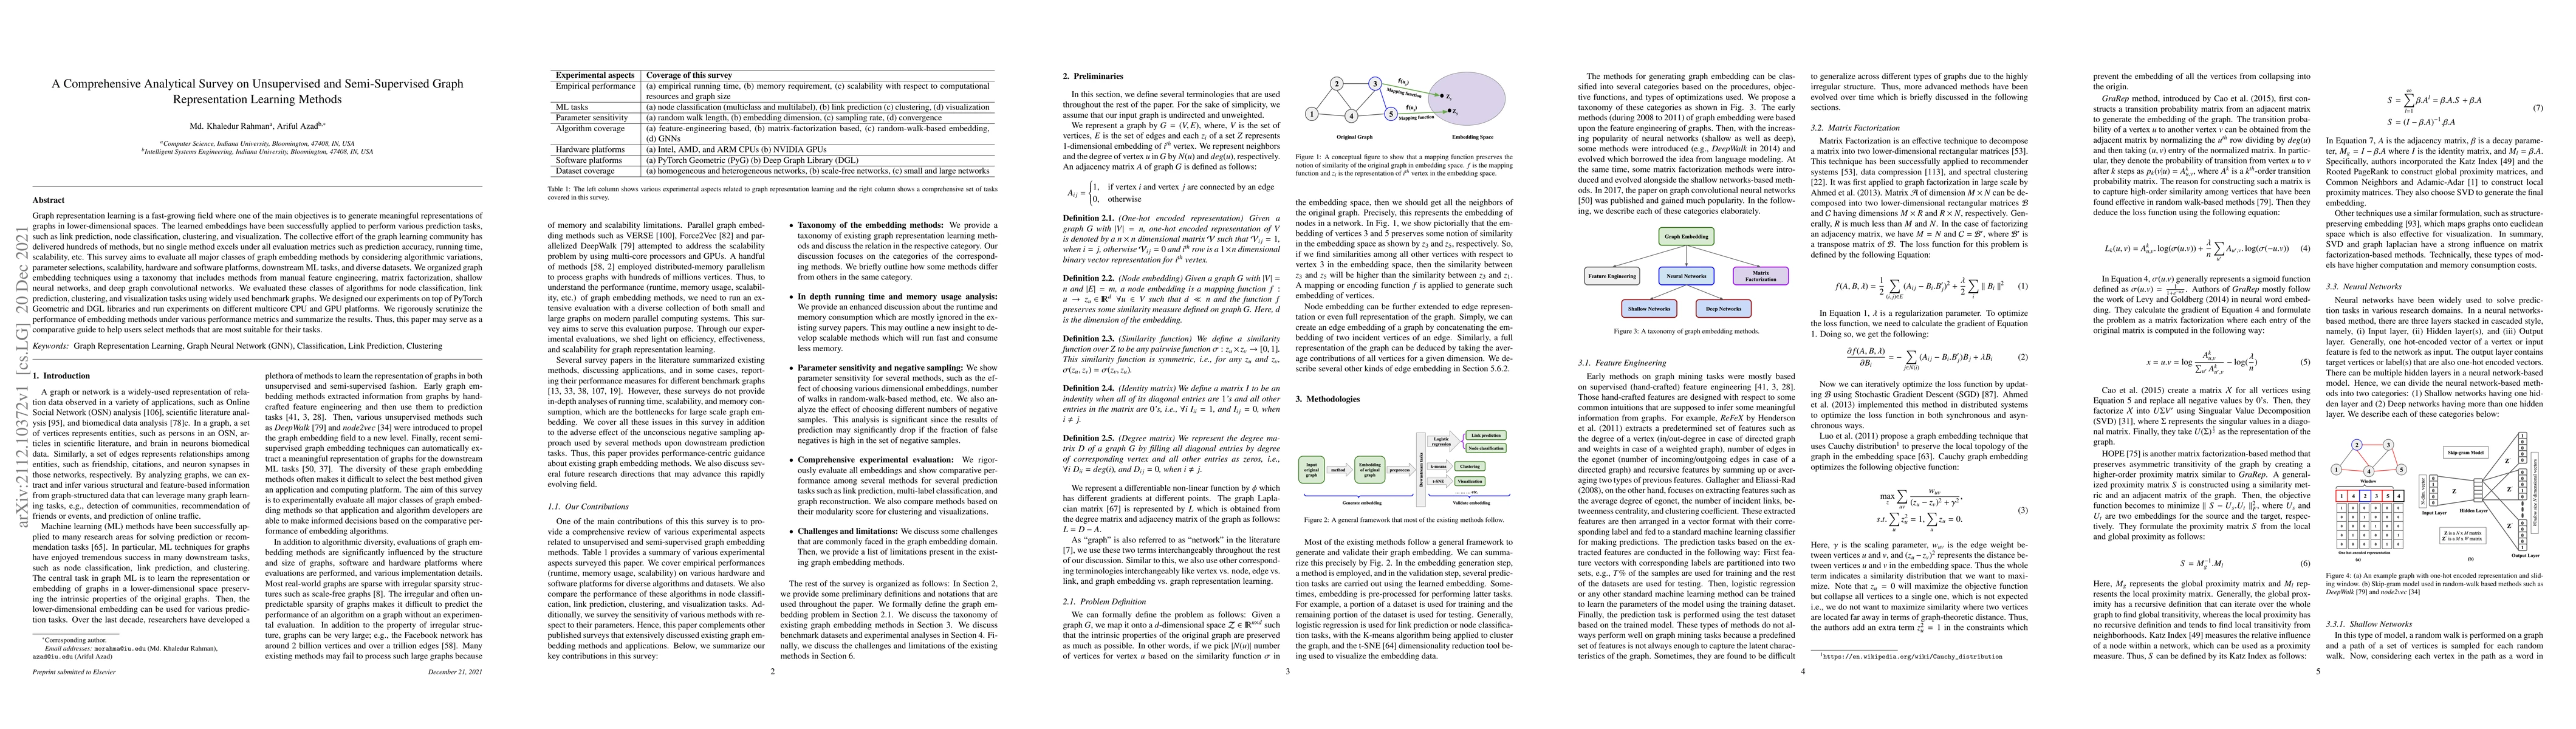
Graph representation learning is a fast-growing field where one of the main objectives is to generate meaningful representations of graphs in lower-dimensional spaces. The learned embeddings have been successfully applied to perform various prediction tasks, such as link prediction, node classification, clustering, and visualization. The collective effort of the graph learning community has delivered hundreds of methods, but no single method excels under all evaluation metrics such as prediction accuracy, running time, scalability, etc. This survey aims to evaluate all major classes of graph embedding methods by considering algorithmic variations, parameter selections, scalability, hardware and software platforms, downstream ML tasks, and diverse datasets. We organized graph embedding techniques using a taxonomy that includes methods from manual feature engineering, matrix factorization, shallow neural networks, and deep graph convolutional networks. We evaluated these classes of algorithms for node classification, link prediction, clustering, and visualization tasks using widely used benchmark graphs. We designed our experiments on top of PyTorch Geometric and DGL libraries and run experiments on different multicore CPU and GPU platforms. We rigorously scrutinize the performance of embedding methods under various performance metrics and summarize the results. Thus, this paper may serve as a comparative guide to help users select methods that are most suitable for their tasks.
AI Key Findings
Get AI-generated insights about this paper's methodology, results, significance, and more — seven facets brought into focus.
Impact
Paper Details
Authors
PDF Preview
Key Terms
Citation Network
Current paper (gray), citations (green), references (blue)
Display is limited for performance on very large graphs.
Discussion 0