This paper introduces a data-centric methodology for abstracting tasks and constructing domain-agnostic taxonomic structures for time-stamped event sequences, validated through a real-world cybersecurity case study. The methodology comprises five phases and proposes a task typology using triples to describe actions, data targets, and criteria.
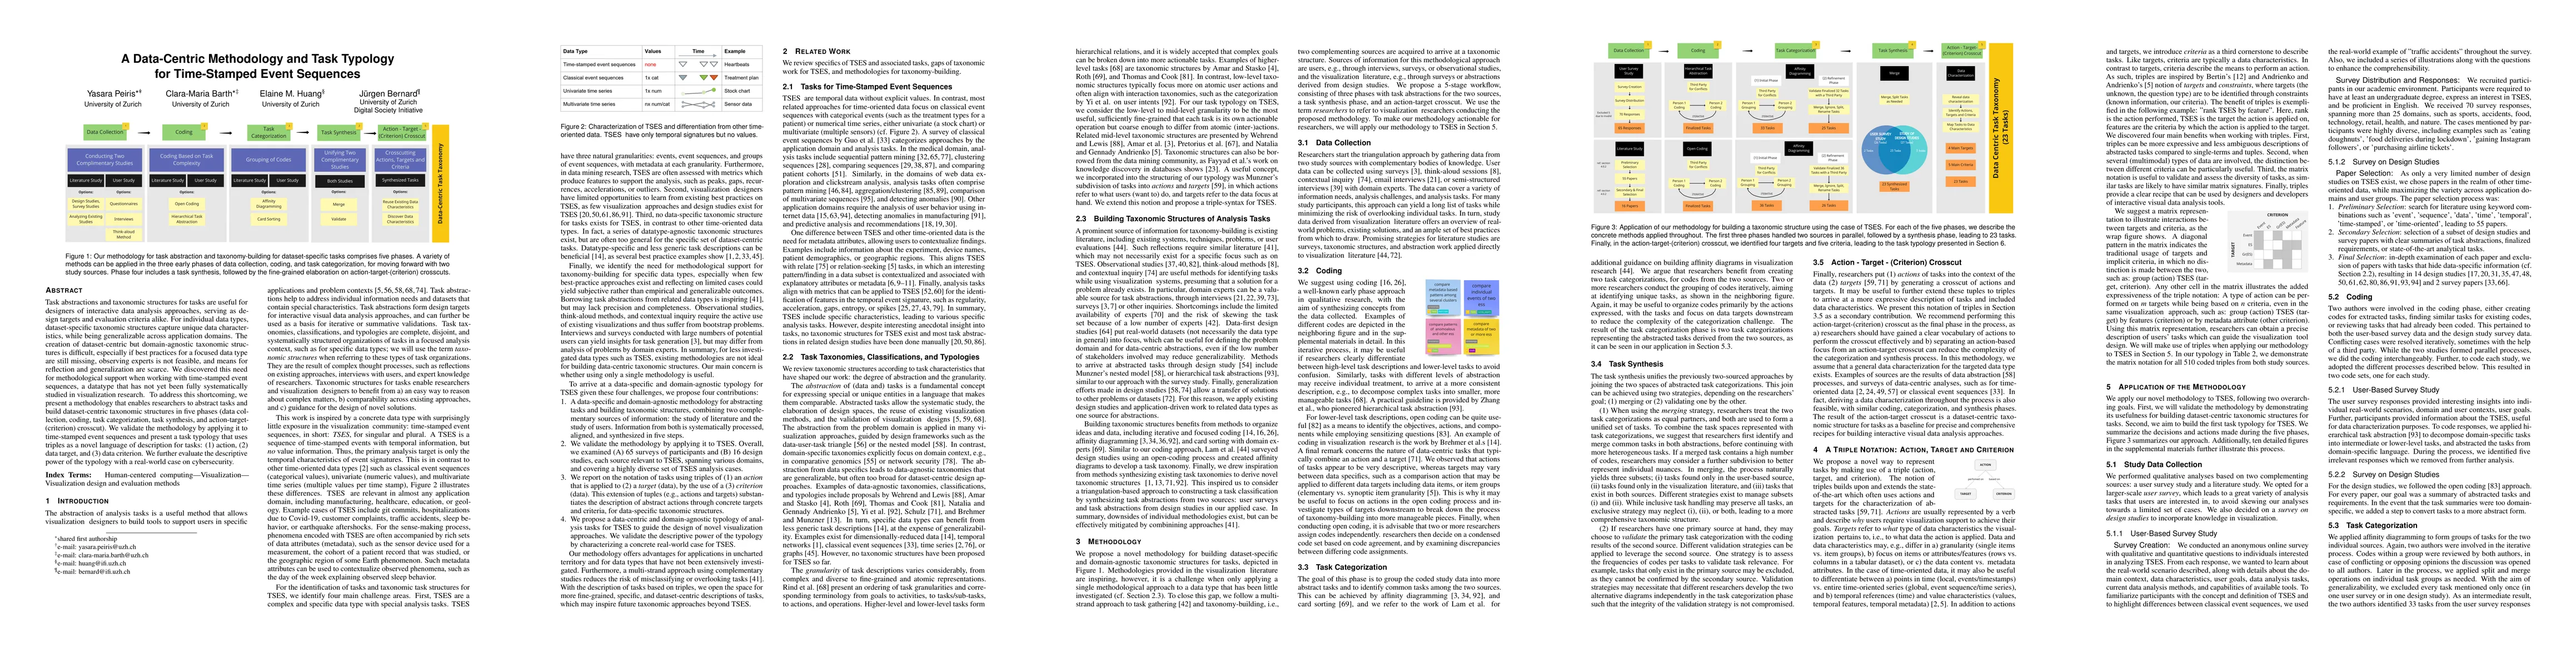
Task abstractions and taxonomic structures for tasks are useful for designers of interactive data analysis approaches, serving as design targets and evaluation criteria alike. For individual data types, dataset-specific taxonomic structures capture unique data characteristics, while being generalizable across application domains. The creation of dataset-centric but domain-agnostic taxonomic structures is difficult, especially if best practices for a focused data type are still missing, observing experts is not feasible, and means for reflection and generalization are scarce. We discovered this need for methodological support when working with time-stamped event sequences, a datatype that has not yet been fully systematically studied in visualization research. To address this shortcoming, we present a methodology that enables researchers to abstract tasks and build dataset-centric taxonomic structures in five phases (data collection, coding, task categorization, task synthesis, and action-target(criterion) crosscut). We validate the methodology by applying it to time-stamped event sequences and present a task typology that uses triples as a novel language of description for tasks: (1) action, (2) data target, and (3) data criterion. We further evaluate the descriptive power of the typology with a real-world case on cybersecurity.
Get AI-generated insights about this paper's methodology, results, and significance.
Current paper (gray), citations (green), references (blue)
Shahrzad Khayatbashi, Amin Jalali, Najmeh Miri et al.
Wil M. P. van der Aalst, Daniel Schuster, Jan Niklas Adams et al.
Stephan Mandt, Padhraic Smyth, Yuxin Chang et al.
Title | Authors | Year | Actions |
---|---|---|---|
A Multi-Level Task Framework for Event Sequence Analysis
|
Kazi Tasnim Zinat, Saimadhav Naga Sakhamuri, Aaron Sun Chen, Zhicheng Liu
|
2024
|
View Paper |
A Literature-based Visualization Task Taxonomy for Gantt Charts
|
Sayef Azad Sakin, Katherine E. Isaacs
|
2024
|
View Paper |
IVESA – Visual Analysis of Time-Stamped Event Sequences
|
J. Bernard, Clara-Maria Barth, Eduard Cuba, Andrea Meier, Yasara Peiris, Ben Shneiderman
|
2024
|
View Paper |
Interaction Tasks for Explainable Recommender Systems
|
M. Krone, S. Lenti, I. Al-Hazwani, Turki S Alahmadi, Kathrin Wardatzky, Oana Inel, Mennatallah El-Assady, J. Bernard
|
2023
|
View Paper |
Title | Authors | Year | Actions |
---|---|---|---|
A Visualization Approach for Monitoring Order Processing in E-Commerce Warehouse
|
Junxiu Tang, Yuhua Zhou, Tan Tang, Di Weng, Boyang Xie, Lingyun Yu, Huaqiang Zhang, Yingcai Wu
|
2021
|
View Paper |
IRVINE: A Design Study on Analyzing Correlation Patterns of Electrical Engines
|
Joscha Eirich, Jakob Bonart, Dominik Jackle, M. Sedlmair, Ute Schmid, K. Fischbach, Tobias Schreck, J. Bernard
|
2021
|
View Paper |
Sequen-C: A Multilevel Overview of Temporal Event Sequences
|
J. Magallanes, Tony Stone, Paul D. Morris, Suzanne Mason, Steven Wood, M. Villa-Uriol
|
2021
|
View Paper |
TimeRadar: Visualizing the Dynamics of Multivariate Communities via Timeline Views
|
Ngan V. T. Nguyen, Jon R. Hass, Tommy Dang
|
2021
|
View Paper |
ThreadStates: State-based Visual Analysis of Disease Progression
|
Qianwen Wang, T. Mazor, T. Harbig, E. Cerami, Nils Gehlenborg
|
2021
|
View Paper |
Data-First Visualization Design Studies
|
Michael Oppermann, T. Munzner
|
2020
|
View Paper |
Survey on Visual Analysis of Event Sequence Data
|
Yi Guo, Shunan Guo, Zhuochen Jin, Smiti Kaul, D. Gotz, Nan Cao
|
2020
|
View Paper |
Interactive Event Sequence Prediction for Marketing Analysts
|
F. Du, Shunan Guo, Sana Malik, Eunyee Koh, Sungchul Kim, Zhicheng Liu
|
2020
|
View Paper |
ViSeq: Visual Analytics of Learning Sequence in Massive Open Online Courses
|
Qing Chen, Xuanwu Yue, Xavier Plantaz, Yuanzhe Chen, Conglei Shi, T. Pong, Huamin Qu
|
2020
|
View Paper |
Comparative Visual Analytics for Assessing Medical Records with Sequence Embedding
|
Rongchen Guo, Takanori Fujiwara, Yiran Li, K. Lima, S. Sen, N. Tran, K. Ma
|
2020
|
View Paper |
VASABI: Hierarchical User Profiles for Interactive Visual User Behaviour Analytics
|
P. H. Nguyen, R. Henkin, Siming Chen, N. Andrienko, G. Andrienko, Olivier Thonnard, C. Turkay
|
2020
|
View Paper |
Understanding User Behaviour through Action Sequences: From the Usual to the Unusual
|
P. H. Nguyen, C. Turkay, G. Andrienko, N. Andrienko, Olivier Thonnard, Jihane Zouaoui
|
2019
|
View Paper |
EventAction
|
F. Du, C. Plaisant, N. Spring, K. Crowley, B. Shneiderman
|
2019
|
View Paper |
Exploratory Visual Sequence Mining Based on Pattern-Growth
|
K. Vrotsou, Aida Nordman
|
2019
|
View Paper |
Criteria for Rigor in Visualization Design Study
|
Miriah D. Meyer, J. Dykes
|
2019
|
View Paper |
Visual Analysis of High-Dimensional Event Sequence Data via Dynamic Hierarchical Aggregation
|
D. Gotz, Jonathan Zhang, Wenyuan Wang, Joshua Shrestha, D. Borland
|
2019
|
View Paper |
Visualizing Uncertainty and Alternatives in Event Sequence Predictions
|
Shunan Guo, F. Du, Sana Malik, Eunyee Koh, Sungchul Kim, Zhicheng Liu, Donghyun Kim, H. Zha, Nan Cao
|
2019
|
View Paper |
IDMVis: Temporal Event Sequence Visualization for Type 1 Diabetes Treatment Decision Support
|
Yixuan Zhang, Kartik Chanana, Cody Dunne
|
2019
|
View Paper |
A Visual Analytics Framework for the Detection of Anomalous Call Stack Trees in High Performance Computing Applications
|
C. Xie, W. Xu, K. Mueller
|
2019
|
View Paper |
Visual Progression Analysis of Event Sequence Data
|
Shunan Guo, Zhuochen Jin, D. Gotz, F. Du, H. Zha, Nan Cao
|
2019
|
View Paper |
CarePre
|
Zhuochen Jin, Jingshun Yang, Shuyuan Cui, D. Gotz, Jimeng Sun, Nan Cao
|
2018
|
View Paper |
Visual Analytics for Decomposing Temporal Event Series of Production Lines
|
Dominik Herr, Fabian Beck, Thomas Ertl
|
2018
|
View Paper |
Data Abstraction for Visualizing Large Time Series
|
Georgiy Shurkhovetskyy, N. Andrienko, G. Andrienko, G. Fuchs
|
2018
|
View Paper |
Constructing and Evaluating Visualisation Task Classifications: Process and Considerations
|
Natalie Kerracher, J. Kennedy
|
2017
|
View Paper |
Coping with Volume and Variety in Temporal Event Sequences: Strategies for Sharpening Analytic Focus
|
F. Du, B. Shneiderman, C. Plaisant, Sana Malik, Adam Perer
|
2017
|
View Paper |
CoreFlow: Extracting and Visualizing Branching Patterns from Event Sequences
|
Zhicheng Liu, Bernard Kerr, Mira Dontcheva, Justin Grover, Matthew Hoffman, Alan Wilson
|
2017
|
View Paper |
Design Study Contributions Come in Different Guises: Seven Guiding Scenarios
|
M. Sedlmair
|
2016
|
View Paper |
Task Cube: A three-dimensional conceptual space of user tasks in visualization design and evaluation
|
A. Rind, W. Aigner, Markus Wagner, S. Miksch, T. Lammarsch
|
2016
|
View Paper |
EventAction: Visual analytics for temporal event sequence recommendation
|
F. Du, C. Plaisant, N. Spring, B. Shneiderman
|
2016
|
View Paper |
Unsupervised Clickstream Clustering for User Behavior Analysis
|
G. Wang, Xinyi Zhang, Shiliang Tang, Haitao Zheng, Ben Y. Zhao
|
2016
|
View Paper |
High-Volume Hypothesis Testing
|
Sana Malik, B. Shneiderman, F. Du, C. Plaisant, M. Bjarnadóttir
|
2016
|
View Paper |
TimeSpan: Using Visualization to Explore Temporal Multi-dimensional Data of Stroke Patients
|
Mona Hosseinkhani Loorak, Charles Perin, N. Kamal, M. Hill, Sheelagh Carpendale
|
2016
|
View Paper |
TargetVue: Visual Analysis of Anomalous User Behaviors in Online Communication Systems
|
Nan Cao, Conglei Shi, Wan-Yi Sabrina Lin, Jie Lu, Y. Lin, Ching-Yung Lin
|
2016
|
View Paper |
Exploratory search in time-oriented primary data
|
J. Bernard
|
2015
|
View Paper |
A Task Taxonomy for Temporal Graph Visualisation
|
Natalie Kerracher, J. Kennedy, K. Chalmers
|
2015
|
View Paper |
VisInfo: a digital library system for time series research data based on exploratory search—a user-centered design approach
|
J. Bernard, Debora Daberkow, D. Fellner, Katrin Fischer, Oliver Köpler, J. Kohlhammer, M. Runnwerth, T. Ruppert, Tobias Schreck, Irina Sens
|
2015
|
View Paper |
MatrixWave: Visual Comparison of Event Sequence Data
|
Jian Zhao, Zhicheng Liu, Mira Dontcheva, Aaron Hertzmann, Alan Wilson
|
2015
|
View Paper |
Real-World Affinity Diagramming Practices: Bridging the Paper-Digital Gap
|
G. Harboe, E. Huang
|
2015
|
View Paper |
Cohort Comparison of Event Sequences with Balanced Integration of Visual Analytics and Statistics
|
Sana Malik, F. Du, M. Monroe, E. Onukwugha, C. Plaisant, B. Shneiderman
|
2015
|
View Paper |
Visualization Analysis and Design
|
T. Munzner
|
2014
|
View Paper |
Visualizing dimensionally-reduced data: interviews with analysts and a characterization of task sequences
|
M. Brehmer, M. Sedlmair, S. Ingram, T. Munzner
|
2014
|
View Paper |
#FluxFlow: Visual Analysis of Anomalous Information Spreading on Social Media
|
J. Zhao, Nan Cao, Zhen Wen, Yale Song, Y. Lin, C. Collins
|
2014
|
View Paper |
Progressive Visual Analytics: User-Driven Visual Exploration of In-Progress Analytics
|
Charles D. Stolper, Adam Perer, D. Gotz
|
2014
|
View Paper |
Design Activity Framework for Visualization Design
|
2014
|
||
Visual‐interactive Exploration of Interesting Multivariate Relations in Mixed Research Data Sets
|
J. Bernard, M. Steiger, S. Widmer, Hendrik Lücke-Tieke, T. May, J. Kohlhammer
|
2014
|
View Paper |
Tasks for Multivariate Network Analysis
|
J. Pretorius, H. Purchase, J. Stasko
|
2014
|
View Paper |
A Task Taxonomy for Network Evolution Analysis
|
Jae-wook Ahn, C. Plaisant, B. Shneiderman
|
2014
|
View Paper |
Frequence: interactive mining and visualization of temporal frequent event sequences
|
Adam Perer, Fei Wang
|
2014
|
View Paper |
A matter of time: Applying a data-users-tasks design triangle to visual analytics of time-oriented data
|
S. Miksch, W. Aigner
|
2014
|
View Paper |
A Design Space of Visualization Tasks
|
Hans-Jörg Schulz, T. Nocke, M. Heitzler, H. Schumann
|
2013
|
View Paper |
A Multi-Level Typology of Abstract Visualization Tasks
|
M. Brehmer, T. Munzner
|
2013
|
View Paper |
An Empirically-Derived Taxonomy of Interaction Primitives for Interactive Cartography and Geovisualization
|
R. Roth
|
2013
|
View Paper |
Design Study Methodology: Reflections from the Trenches and the Stacks
|
M. Sedlmair, Miriah D. Meyer, T. Munzner
|
2012
|
View Paper |
Enterprise Data Analysis and Visualization: An Interview Study
|
Sean Kandel, A. Paepcke, J. Hellerstein, Jeffrey Heer
|
2012
|
View Paper |
Visual cluster exploration of web clickstream data
|
Jishang Wei, Zeqian Shen, Neel Sundaresan, K. Ma
|
2012
|
View Paper |
Guided discovery of interesting relationships between time series clusters and metadata properties
|
J. Bernard, T. Ruppert, Maximilian Scherer, Tobias Schreck, J. Kohlhammer
|
2012
|
View Paper |
Content-based layouts for exploratory metadata search in scientific research data
|
J. Bernard, T. Ruppert, Maximilian Scherer, J. Kohlhammer, Tobias Schreck
|
2012
|
View Paper |
Characterizing the intelligence analysis process: Informing visual analytics design through a longitudinal field study
|
Youn ah Kang, J. Stasko
|
2011
|
View Paper |
CloudLines: Compact Display of Event Episodes in Multiple Time-Series
|
Milos Krstajic, E. Bertini, D. Keim
|
2011
|
View Paper |
Visualization of Time-Oriented Data
|
W. Aigner, S. Miksch, H. Schumann, C. Tominski
|
2011
|
View Paper |
Semiology of Graphics - Diagrams, Networks, Maps
|
Jacques Bertin, William J. Berg
|
2010
|
View Paper |
Measuring Similarity between Sets of Overlapping Clusters
|
M. Goldberg, Mykola Hayvanovych, M. Magdon-Ismail
|
2010
|
View Paper |
A Nested Model for Visualization Design and Validation
|
T. Munzner
|
2009
|
View Paper |
MizBee: A Multiscale Synteny Browser
|
Miriah D. Meyer, T. Munzner, H. Pfister
|
2009
|
View Paper |
Temporal Summaries: Supporting Temporal Categorical Searching, Aggregation and Comparison
|
T. Wang, C. Plaisant, B. Shneiderman, N. Spring, David Roseman, Greg Marchand, Vikramjit Mukherjee, Mark S. Smith
|
2009
|
View Paper |
Qualitative analysis of visualization: a building design field study
|
Melanie Tory, S. Staub-French
|
2008
|
View Paper |
Grounded evaluation of information visualizations
|
Petra Isenberg, T. Zuk, C. Collins, Sheelagh Carpendale
|
2008
|
View Paper |
Toward a Deeper Understanding of the Role of Interaction in Information Visualization
|
Ji Soo Yi, Youn ah Kang, J. Stasko, J. Jacko
|
2007
|
View Paper |
Task taxonomy for graph visualization
|
Bongshin Lee, C. Plaisant, C. Parr, Jean-Daniel Fekete, N. Riche
|
2006
|
View Paper |
Constructing grounded theory : A practical guide through qualitative analysis
|
Eva Brink, L. Dellve, U. Hallberg, Kajsa H. Abrahamsson, Gunilla Klingberg, Kerstin Wentz
|
2006
|
View Paper |
Exploratory analysis of spatial and temporal data - a systematic approach
|
N. Andrienko
|
2005
|
View Paper |
Low-level components of analytic activity in information visualization
|
R. Amar, James R. Eagan, J. Stasko
|
2005
|
View Paper |
Knowledge precepts for design and evaluation of information visualizations
|
R. Amar, J. Stasko
|
2005
|
View Paper |
Visualization methods for time-dependent data - an overview
|
Wolfgang Müller, H. Schumann
|
2003
|
View Paper |
Enhancing Effectiveness of Outlier Detections for Low Density Patterns
|
Jian Tang, Zhixiang Chen, A. Fu, D. Cheung
|
2002
|
View Paper |
Pattern Extraction for Time Series Classification
|
P. Geurts
|
2001
|
View Paper |
The eyes have it: a task by data type taxonomy for information visualizations
|
B. Shneiderman
|
1996
|
View Paper |
From Data Mining to Knowledge Discovery in Databases
|
U. Fayyad, G. Piatetsky-Shapiro, Padhraic Smyth
|
1996
|
View Paper |
How Maps Work - Representation, Visualization, and Design
|
A. Maceachren
|
1995
|
View Paper |
A problem-oriented classification of visualization techniques
|
Stephen Wehrend, C. Lewis
|
1990
|
View Paper |
The Discovery of Grounded Theory: Strategies for Qualitative Research
|
C. Brodsky
|
1968
|
View Paper |
An Introduction to Grounded Theory with a Special Focus on Axial Coding and the Coding Paradigm
|
Maike Vollstedt, Sebastian Rezat
|
2019
|
View Paper |
Bridging from Goals to Tasks with Design Study Analysis Reports
|
Heidi Lam, Melanie Tory, T. Munzner
|
2018
|
View Paper |
EventThread: Visual Summarization and Stage Analysis of Event Sequence Data
|
Shunan Guo, Ke Xu, Rongwen Zhao, D. Gotz, H. Zha, Nan Cao
|
2018
|
View Paper |
Comparing Visual-Interactive Labeling with Active Learning: An Experimental Study
|
J. Bernard, M. Hutter, M. Zeppelzauer, D. Fellner, M. Sedlmair
|
2018
|
View Paper |
Patterns and Sequences: Interactive Exploration of Clickstreams to Understand Common Visitor Paths
|
Zhicheng Liu, Yang Wang, Mira Dontcheva, Matthew Hoffman, Seth Walker, Alan Wilson
|
2017
|
View Paper |
ViDX: Visual Diagnostics of Assembly Line Performance in Smart Factories
|
Panpan Xu, Honghui Mei, Liu Ren, Wei Chen
|
2017
|
View Paper |
The diversity of data and tasks in event analytics
|
2016
|
||
Card Sorting Techniques for Domain Characterization in Problem-driven Visualization Research
|
Ryo Sakai, J. Aerts
|
2015
|
View Paper |
Dimensionality Reduction in the Wild : Gaps and Guidance
|
M. Sedlmair, M. Brehmer, S. Ingram, T. Munzner
|
2012
|
View Paper |
Semiology of Graphics - Diagrams, Networks, Maps
|
Jacques Bertin
|
2010
|
View Paper |
A task-centered visualization design environment and a method for measuring the complexity of visualization designs
|
Ying Zhu, Xiaoyuan Suo
|
2009
|
View Paper |
Different Types of „Times“ in GIS
|
A. Frank
|
2007
|
View Paper |
Constructing grounded theory : a practical guide through qualitative analysis
|
Kathy Charmaz
|
2006
|
View Paper |
Illuminating the Path: The Research and Development Agenda for Visual Analytics
|
James J. Thomas, Kristin A. Cook
|
2005
|
View Paper |
Feature-based classification of time-series data
|
A. Nanopoulos, R. Alcock, Y. Manolopoulos
|
2001
|
View Paper |
Contextual design - defining customer-centered systems
|
H. Beyer, K. Holtzblatt
|
1998
|
View Paper |
Enhancing the Effectiveness
|
Joann Larsen, D. Hepworth
|
1982
|
View Paper |
The Discovery of Grounded Theory
|
A. Strauss, B. Glaser
|
1967
|
View Paper |
Secondary Selection : selection of a subset of design studies and survey papers with clear summaries of task abstractions, finalized requirements, or state-of-the-art analytical tasks
|
Showing first page preview. Click "Open Full PDF" to view the complete paper.
Your comment contains inappropriate language and has been rejected.
Are you sure you want to remove this tag? This action cannot be undone.
Someone just favorited a paper!
Comments (0)