Publication
Published:
Jun 03, 2010
Updated:
Jun 01, 2025
Categories:
math.PR, math.ST, stat.TH
Metrics
Citations:
123
Source:
ArXiv
Paper Preview
Abstract
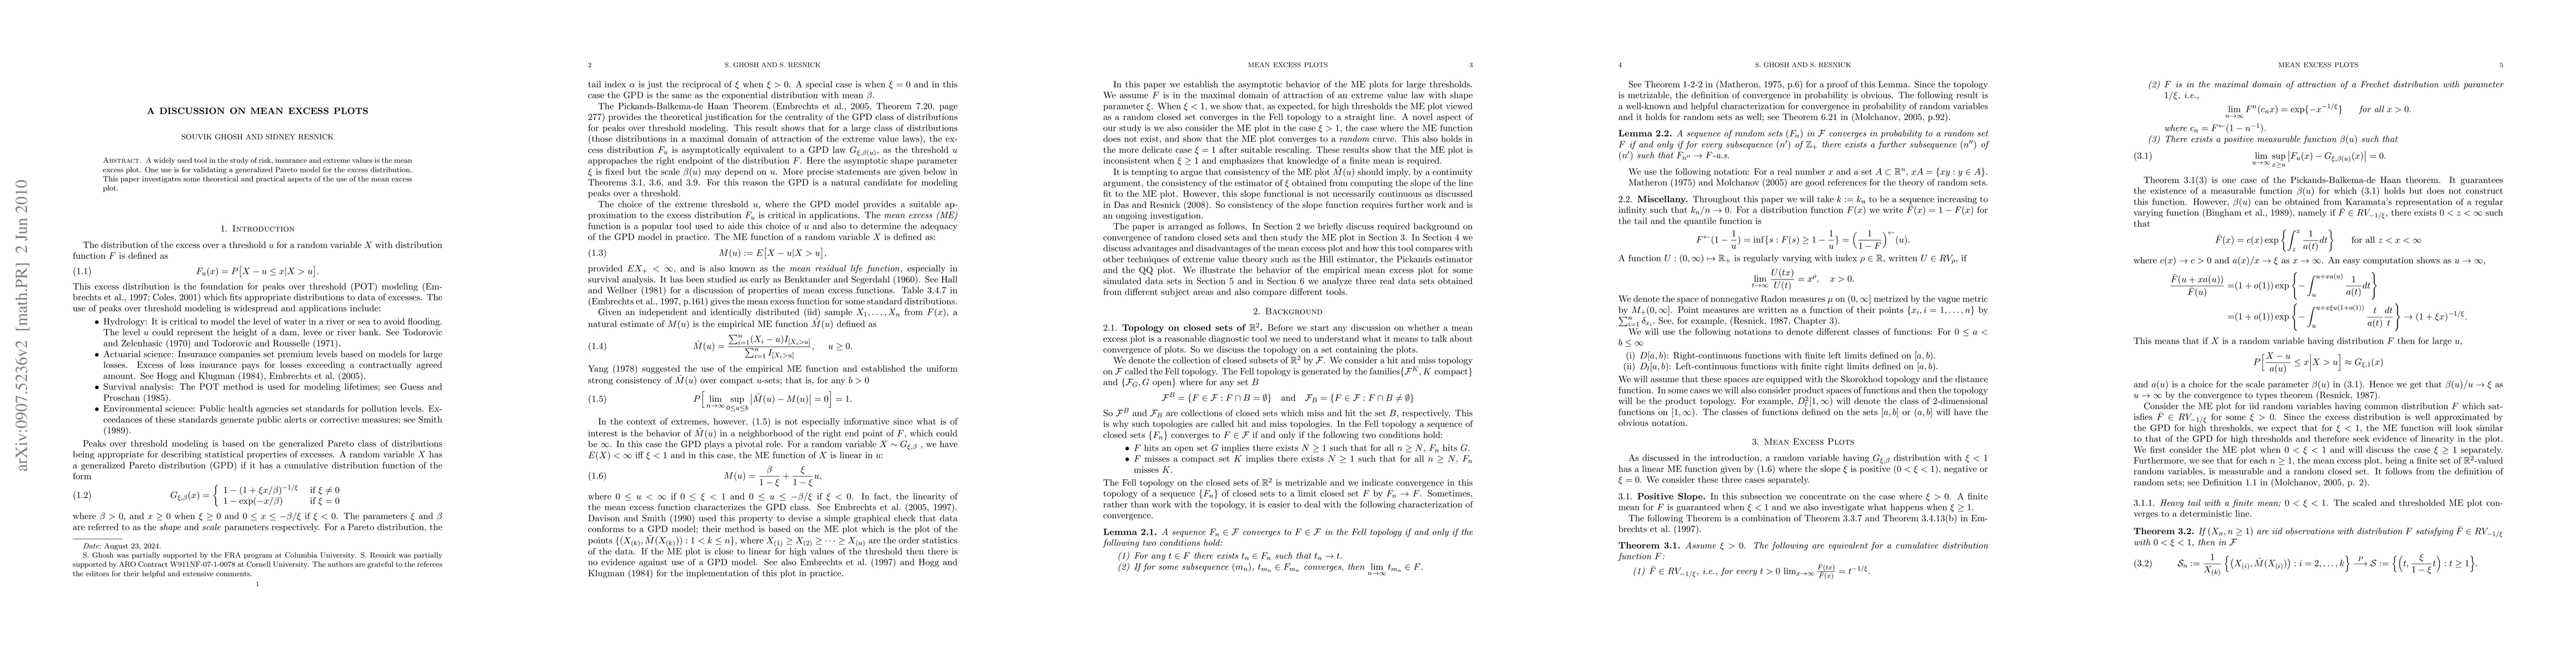
A widely used tool in the study of risk, insurance and extreme values is the mean excess plot. One use is for validating a generalized Pareto model for the excess distribution. This paper investigates some theoretical and practical aspects of the use of the mean excess plot.
AI Key Findings
Get AI-generated insights about this paper's methodology, results, significance, and more — seven facets brought into focus.
Impact
123
Citations
32
References
11
Influential
Paper Details
Paper ID:
0907.5236
License:
http://arxiv.org/licenses/nonexclusive-distrib/1.0/
Comments:
26 pages, 9 figures
Categories:
math.PR
math.ST
stat.TH
PDF Preview
Key Terms
excess
(0.519)
mean
(0.306)
investigates
(0.269)
widely used
(0.246)
extreme
(0.235)
risk
(0.235)
aspects
(0.226)
use
(0.223)
Citation Network
Current paper (gray), citations (green), references (blue)
Display is limited for performance on very large graphs.
Current Paper
Citations
References
Click to view
Discussion 0