A grammar of graphics framework for generalized parallel coordinate plots
Publication
Metrics
AI Quick Summary
This paper introduces generalized parallel coordinate plots (GPCP) to extend the utility of parallel coordinate plots for mixed categorical and numeric data, offering more flexibility than existing solutions like hammock plots. The new framework is implemented in the R package ggpcp.
Paper Preview
Abstract
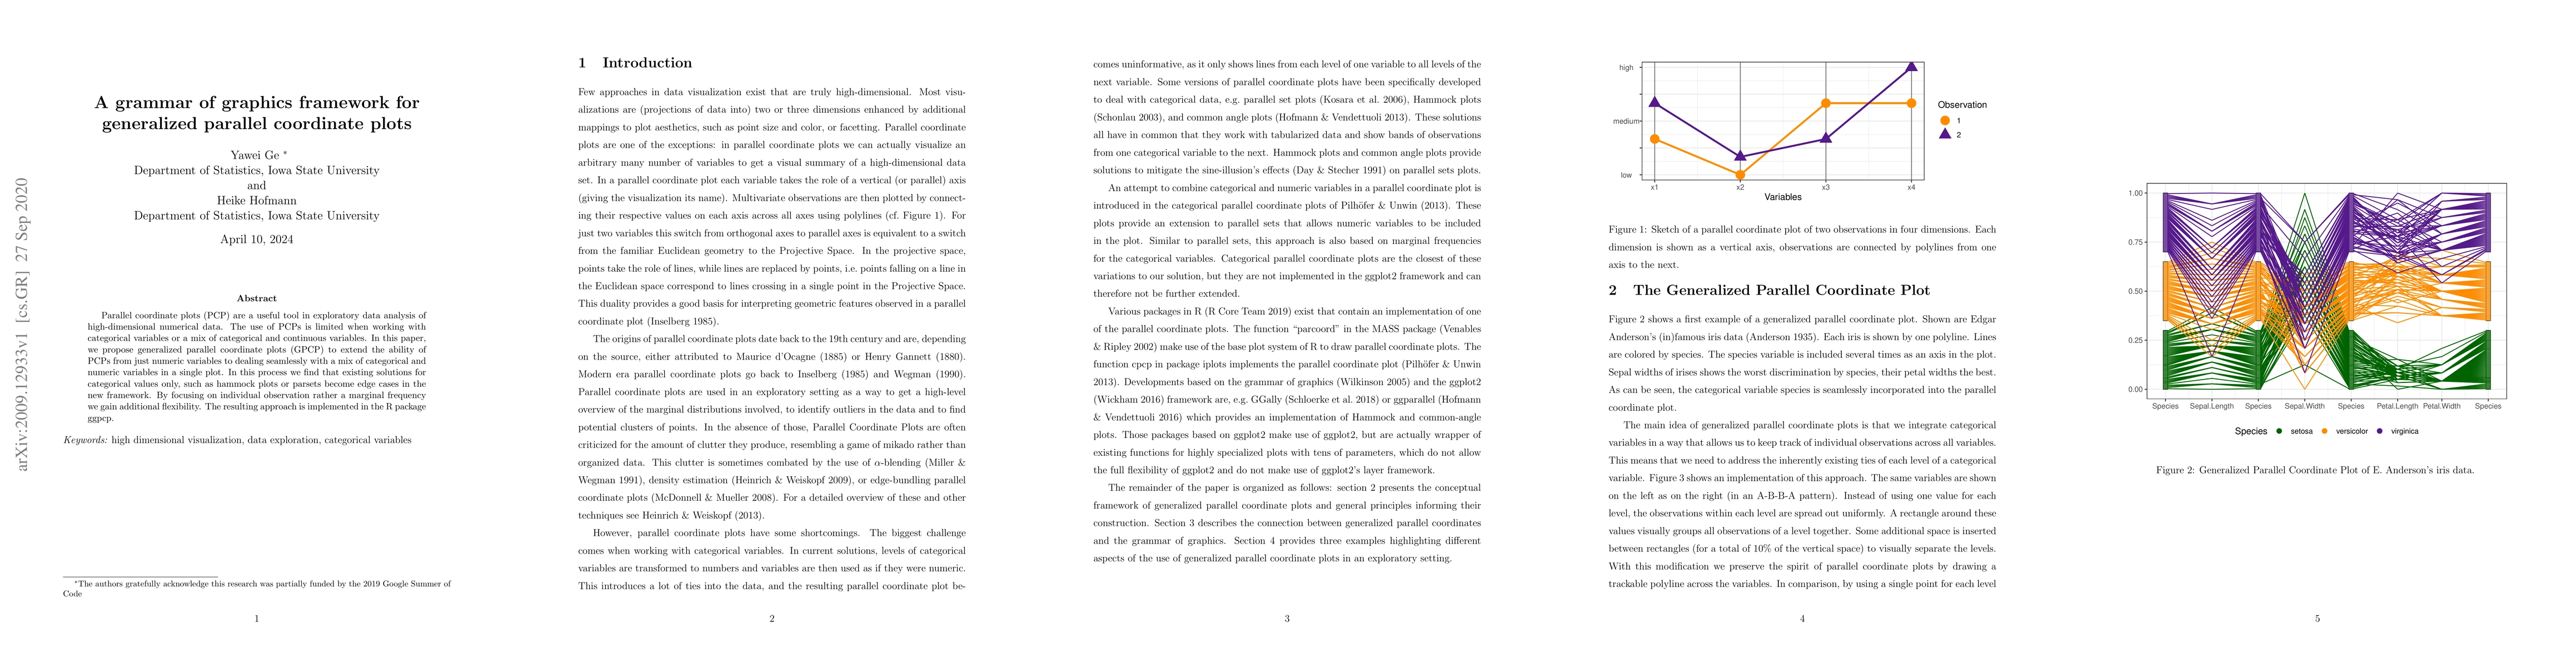
Parallel coordinate plots (PCP) are a useful tool in exploratory data analysis of high-dimensional numerical data. The use of PCPs is limited when working with categorical variables or a mix of categorical and continuous variables. In this paper, we propose generalized parallel coordinate plots (GPCP) to extend the ability of PCPs from just numeric variables to dealing seamlessly with a mix of categorical and numeric variables in a single plot. In this process we find that existing solutions for categorical values only, such as hammock plots or parsets become edge cases in the new framework. By focusing on individual observation rather a marginal frequency we gain additional flexibility. The resulting approach is implemented in the R package ggpcp.
AI Key Findings
Get AI-generated insights about this paper's methodology, results, significance, and more — seven facets brought into focus.
Impact
Paper Details
Authors
PDF Preview
Key Terms
Citation Network
Current paper (gray), citations (green), references (blue)
Display is limited for performance on very large graphs.
Discussion 0