Preference-Optimal Multi-Metric Weighting for Parallel Coordinate Plots
Publication
Metrics
Paper Preview
Abstract
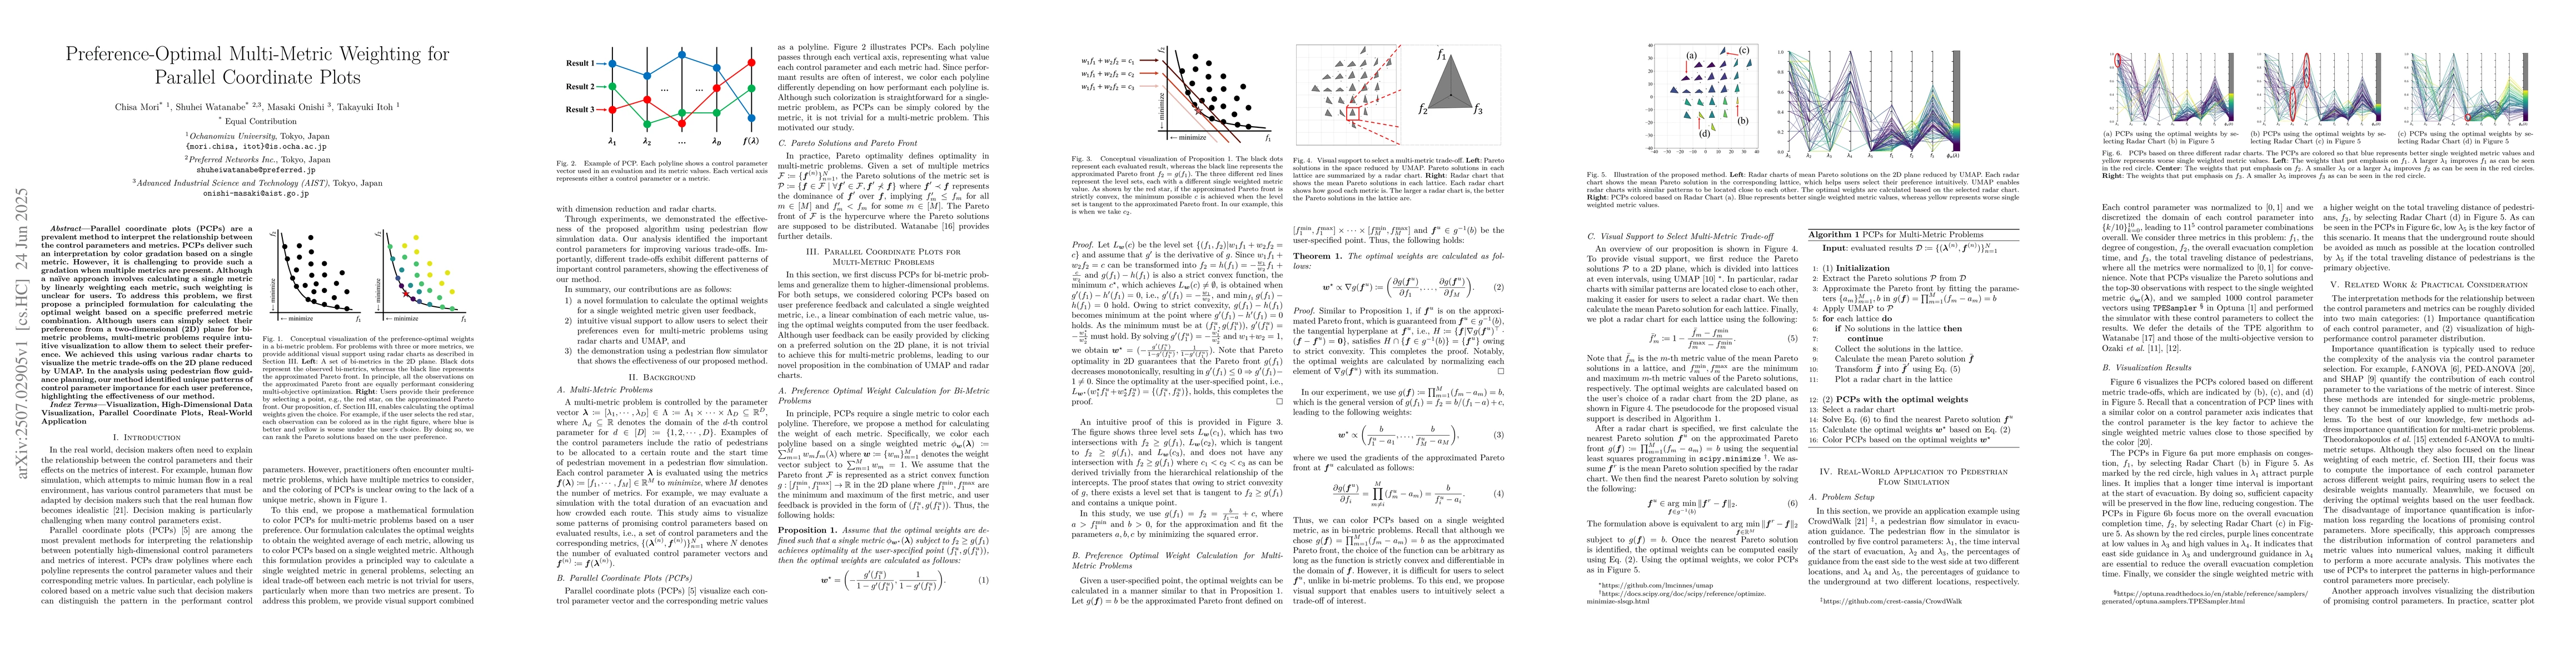
Parallel coordinate plots (PCPs) are a prevalent method to interpret the relationship between the control parameters and metrics. PCPs deliver such an interpretation by color gradation based on a single metric. However, it is challenging to provide such a gradation when multiple metrics are present. Although a naive approach involves calculating a single metric by linearly weighting each metric, such weighting is unclear for users. To address this problem, we first propose a principled formulation for calculating the optimal weight based on a specific preferred metric combination. Although users can simply select their preference from a two-dimensional (2D) plane for bi-metric problems, multi-metric problems require intuitive visualization to allow them to select their preference. We achieved this using various radar charts to visualize the metric trade-offs on the 2D plane reduced by UMAP. In the analysis using pedestrian flow guidance planning, our method identified unique patterns of control parameter importance for each user preference, highlighting the effectiveness of our method.
AI Key Findings
Get AI-generated insights about this paper's methodology, results, significance, and more — seven facets brought into focus.
Impact
Paper Details
Authors
PDF Preview
Citation Network
Current paper (gray), citations (green), references (blue)
Display is limited for performance on very large graphs.
Discussion 0