A Graphical-Based Method for Plotting Local Bifurcation Diagram
Publication
Metrics
Paper Preview
Abstract
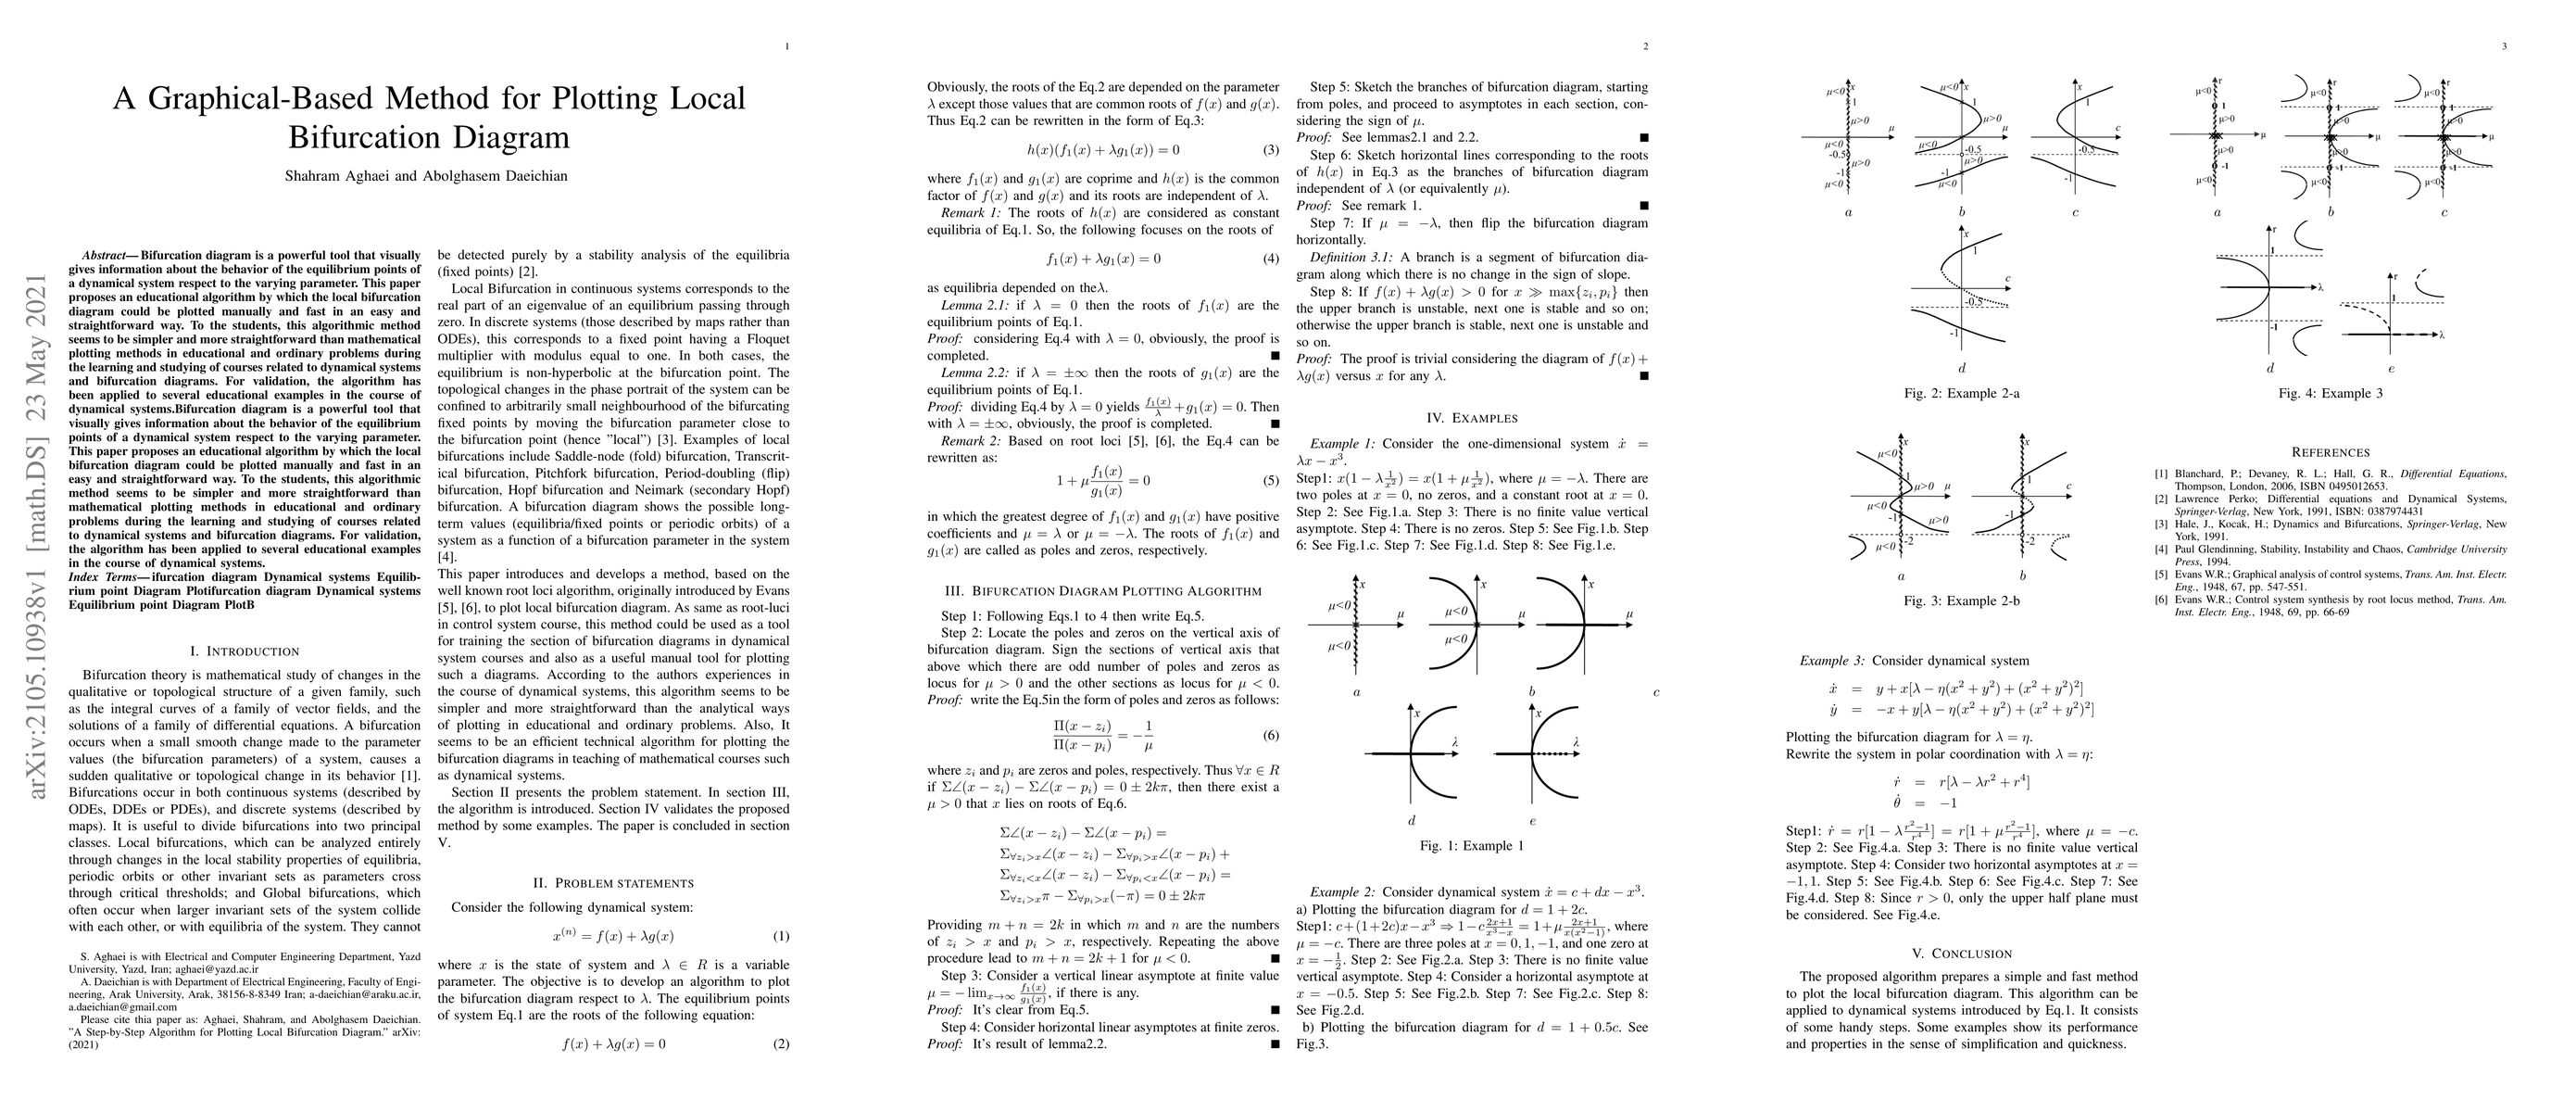
Bifurcation diagram is a powerful tool that visually gives information about the behavior of the equilibrium points of a dynamical system respect to the varying parameter. This paper proposes an educational algorithm by which the local bifurcation diagram could be plotted manually and fast in an easy and straightforward way. To the students, this algorithmic method seems to be simpler and more straightforward than mathematical plotting methods in educational and ordinary problems during the learning and studying of courses related to dynamical systems and bifurcation diagrams. For validation, the algorithm has been applied to several educational examples in the course of dynamical systems.
AI Key Findings
Get AI-generated insights about this paper's methodology, results, significance, and more — seven facets brought into focus.
Impact
Paper Details
Authors
PDF Preview
Key Terms
Citation Network
Current paper (gray), citations (green), references (blue)
Display is limited for performance on very large graphs.
Discussion 0