Superplot: a graphical interface for plotting and analysing MultiNest output
Publication
Metrics
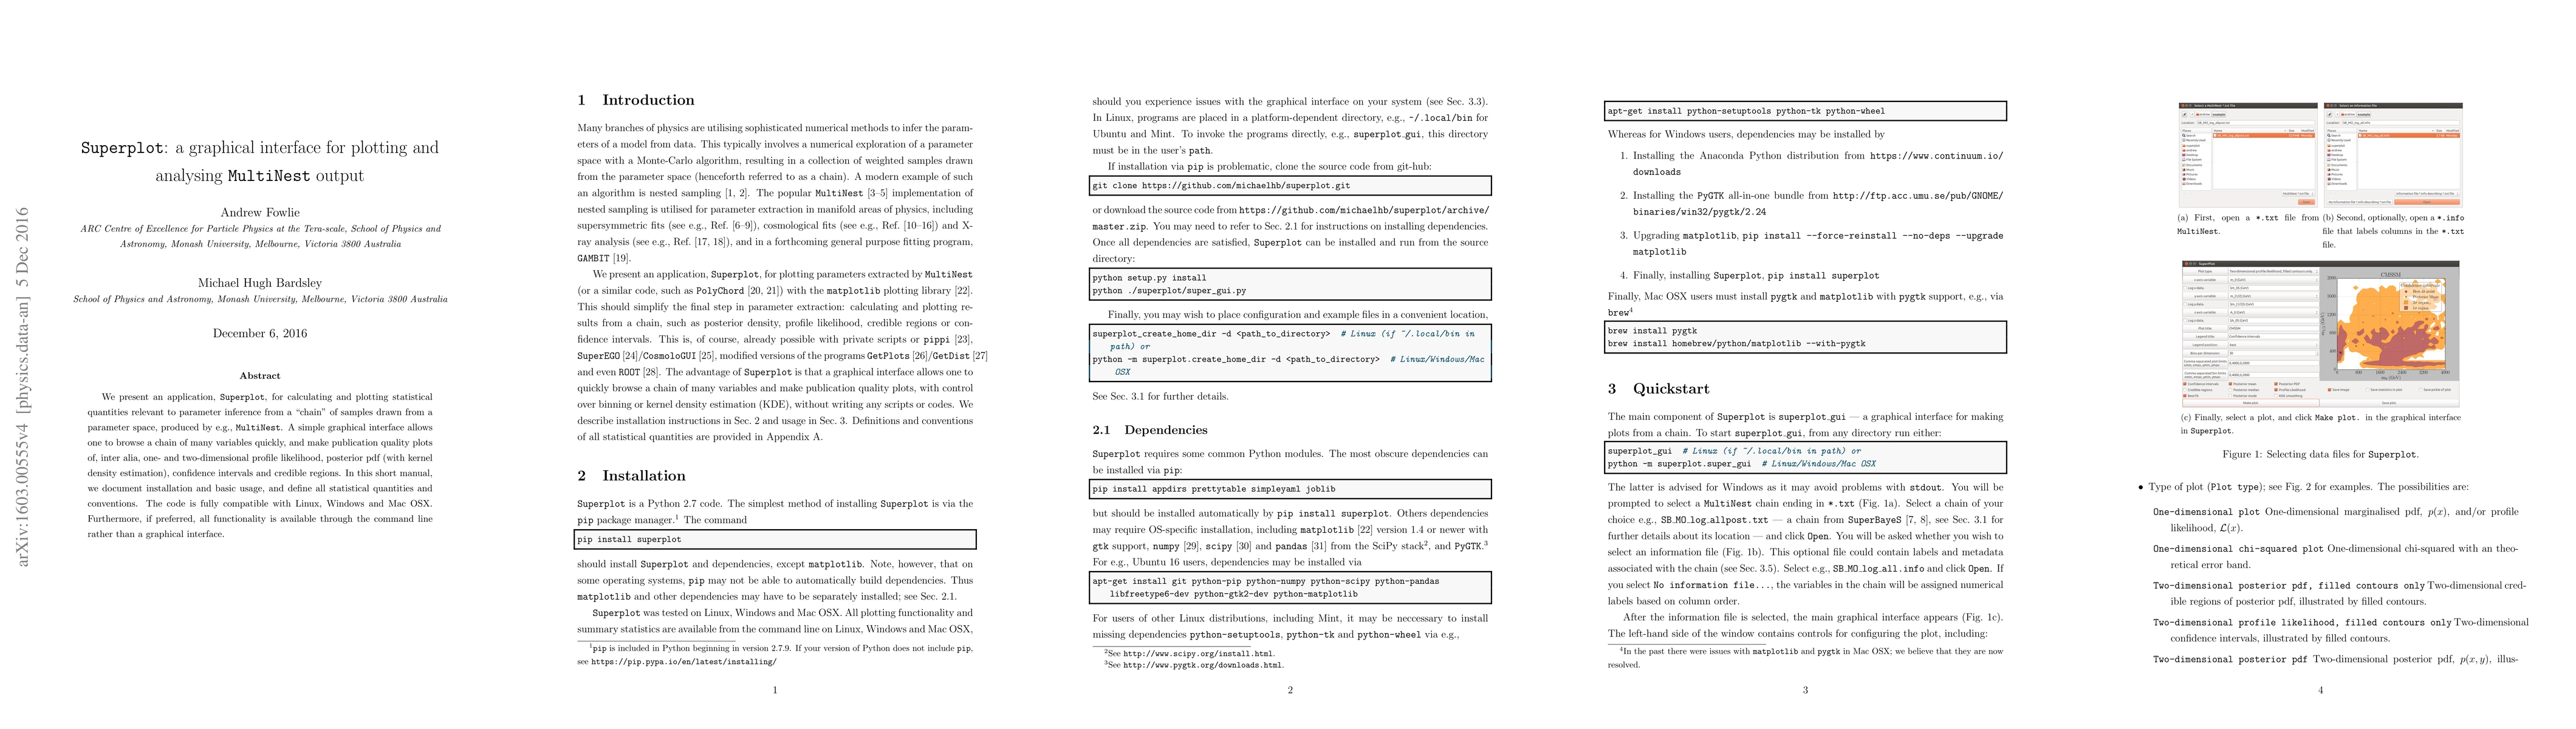
Paper Preview
Abstract
We present an application, Superplot, for calculating and plotting statistical quantities relevant to parameter inference from a "chain" of samples drawn from a parameter space, produced by e.g. MultiNest. A simple graphical interface allows one to browse a chain of many variables quickly, and make publication quality plots of, inter alia, one- and two-dimensional profile likelihood, posterior pdf (with kernel density estimation), confidence intervals and credible regions. In this short manual, we document installation and basic usage, and define all statistical quantities and conventions. The code is fully compatible with Linux, Windows and Mac OSX. Furthermore, if preferred, all functionality is available through the command line rather than a graphical interface.
AI Key Findings
Get AI-generated insights about this paper's methodology, results, significance, and more — seven facets brought into focus.
Impact
Paper Details
PDF Preview
Key Terms
Citation Network
Current paper (gray), citations (green), references (blue)
Display is limited for performance on very large graphs.
Discussion 0