A Graphical Workflow Exploration Environment For Visual Analytics
Publication
Metrics
AI Quick Summary
This paper presents a graphical workflow exploration environment designed to enhance visual analytics by supporting complex workflows, collaboration, and error recovery. Through a design study and evaluation via case study and user study, the authors demonstrate the environment's effectiveness in aiding analysts in reviewing, editing, and navigating their workflows.
Paper Preview
Abstract
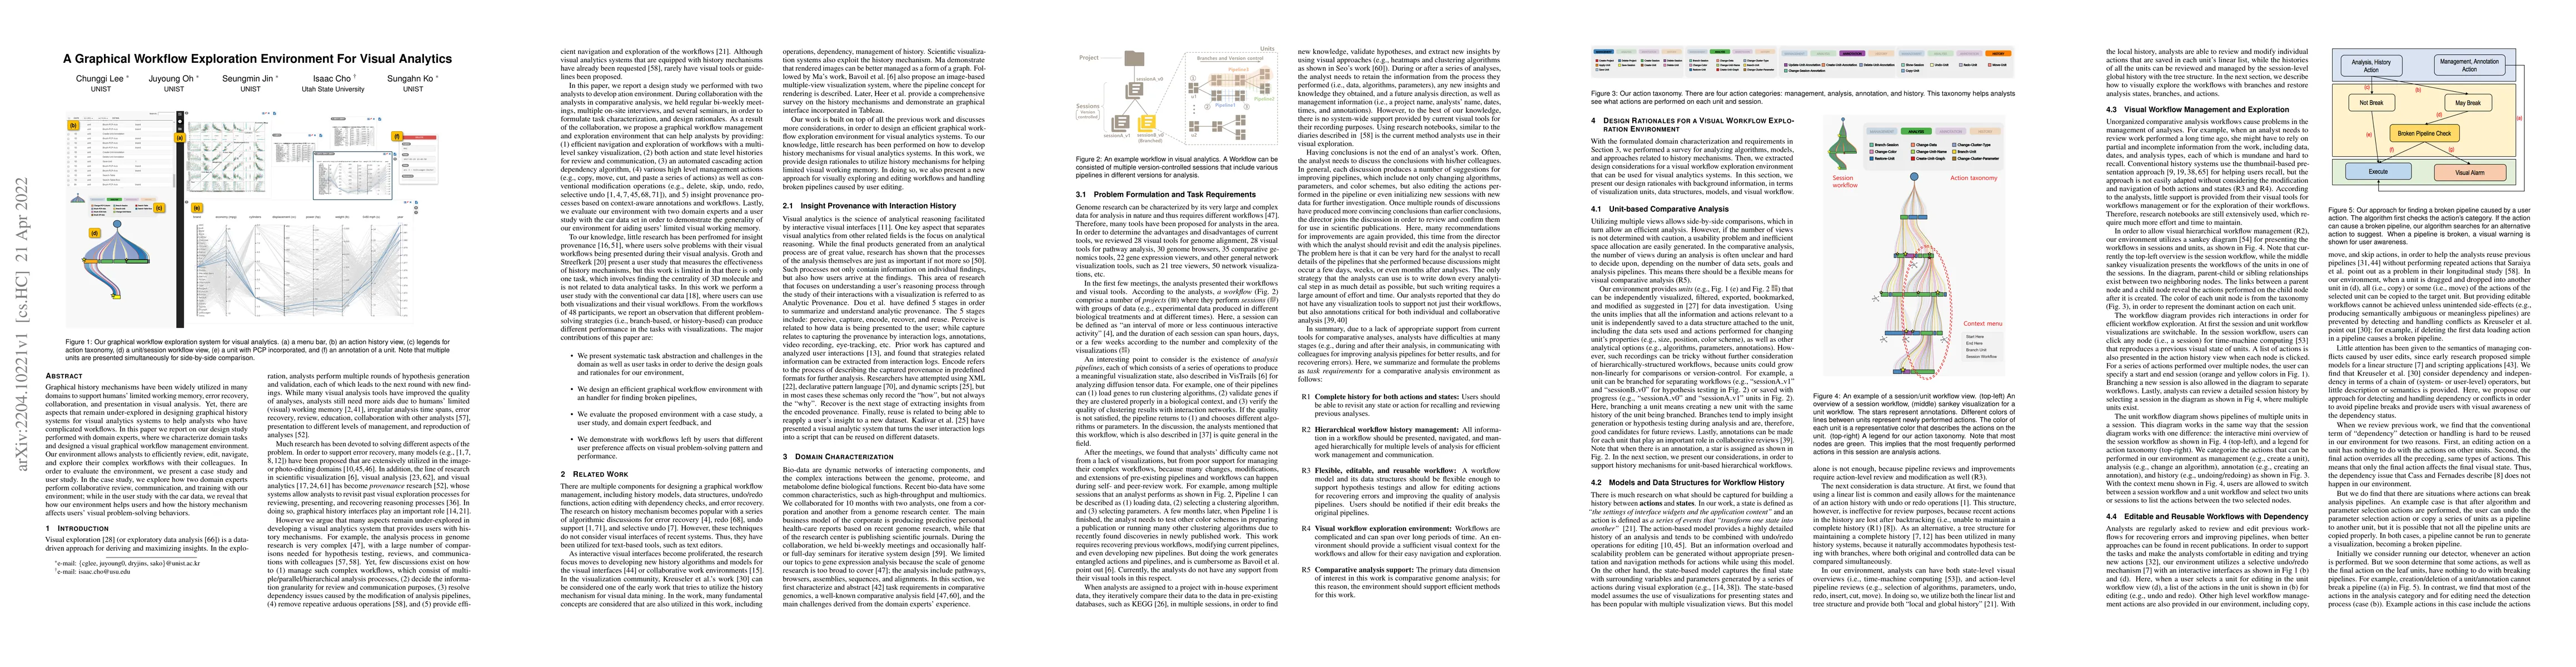
Graphical history mechanisms have been widely utilized in many domains to support humans' limited working memory, error recovery, collaboration, and presentation in visual analysis. Yet, there are aspects that remain under-explored in designing graphical history systems for visual analytics systems to help analysts who have complicated workflows. In this paper we report on our design study performed with domain experts, where we characterize domain tasks and designed a visual graphical workflow management environment. Our environment allows analysts to efficiently review, edit, navigate, and explore their complex workflows with their colleagues. In order to evaluate the environment, we present a case study and user study. In the case study, we explore how two domain experts perform collaborative review, communication, and training with our environment; while in the user study with the car data, we reveal that how our environment helps users and how the history mechanism affects users' visual problem-solving behaviors.
AI Key Findings
Get AI-generated insights about this paper's methodology, results, significance, and more — seven facets brought into focus.
Impact
Paper Details
Authors
PDF Preview
Key Terms
Citation Network
Current paper (gray), citations (green), references (blue)
Display is limited for performance on very large graphs.
Discussion 0