ArxivLens

Quick Summary:

This paper presents Hyper-Matrix, a visual analytics technique for exploring temporal hypergraph models, integrating machine learning with interactive visualizations to facilitate scalable and effective model exploration. The method supports detailed analysis and refinement through various interactive features, demonstrating superior performance in a case study with law enforcement data.

Journal Reference: IEEE Transactions on Visualization and Computer Graphics, 2020
DOI: 10.1109/TVCG.2020.3030408
arXiv Id: 2008.07299
Comments: 11 pages, 6 figures, IEEE VIS VAST 2020 - IEEE Transactions on Visualization and Computer Graphics
Date Published: 2021-05-12
Date Updated: 2021-05-12

Categories:

Key Terms (TF-IDF):

interactive (0.260)
technique (0.171)
scalability (0.164)
exploration (0.161)
visual (0.143)
matrix (0.142)
temporal (0.137)
user (0.137)
graphs (0.134)
challenge (0.132)
search (0.131)
steering (0.118)
gene (0.114)
learning model (0.110)
hyper (0.108)
connect (0.108)
based (0.105)
experts (0.104)
eliminate (0.104)
refinement (0.103)
License: http://arxiv.org/licenses/nonexclusive-distrib/1.0/

Summary:

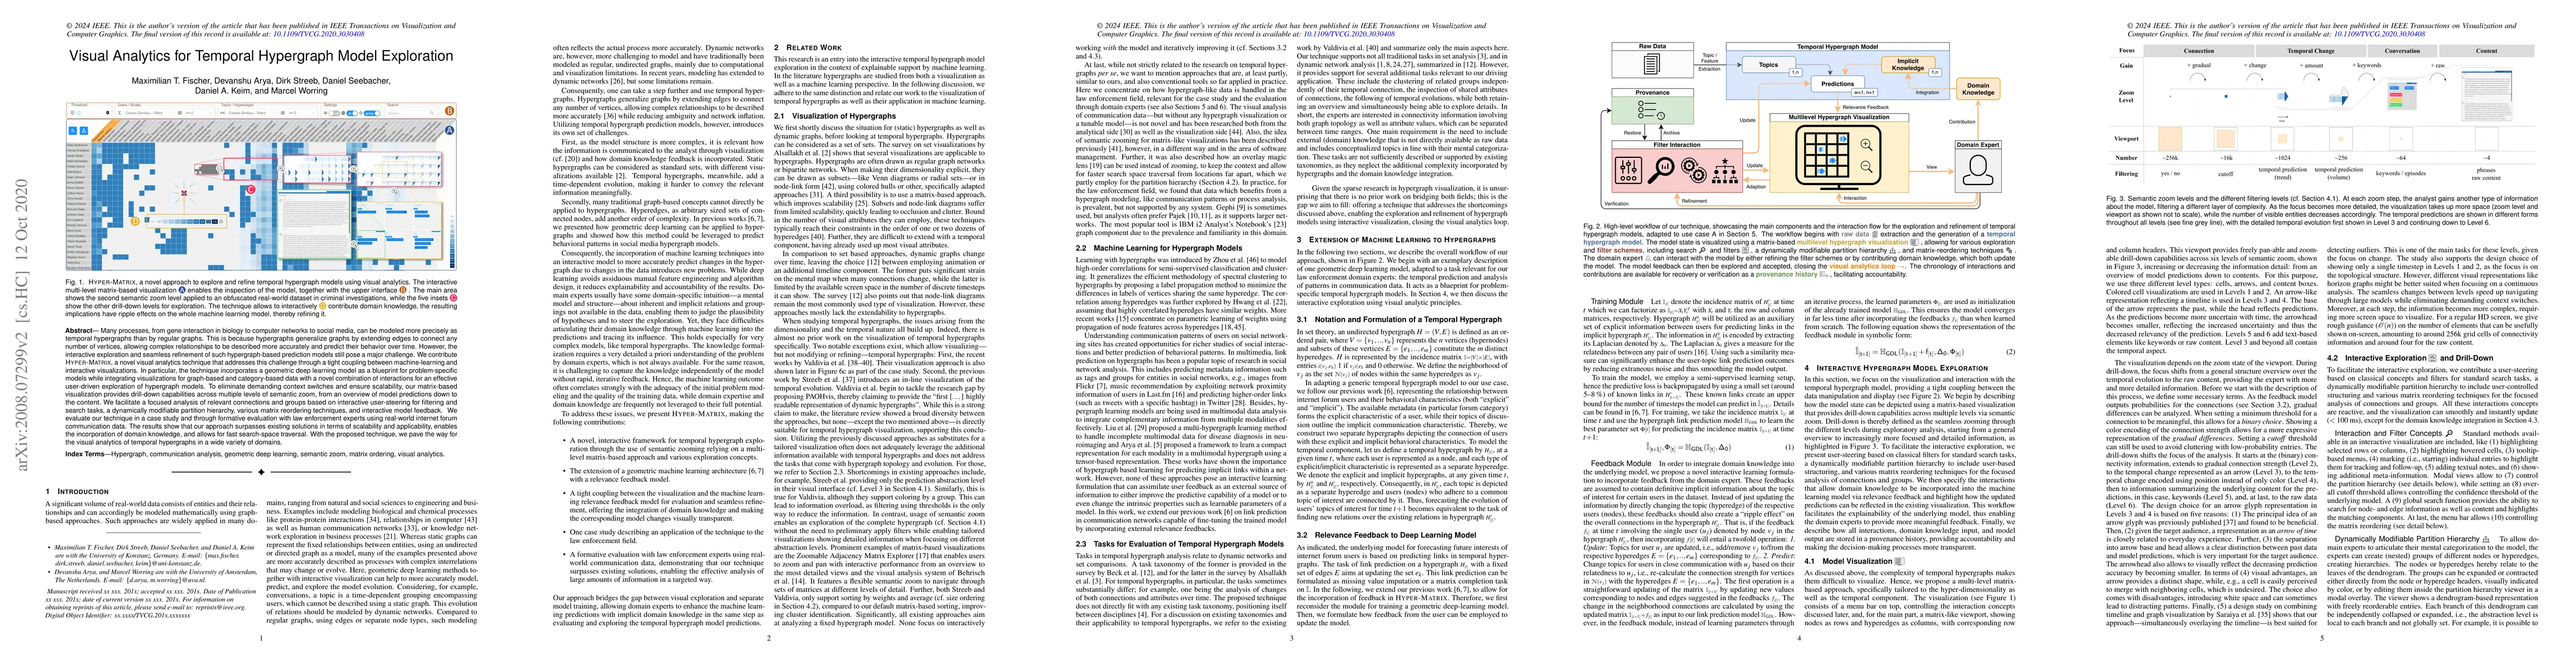
Many processes, from gene interaction in biology to computer networks to social media, can be modeled more precisely as temporal hypergraphs than by regular graphs. This is because hypergraphs generalize graphs by extending edges to connect any number of vertices, allowing complex relationships to be described more accurately and predict their behavior over time. However, the interactive exploration and seamless refinement of such hypergraph-based prediction models still pose a major challenge. We contribute Hyper-Matrix, a novel visual analytics technique that addresses this challenge through a tight coupling between machine-learning and interactive visualizations. In particular, the technique incorporates a geometric deep learning model as a blueprint for problem-specific models while integrating visualizations for graph-based and category-based data with a novel combination of interactions for an effective user-driven exploration of hypergraph models. To eliminate demanding context switches and ensure scalability, our matrix-based visualization provides drill-down capabilities across multiple levels of semantic zoom, from an overview of model predictions down to the content. We facilitate a focused analysis of relevant connections and groups based on interactive user-steering for filtering and search tasks, a dynamically modifiable partition hierarchy, various matrix reordering techniques, and interactive model feedback. We evaluate our technique in a case study and through formative evaluation with law enforcement experts using real-world internet forum communication data. The results show that our approach surpasses existing solutions in terms of scalability and applicability, enables the incorporation of domain knowledge, and allows for fast search-space traversal. With the technique, we pave the way for the visual analytics of temporal hypergraphs in a wide variety of domains.

Citation & Reference Network Visualization

This graph shows how this paper is connected to other research. The current paper is shown in dark gray, papers that cite it are in green, and papers it references are in blue. You can:

Current Paper
Papers citing this work (Citations)
Papers cited by this work (References)

• Hover over any node to see the paper title

• Click a node to view that paper's details

• Drag nodes to rearrange the graph

• Use the zoom controls (bottom right) to zoom in/out

Citations and References

Title Authors Year Actions
Momentum gradient-based untargeted poisoning attack on hypergraph neural networks
Yang Chen, S. Picek, Zhonglin Ye, Zhaoyang Wang, Haixing Zhao
2025
View Paper
A Survey of Link Prediction in Temporal Networks
Jiafeng Xiong, A. Zareie, R. Sakellariou
2025
View Paper
A hyper-distance-based method for hypernetwork comparison.
Ruonan Feng, Tao Xu, Xiaowen Xie, Zi-Ke Zhang, Chuang Liu, Xiuxiu Zhan
2024
View Paper
Ada-HGNN: Adaptive Sampling for Scalable Hypergraph Neural Networks
Shuai Wang, David W. Zhang, Jia-Hong Huang, S. Rudinac, Monika Kackovic, N. Wijnberg, M. Worring
2024
View Paper
Multi-Excitation Projective Simulation with a Many-Body Physics Inspired Inductive Bias
Philip A. LeMaitre, Marius Krumm, H. Briegel
2024
View Paper
Mixed coordinate Node link Visualization for Co_authorship Hypergraph Networks
Mohsen Nafar, Hamed Azami Zenouzagh
2023
View Paper
Momentum Gradient-based Untargeted Attack on Hypergraph Neural Networks
Yang Chen, S. Picek, Zhonglin Ye, Zhaoyang Wang, Haixing Zhao
2023
View Paper
Malicious Cyber Activity Detection using Zigzag Persistence
Audun Myers, Alyson Bittner, Sinan G. Aksoy, Daniel M. Best, Gregory Henselman-Petrusek, Helen Jenne, C. Joslyn, Bill Kay, Garret Seppala, Stephen J. Young, Emilie Purvine
2023
View Paper
A hyper-distance-based method for hypernetwork comparison
Tao Xu, Xiaowen Xie, Zi-Ke Zhang, Chuang Liu, Xiuxiu Zhan
2023
View Paper
The State of the Art in Visualizing Dynamic Multivariate Networks
Bharati Kale, Maoyuan Sun, M. Papka
2023
View Paper
Topological Analysis of Temporal Hypergraphs
Audun D. Myers, C. Joslyn, Bill Kay, Emilie Purvine, Gregory Roek, Madelyn Shapiro
2023
View Paper
Geo-Storylines: Integrating Maps into Storyline Visualizations
Golina Hulstein, Vanessa Peña Araya, A. Bezerianos
2022
View Paper
LargeNetVis: Visual Exploration of Large Temporal Networks Based on Community Taxonomies
Claudio D. G. Linhares, Jean R. Ponciano, D. S. Pedro, Luis E C Rocha, A. J. Traina, Jorge Poco
2022
View Paper
VAC2: Visual Analysis of Combined Causality in Event Sequences
Sujia Zhu, Yue Shen, Zihao Zhu, Wang Xia, Baofeng Chang, Ronghua Liang, Guodao Sun
2022
View Paper
LMFingerprints: Visual Explanations of Language Model Embedding Spaces through Layerwise Contextualization Scores
R. Sevastjanova, A. Kalouli, C. Beck, H. Hauptmann, Mennatallah El-Assady
2022
View Paper
Six methods for transforming layered hypergraphs to apply layered graph layout algorithms
Sara Di Bartolomeo, A. Pister, P. Buono, C. Plaisant, Cody Dunne, Jean-Daniel Fekete
2022
View Paper
Promoting Ethical Awareness in Communication Analysis: Investigating Potentials and Limits of Visual Analytics for Intelligence Applications
M. T. Fischer, S. Hirsbrunner, Wolfgang Jentner, Matthias Miller, D. Keim, P. Helm
2022
View Paper
The Pattern is in the Details: An Evaluation of Interaction Techniques for Locating, Searching, and Contextualizing Details in Multivariate Matrix Visualizations
Yalong Yang, Wenyu Xia, Fritz Lekschas, C. Nobre, Robert Krueger, Hanspeter Pfister
2022
View Paper
Adaptive Neural Message Passing for Inductive Learning on Hypergraphs
Devanshu Arya, D. Gupta, S. Rudinac, M. Worring
2021
View Paper
HyperStorylines: Interactively untangling dynamic hypergraphs
Vanessa Peña-Araya, Tong Xue, Emmanuel Pietriga, L. Amsaleg, A. Bezerianos
2021
View Paper
Towards a Survey on Static and Dynamic Hypergraph Visualizations
M. Fischer, A. Frings, D. Keim, Daniel Seebacher
2021
View Paper
Communication Analysis through Visual Analytics: Current Practices, Challenges, and New Frontiers
M. T. Fischer, Frederik L. Dennig, Daniel Seebacher, D. Keim, Mennatallah El-Assady
2021
View Paper
A comparative analysis for visualizing the temporal evolution of contact networks: a user study
Claudio D. G. Linhares, Jean R. Ponciano, J. G. Paiva, B. Travençolo, Luis E C Rocha
2021
View Paper
CommAID: Visual Analytics for Communication Analysis through Interactive Dynamics Modeling
M. T. Fischer, Daniel Seebacher, R. Sevastjanova, D. Keim, Mennatallah El-Assady
2021
View Paper
GraphStateVis: Interactive Visual Analysis of Qubit Graph States and their Stabilizer Groups
Matthias Miller, Daniel Miller
2021
View Paper
Controllability of Hypergraphs
Can Chen, A. Surana, Anthony M. Bloch, I. Rajapakse
2020
View Paper
Hypergraph Data analysis with PAOHVis
P. Buono, Miguel Ceriani, M. Costabile
2021
View Paper
CiteVis : Visual Analysis of Overlapping Citation Intents as Dynamic Sets
Shivam Agarwal, Uttiya Ghosh, ‡. FabianBeck, Jaya Sreevalsan-Nair
View Paper

Similar Papers

LargeNetVis: Visual Exploration of Large Temporal Networks Based on Community Taxonomies

Jorge Poco, Luis E. C. Rocha, Jean R. Ponciano, Claudio D. G. Linhares, Diogenes S. Pedro, Agma J. M. Traina

Published: 2022-10-06

The LAVA Model: Learning Analytics Meets Visual Analytics

Mohamed Amine Chatti, Mouadh Guesmi, Arham Muslim, Manpriya Guliani

Published: 2023-03-23

TrialView: An AI-powered Visual Analytics System for Temporal Event Data in Clinical Trials

Xiang Liu, Jing Su, Zelei Cheng, Yingjie Chen, Zuotian Li, Wanzhu Tu

Published: 2024-01-31

Visual Analytics for Efficient Image Exploration and User-Guided Image Captioning

Liang Wang, Wei Zhang, Junpeng Wang, Yan Zheng, Kwan-Liu Ma, Yiran Li, Prince Aboagye, Michael Yeh

Published: 2023-11-03

Comments (0)

This website uses cookies to ensure you get the best experience. Learn more