A Grid-based Method for Removing Overlaps of Dimensionality Reduction Scatterplot Layouts
Publication
Metrics
AI Quick Summary
This paper introduces Distance Grid (DGrid), a novel post-processing method to remove overlaps in dimensionality reduction scatterplots without distorting glyphs' size, outperforming existing techniques in both effectiveness and speed. DGrid preserves the original layout's visual characteristics, as confirmed by a user study and comparative metrics.
Paper Preview
Abstract
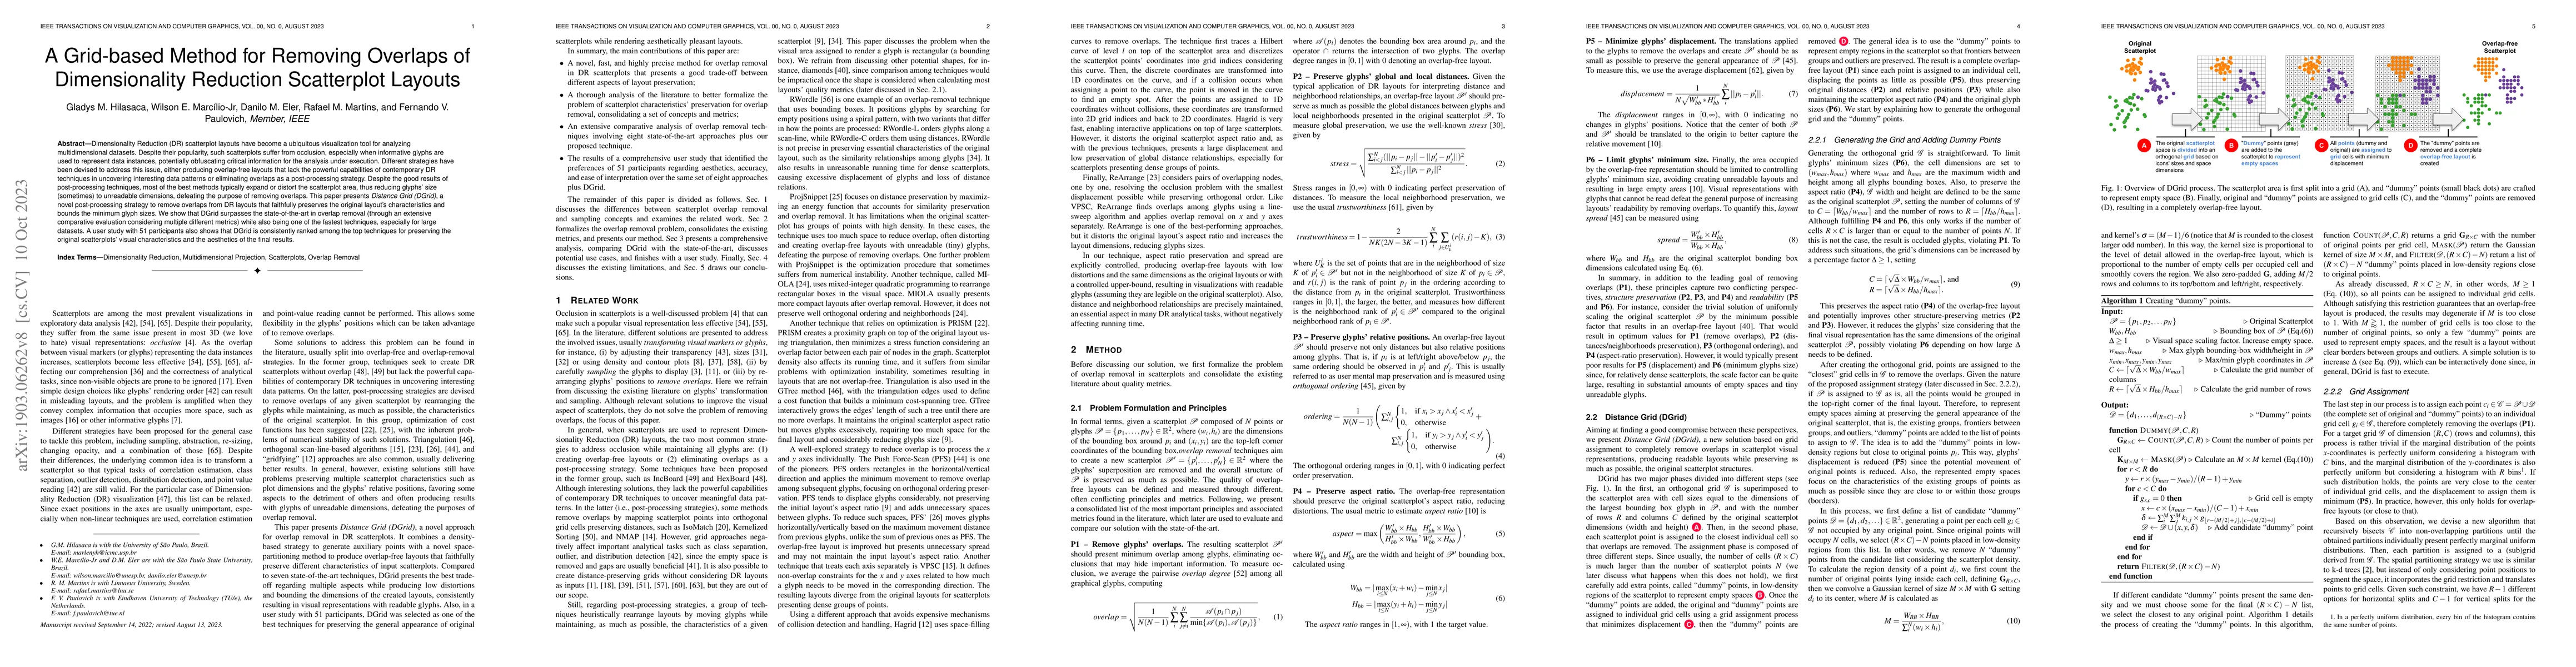
Dimensionality Reduction (DR) scatterplot layouts have become a ubiquitous visualization tool for analyzing multidimensional datasets. Despite their popularity, such scatterplots suffer from occlusion, especially when informative glyphs are used to represent data instances, potentially obfuscating critical information for the analysis under execution. Different strategies have been devised to address this issue, either producing overlap-free layouts that lack the powerful capabilities of contemporary DR techniques in uncovering interesting data patterns or eliminating overlaps as a post-processing strategy. Despite the good results of post-processing techniques, most of the best methods typically expand or distort the scatterplot area, thus reducing glyphs' size (sometimes) to unreadable dimensions, defeating the purpose of removing overlaps. This paper presents Distance Grid (DGrid), a novel post-processing strategy to remove overlaps from DR layouts that faithfully preserves the original layout's characteristics and bounds the minimum glyph sizes. We show that DGrid surpasses the state-of-the-art in overlap removal (through an extensive comparative evaluation considering multiple different metrics) while also being one of the fastest techniques, especially for large datasets. A user study with 51 participants also shows that DGrid is consistently ranked among the top techniques for preserving the original scatterplots' visual characteristics and the aesthetics of the final results.
AI Key Findings
Get AI-generated insights about this paper's methodology, results, significance, and more — seven facets brought into focus.
Impact
Paper Details
Authors
PDF Preview
Key Terms
Citation Network
Current paper (gray), citations (green), references (blue)
Display is limited for performance on very large graphs.
Discussion 0