Contrastive analysis for scatterplot-based representations of dimensionality reduction
Publication
Metrics
AI Quick Summary
This paper introduces a new method for analyzing dimensionality reduction results using contrastive analysis to explore cluster formation and feature relationships. It demonstrates its effectiveness on two COVID-19-related datasets with quantitative results.
Paper Preview
Abstract
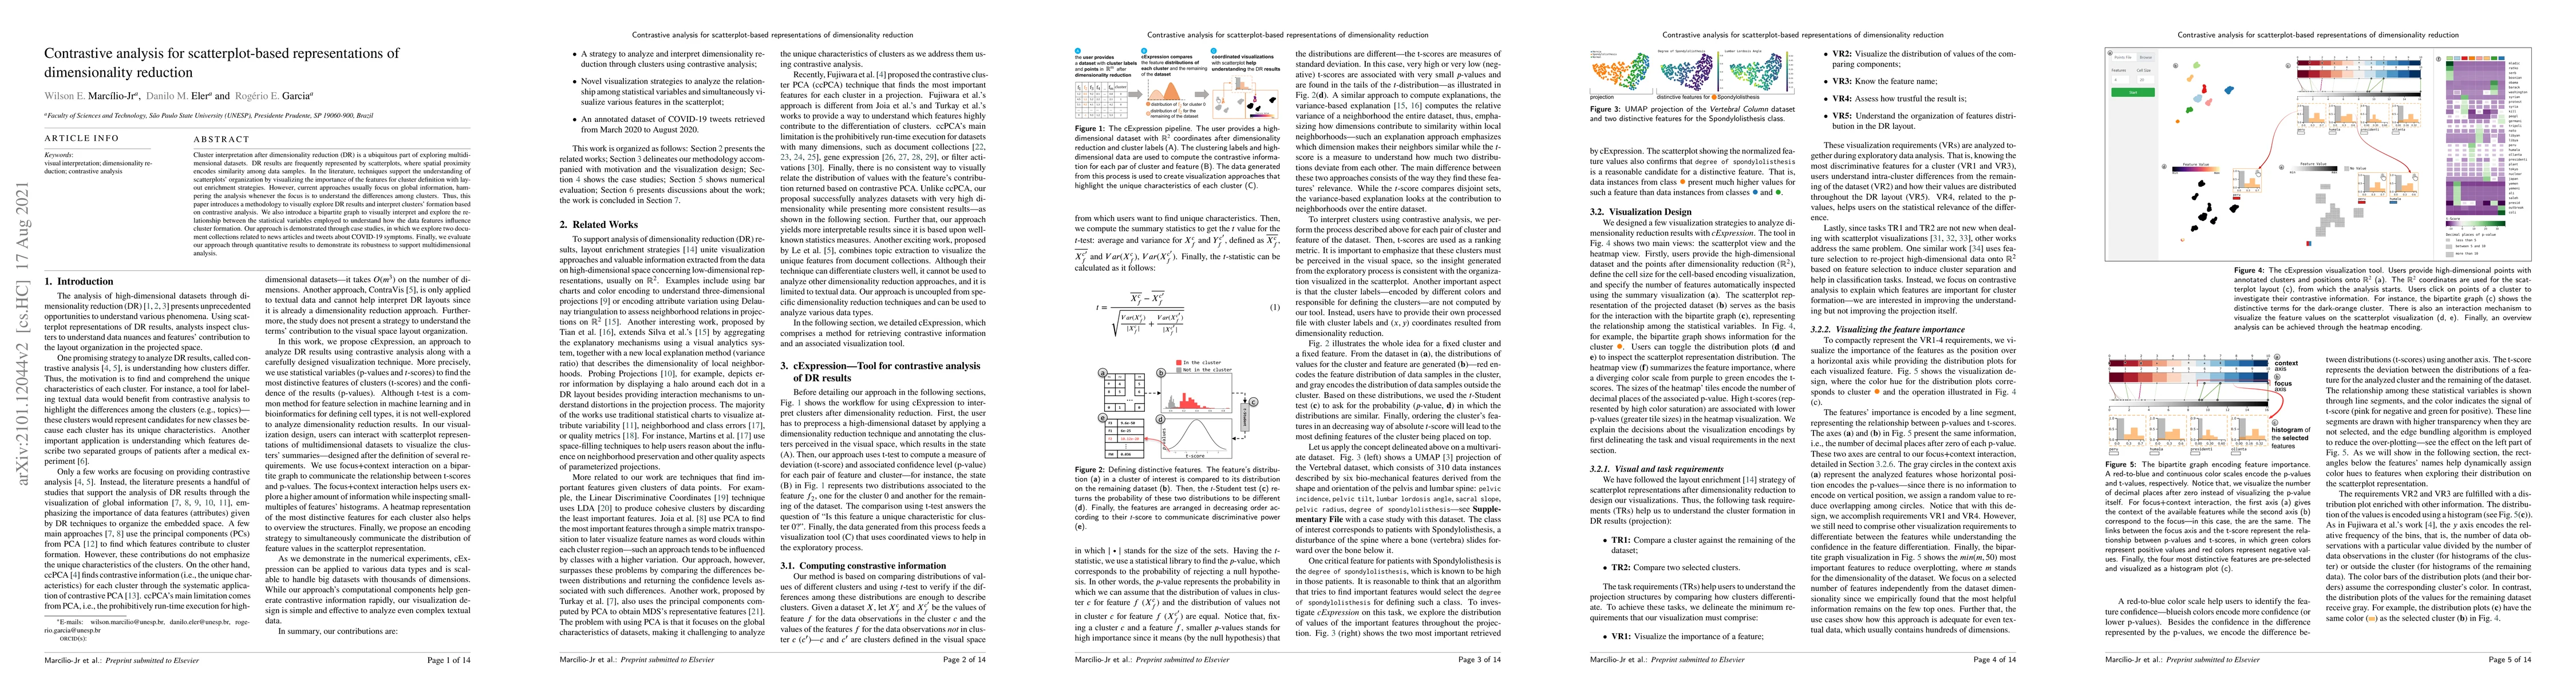
Cluster interpretation after dimensionality reduction (DR) is a ubiquitous part of exploring multidimensional datasets. DR results are frequently represented by scatterplots, where spatial proximity encodes similarity among data samples. In the literature, techniques support the understanding of scatterplots' organization by visualizing the importance of the features for cluster definition with layout enrichment strategies. However, current approaches usually focus on global information, hampering the analysis whenever the focus is to understand the differences among clusters. Thus, this paper introduces a methodology to visually explore DR results and interpret clusters' formation based on contrastive analysis. We also introduce a bipartite graph to visually interpret and explore the relationship between the statistical variables employed to understand how the data features influence cluster formation. Our approach is demonstrated through case studies, in which we explore two document collections related to news articles and tweets about COVID-19 symptoms. Finally, we evaluate our approach through quantitative results to demonstrate its robustness to support multidimensional analysis.
AI Key Findings
Get AI-generated insights about this paper's methodology, results, significance, and more — seven facets brought into focus.
Impact
Paper Details
PDF Preview
Key Terms
Citation Network
Current paper (gray), citations (green), references (blue)
Display is limited for performance on very large graphs.
Discussion 0