Publication
Metrics
Paper Preview
Abstract
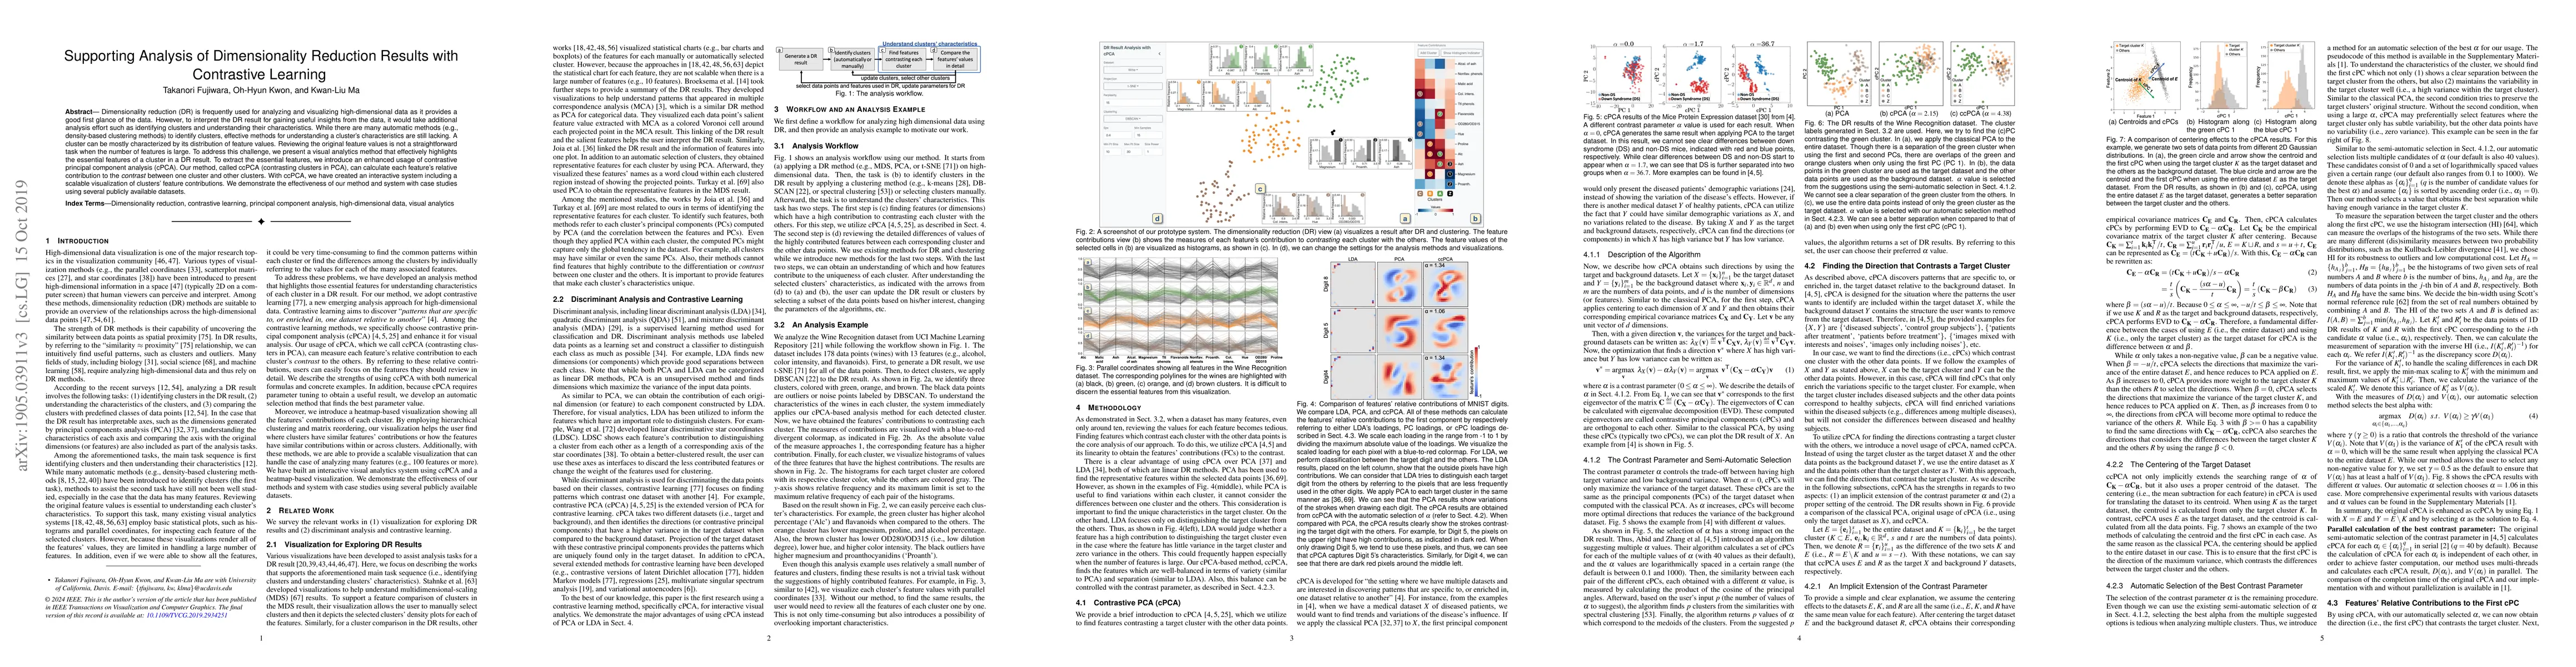
Dimensionality reduction (DR) is frequently used for analyzing and visualizing high-dimensional data as it provides a good first glance of the data. However, to interpret the DR result for gaining useful insights from the data, it would take additional analysis effort such as identifying clusters and understanding their characteristics. While there are many automatic methods (e.g., density-based clustering methods) to identify clusters, effective methods for understanding a cluster's characteristics are still lacking. A cluster can be mostly characterized by its distribution of feature values. Reviewing the original feature values is not a straightforward task when the number of features is large. To address this challenge, we present a visual analytics method that effectively highlights the essential features of a cluster in a DR result. To extract the essential features, we introduce an enhanced usage of contrastive principal component analysis (cPCA). Our method, called ccPCA (contrasting clusters in PCA), can calculate each feature's relative contribution to the contrast between one cluster and other clusters. With ccPCA, we have created an interactive system including a scalable visualization of clusters' feature contributions. We demonstrate the effectiveness of our method and system with case studies using several publicly available datasets.
AI Key Findings
Get AI-generated insights about this paper's methodology, results, significance, and more — seven facets brought into focus.
Impact
Paper Details
PDF Preview
Key Terms
Citation Network
Current paper (gray), citations (green), references (blue)
Display is limited for performance on very large graphs.
Discussion 0