A Heterogeneous Spatial Model for Soil Carbon Mapping of the Contiguous United States Using VNIR Spectra
Publication
Metrics
AI Quick Summary
This paper develops a heterogeneous spatial model to map soil organic carbon across the contiguous U.S., addressing data variability and using VNIR spectra as proxies. The model accounts for spatial and land-use variability in both the mean and variance, leading to a comprehensive carbon map with uncertainty estimates.
Paper Preview
Abstract
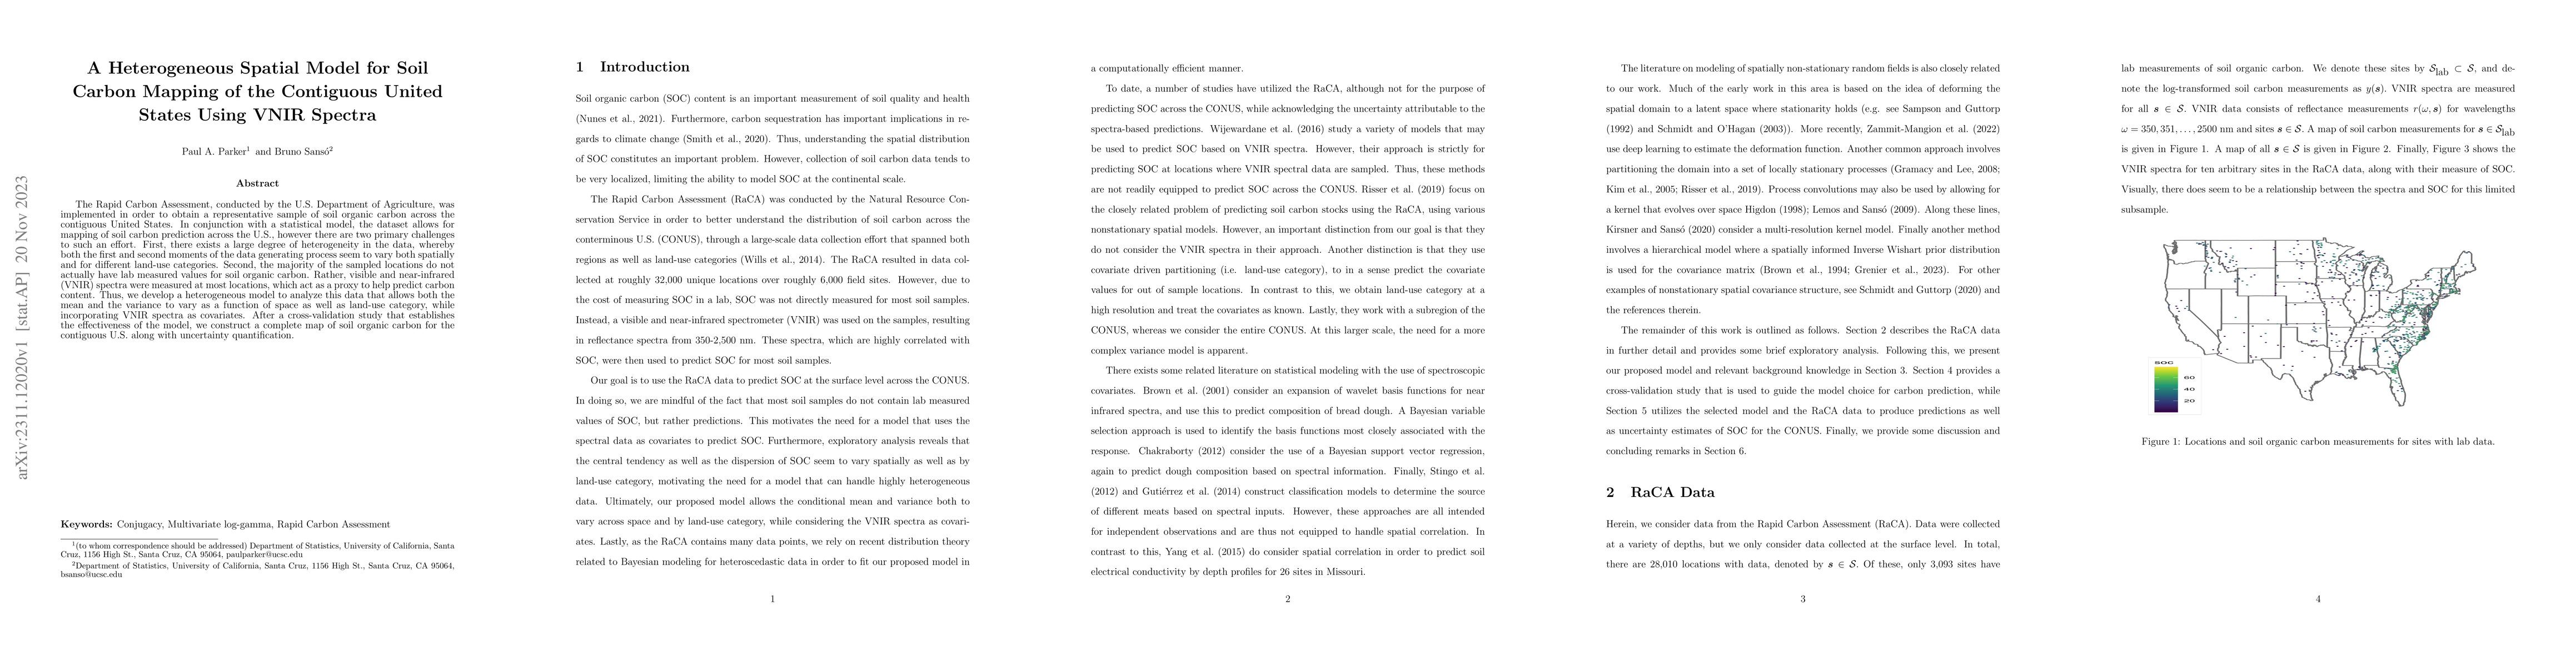
The Rapid Carbon Assessment, conducted by the U.S. Department of Agriculture, was implemented in order to obtain a representative sample of soil organic carbon across the contiguous United States. In conjunction with a statistical model, the dataset allows for mapping of soil carbon prediction across the U.S., however there are two primary challenges to such an effort. First, there exists a large degree of heterogeneity in the data, whereby both the first and second moments of the data generating process seem to vary both spatially and for different land-use categories. Second, the majority of the sampled locations do not actually have lab measured values for soil organic carbon. Rather, visible and near-infrared (VNIR) spectra were measured at most locations, which act as a proxy to help predict carbon content. Thus, we develop a heterogeneous model to analyze this data that allows both the mean and the variance to vary as a function of space as well as land-use category, while incorporating VNIR spectra as covariates. After a cross-validation study that establishes the effectiveness of the model, we construct a complete map of soil organic carbon for the contiguous U.S. along with uncertainty quantification.
AI Key Findings
Get AI-generated insights about this paper's methodology, results, significance, and more — seven facets brought into focus.
Impact
Paper Details
Authors
PDF Preview
Key Terms
Citation Network
Current paper (gray), citations (green), references (blue)
Display is limited for performance on very large graphs.
Discussion 0