This paper introduces a hierarchical aggregation framework for efficient multilevel visual exploration and analysis of large dynamic datasets. The proposed model leverages a lightweight tree-based structure for on-the-fly scalable visualizations, enabling incremental construction, prefetching, and dynamic adaptation based on user preferences.
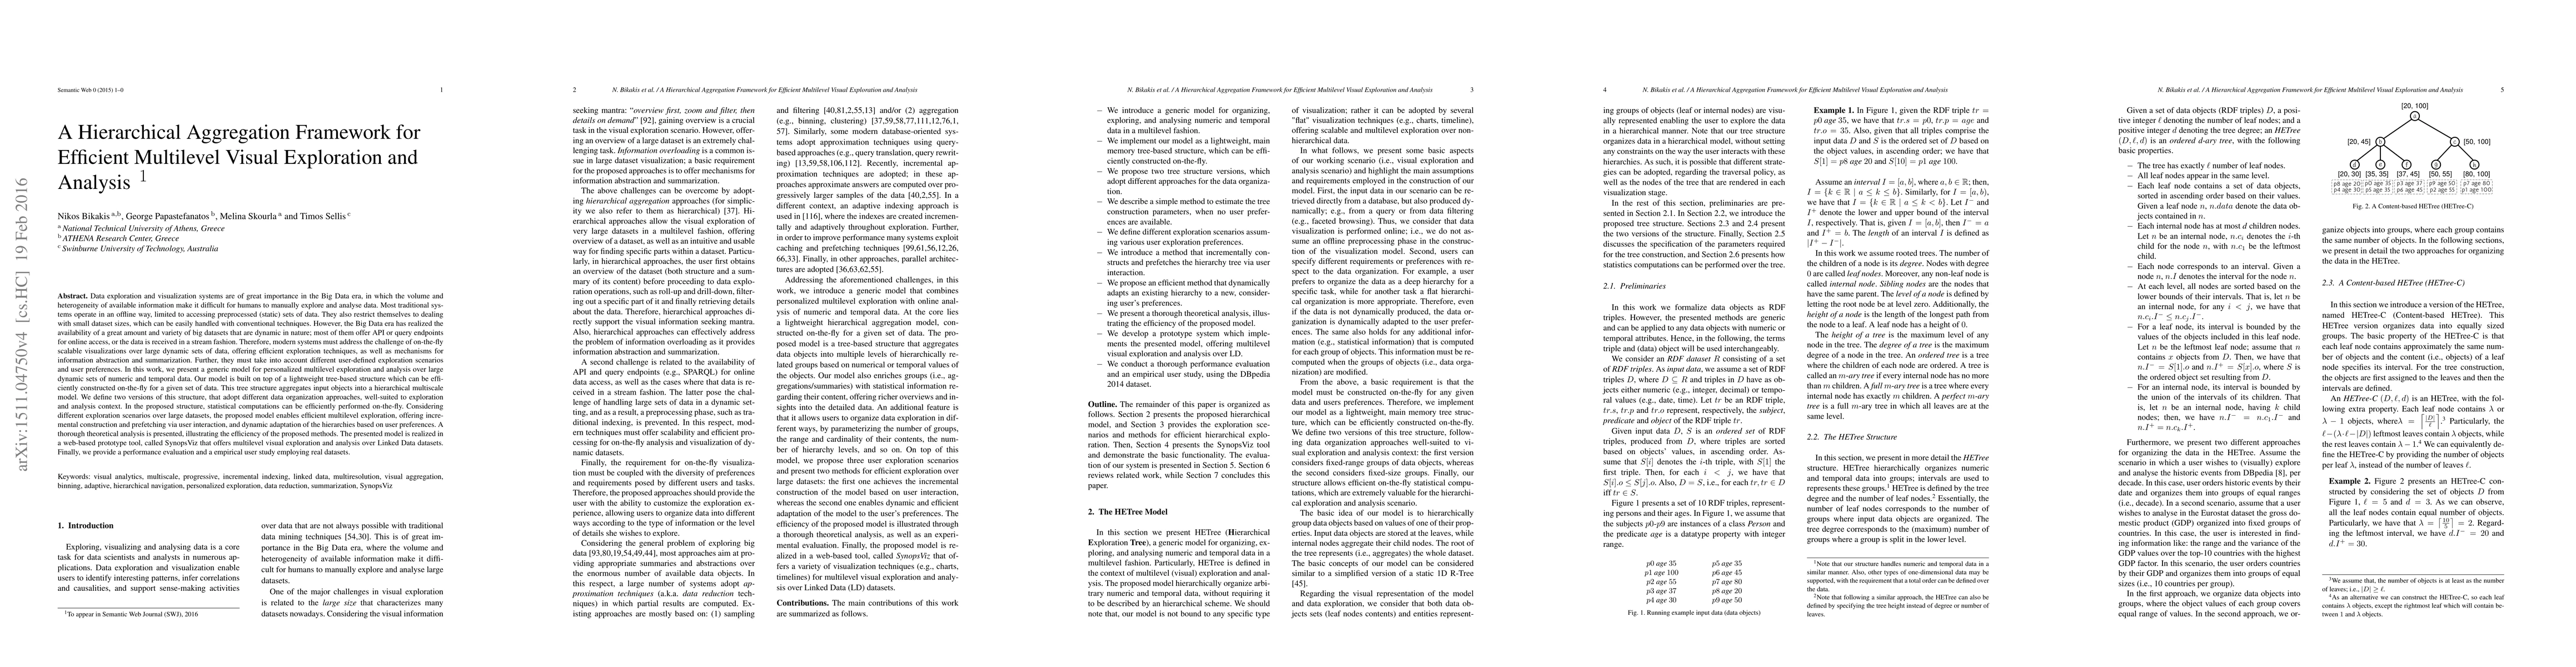
Data exploration and visualization systems are of great importance in the Big Data era, in which the volume and heterogeneity of available information make it difficult for humans to manually explore and analyse data. Most traditional systems operate in an offline way, limited to accessing preprocessed (static) sets of data. They also restrict themselves to dealing with small dataset sizes, which can be easily handled with conventional techniques. However, the Big Data era has realized the availability of a great amount and variety of big datasets that are dynamic in nature; most of them offer API or query endpoints for online access, or the data is received in a stream fashion. Therefore, modern systems must address the challenge of on-the-fly scalable visualizations over large dynamic sets of data, offering efficient exploration techniques, as well as mechanisms for information abstraction and summarization. In this work, we present a generic model for personalized multilevel exploration and analysis over large dynamic sets of numeric and temporal data. Our model is built on top of a lightweight tree-based structure which can be efficiently constructed on-the-fly for a given set of data. This tree structure aggregates input objects into a hierarchical multiscale model. Considering different exploration scenarios over large datasets, the proposed model enables efficient multilevel exploration, offering incremental construction and prefetching via user interaction, and dynamic adaptation of the hierarchies based on user preferences. A thorough theoretical analysis is presented, illustrating the efficiency of the proposed model. The proposed model is realized in a web-based prototype tool, called SynopsViz that offers multilevel visual exploration and analysis over Linked Data datasets.
Get AI-generated insights about this paper's methodology, results, and significance.
Current paper (gray), citations (green), references (blue)
Bohyung Han, Jin Young Choi, Jaeyoo Park et al.
Title | Authors | Year | Actions |
---|---|---|---|
Pervasive Augmented Reality to support real-time data monitoring in industrial scenarios: Shop floor visualization evaluation and user study
|
Rafael Maio, Tiago Araújo, Bernardo Marques, Andreia Santos, Pedro Ramalho, Duarte Almeida, Paulo Dias, B. Santos
|
2023
|
View Paper |
VSAN: A new visualization method for super-large-scale academic networks
|
Qi Li, Xingli Wang, Luoyi Fu, Xinde Cao, Xinbing Wang, Jing Zhang, Cheng Zhou
|
2023
|
View Paper |
Using Chained Views and Follow-Up Queries to Assist the Visual Exploration of the Web of Big Linked Data
|
Aline Menin, Minh Nhat Do, Carla Freitas, O. Corby, Catherine Faron-Zucker, A. Giboin, M. Winckler
|
2022
|
View Paper |
Exploration of Knowledge Graphs via Online Aggregation
|
Oren Kalinsky, Aidan Hogan, Oren Mishali, Yoav Etsion, B. Kimelfeld
|
2022
|
View Paper |
Resource-aware adaptive indexing for in situ visual exploration and analytics
|
Stavros Maroulis, Nikos Bikakis, George Papastefanatos, Panos Vassiliadis, Y. Vassiliou
|
2022
|
View Paper |
Delivery and evaluation of an e-Learning framework through computer-aided analysis of learners’ reflection text in a teacher development course
|
S. Kong
|
2021
|
View Paper |
Mr. Plotter: Unifying Data Reduction Techniques in Storage and Visualization Systems
|
Sam Kumar, Michael P. Andersen, D. Culler
|
2021
|
View Paper |
AGAMI: Scalable Visual Analytics over Multidimensional Data Streams
|
Mingxin Lu, Edmund Wong, D. Barajas, Xiaochen Li, Mosopefoluwa Ogundipe, N. Wilson, Pragya Garg, Alark Joshi, Matthew Malensek
|
2020
|
View Paper |
Enhancing the Interactive Visualisation of a Data Preparation Tool from in-Memory Fitting to Big Data Sets
|
Gorka Epelde, Roberto Álvarez, A. Beristain, Mónica Arrúe, I. Arangoa, Debbie Rankin
|
2020
|
View Paper |
Linked Data Visualization: Techniques, Tools, and Big Data
|
Laura Po, Nikos Bikakis, F. Desimoni, George Papastefanatos
|
2020
|
View Paper |
Using knowledge anchors to facilitate user exploration of data graphs
|
Marwan Al-Tawil, V. Dimitrova, D. Thakker
|
2020
|
View Paper |
A multi-layer framework for semantic modeling
|
Sérgio Evangelista Silva, L. Reis, J. Fernandes, Alana Deusilan Sester Pereira
|
2019
|
View Paper |
Making data visualization more efficient and effective: a survey
|
Xuedi Qin, Yuyu Luo, N. Tang, Guoliang Li
|
2019
|
View Paper |
A Conceptual Modelling Approach to Visualising Linked Data
|
P. McBrien, A. Poulovassilis
|
2019
|
View Paper |
HiePaCo: Scalable Hierarchical Exploration in Abstract Parallel Coordinates Under Budget Constraints
|
Gaëlle Richer, Joris Sansen, Frédéric Lalanne, D. Auber, Romain Bourqui
|
2019
|
View Paper |
Hillview: A trillion-cell spreadsheet for big data
|
M. Budiu, Parikshit Gopalan, L. Suresh, Udi Wieder, Han Kruiger, M. Aguilera
|
2019
|
View Paper |
Towards Democratizing Relational Data Visualization
|
N. Tang, Eugene Wu, Guoliang Li
|
2019
|
View Paper |
Towards a New Architecture for Data Multilevels Interactive Visualization in Big Data Domains
|
Moustafa Sadek Kahil, Abdelkrim Bouramoul, M. Derdour
|
2019
|
View Paper |
Efficiently Charting RDF
|
Oren Kalinsky, Oren Mishali, Aidan Hogan, Yoav Etsion, B. Kimelfeld
|
2018
|
View Paper |
Method to interactively visualize and navigate related information
|
Antonio Hernando, Jesús Bobadilla, Fernando Ortega, Abraham Gutiérrez
|
2018
|
View Paper |
GraphDL: An Ontology for Linked Data Visualization
|
J. Gómez‐Romero, Miguel Molina-Solana
|
2018
|
View Paper |
RawVis: Visual Exploration over Raw Data
|
Nikos Bikakis, Stavros Maroulis, George Papastefanatos, Panos Vassiliadis
|
2018
|
View Paper |
VisualRS: Java framework for visualization of recommender systems information
|
S. Gil, Jesús Bobadilla, Fernando Ortega, Bo Zhu
|
2018
|
View Paper |
Enabling Hierarchical Exploration for Large-Scale Multidimensional Data with Abstract Parallel Coordinates
|
Gaëlle Richer, Joris Sansen, Frédéric Lalanne, D. Auber, Romain Bourqui
|
2018
|
View Paper |
Specification and implementation of mapping rule visualization and editing: MapVOWL and the RMLEditor
|
Pieter Heyvaert, Anastasia Dimou, B. Meester, Tom Seymoens, Aron-Levi Herregodts, R. Verborgh, D. Schuurman, E. Mannens
|
2018
|
View Paper |
Big Data Visualization Tools
|
Nikos Bikakis
|
2018
|
View Paper |
Exploration and Visualization in the Web of Big Linked Data: A Survey of the State of the Art
|
Nikos Bikakis, T. Sellis
|
2016
|
View Paper |
A Tool for Visual Exploration and Analysis of Solar Photovoltaic Module Data
|
Vassilis Stamatopoulos, Stavros Maroulis, Konstantinos Kozanis, I. Psarros, George Papastefanatos, G. Giannopoulos, Manolis Terrovitis
|
2023
|
View Paper |
In-situ visual exploration over big raw data
|
Nikos Bikakis, Stavros Maroulis, George Papastefanatos, Panos Vassiliadis
|
2021
|
View Paper |
Adaptive Indexing for In-situ Visual Exploration and Analytics
|
Stavros Maroulis, Nikos Bikakis, George Papastefanatos, Panos Vassiliadis, Y. Vassiliou
|
2021
|
View Paper |
Providing Effective Visualizations over Big Linked Data
|
F. Desimoni, Laura Po
|
2020
|
View Paper |
Enabling Interactive Visualizations in Industrial Big Data
|
Aguinaldo Bezerra, V. Greati, Vinicius Campos, I. Silva, L. A. Guedes, G. Leitao, D. Silva
|
2020
|
View Paper |
Adapting the LodView RDF Browser for Navigation over the Linguistic Linked Open Data Cloud in Russian and the Languages of Russia
|
Alexander V. Kirilovich, K. Nikolaev
|
2020
|
View Paper |
Business Information Systems Workshops: BIS 2020 International Workshops, Colorado Springs, CO, USA, June 8–10, 2020, Revised Selected Papers
|
W. Abramowicz, Gary Klein
|
2020
|
View Paper |
Survey of tools for Linked Data consumption
|
Jakub Klímek, P. Škoda, M. Nečaský
|
2019
|
View Paper |
Interactive Data Exploration of Distributed Raw Files: A Systematic Mapping Study
|
A. Álvarez-Ayllón, M. Palomo-duarte, J. Dodero
|
2019
|
View Paper |
Visualizing Implicit RDF Schema with the Help of Embeddings
|
M. Meimaris
|
2019
|
View Paper |
Linked Data Visualization Tools
|
C.Ramesh, K. Rao, A. Govardhan
|
2019
|
View Paper |
Community Detection Applied on Big Linked Data
|
Laura Po, Davide Malvezzi
|
2018
|
View Paper |
Comments (0)