Publication
Metrics
AI Quick Summary
This paper demonstrates that Student's t-distribution effectively models S&P component stock returns, while the generalized inverse gamma distribution best fits VIX and VXO volatility data. It proposes a novel approach to measure volatility by considering stock returns as the product distribution of volatility and normal distributions.
Paper Preview
Abstract
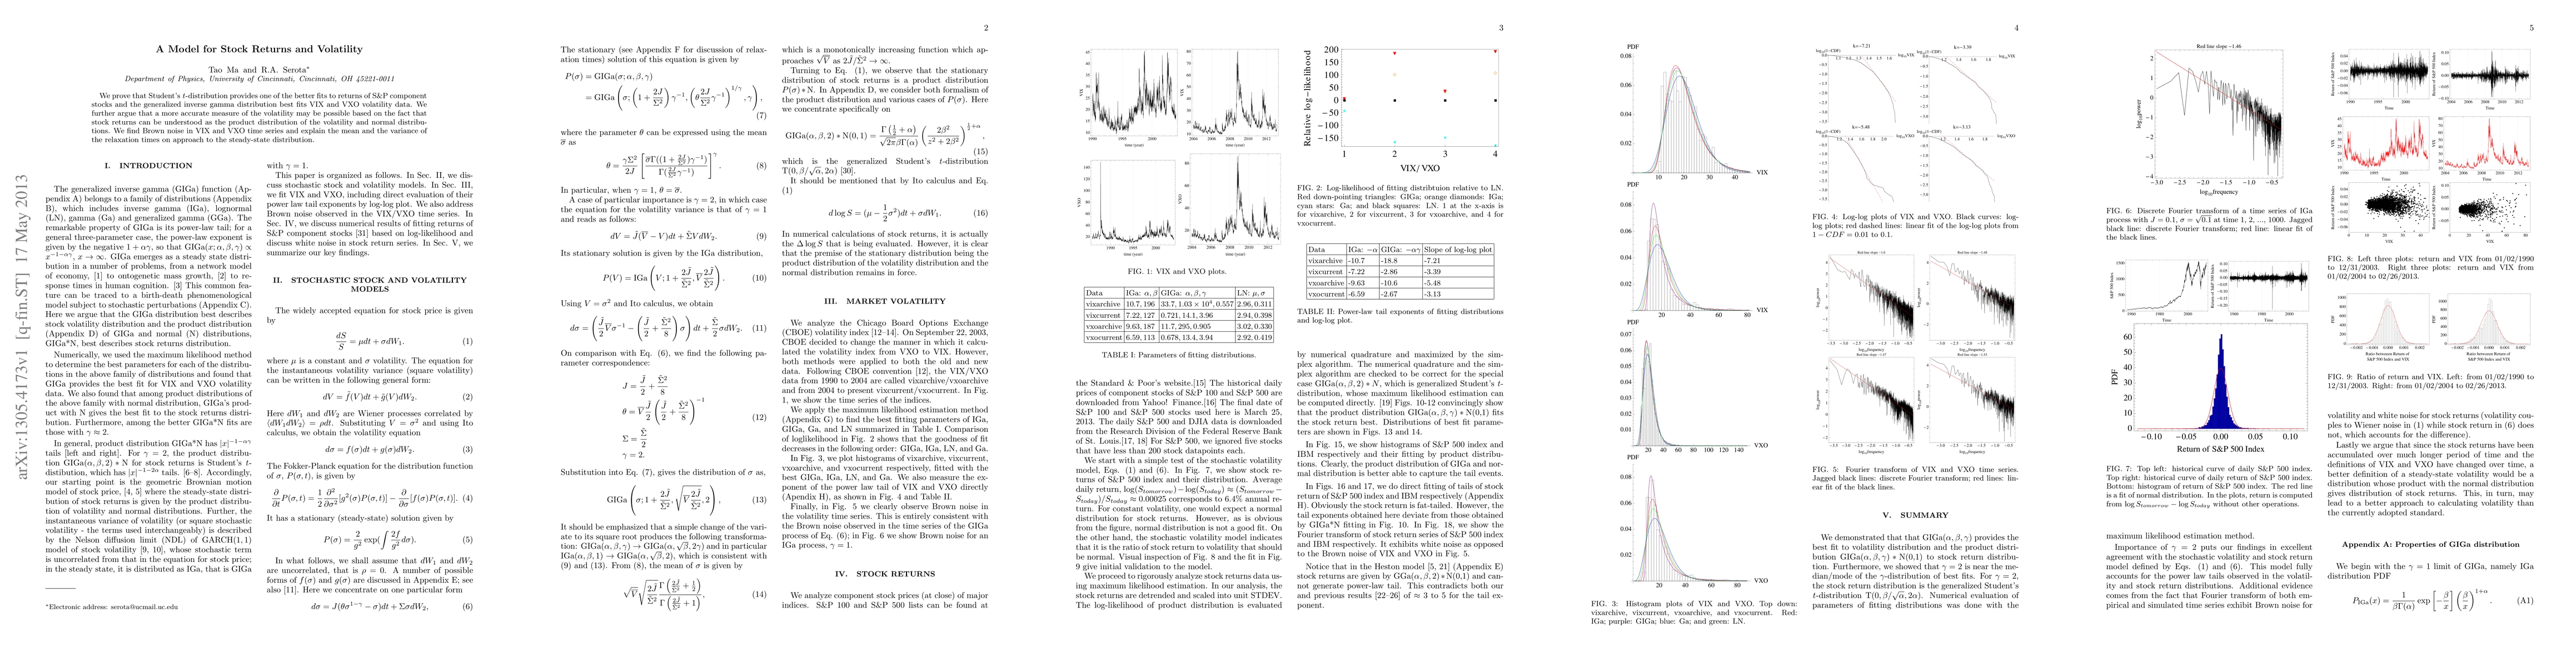
We prove that Student's t-distribution provides one of the better fits to returns of S&P component stocks and the generalized inverse gamma distribution best fits VIX and VXO volatility data. We further argue that a more accurate measure of the volatility may be possible based on the fact that stock returns can be understood as the product distribution of the volatility and normal distributions. We find Brown noise in VIX and VXO time series and explain the mean and the variance of the relaxation times on approach to the steady-state distribution.
AI Key Findings
Get AI-generated insights about this paper's methodology, results, significance, and more — seven facets brought into focus.
Impact
Paper Details
PDF Preview
Key Terms
Citation Network
Current paper (gray), citations (green), references (blue)
Display is limited for performance on very large graphs.
Discussion 0