Authors
Summary
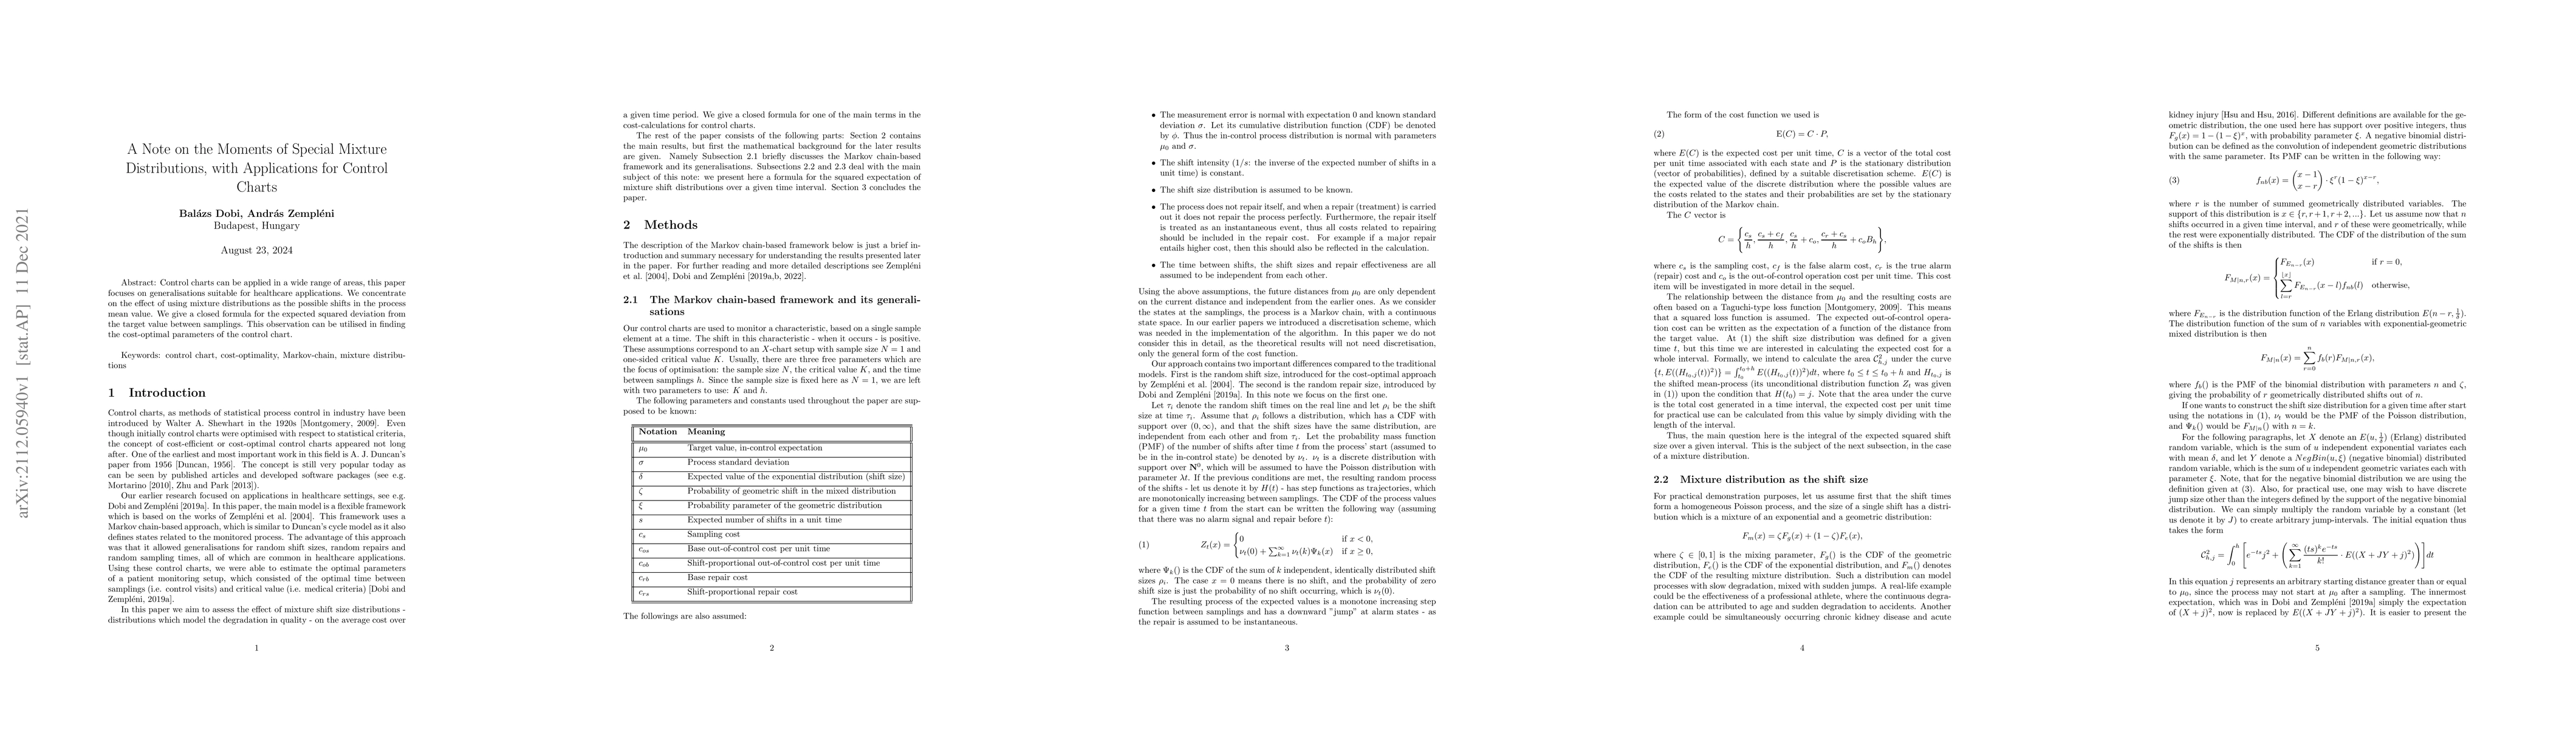
Control charts can be applied in a wide range of areas, this paper focuses on generalisations suitable for healthcare applications. We concentrate on the effect of using mixture distributions as the possible shifts in the process mean value. We give a closed formula for the expected squared deviation from the target value between samplings. This observation can be utilised in finding the cost-optimal parameters of the control chart.
AI Key Findings
Get AI-generated insights about this paper's methodology, results, and significance.
Paper Details
PDF Preview
Key Terms
control
(0.262)
control
(0.259)
value
(0.246)
value
(0.245)
healthcare
(0.242)
healthcare
(0.240)
squared
(0.240)
shifts
(0.227)
Citation Network
Current paper (gray), citations (green), references (blue)
Display is limited for performance on very large graphs.
Current Paper
Citations
References
Click to view
| Title | Authors | Year | Actions |
|---|
Comments (0)