Publication
Metrics
AI Quick Summary
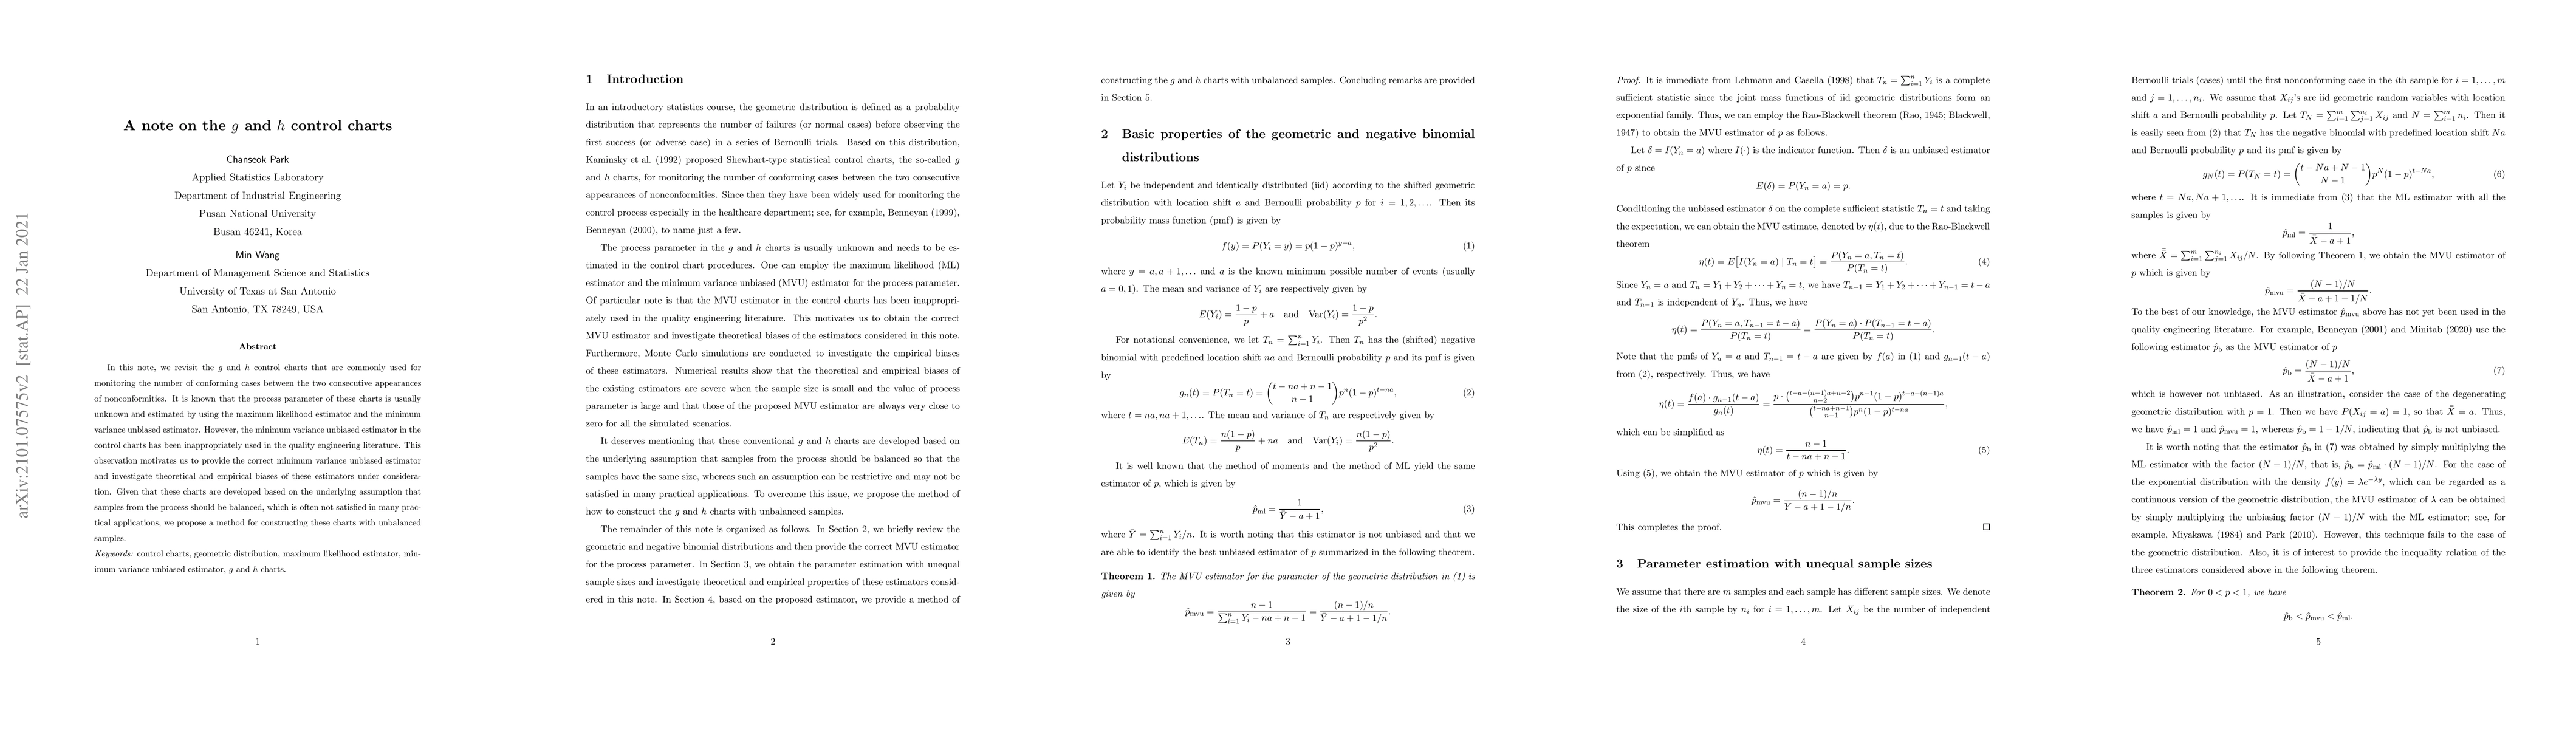
Researchers correct a common mistake in using control charts for monitoring nonconformities and provide a method to construct these charts with unbalanced samples, addressing theoretical and empirical biases.
Paper Preview
Abstract
In this note, we revisit the $g$ and $h$ control charts that are commonly used for monitoring the number of conforming cases between the two consecutive appearances of nonconformities. It is known that the process parameter of these charts is usually unknown and estimated by using the maximum likelihood estimator and the minimum variance unbiased estimator. However, the minimum variance unbiased estimator in the control charts has been inappropriately used in the quality engineering literature. This observation motivates us to provide the correct minimum variance unbiased estimator and investigate theoretical and empirical biases of these estimators under consideration. Given that these charts are developed based on the underlying assumption that samples from the process should be balanced, which is often not satisfied in many practical applications, we propose a method for constructing these charts with unbalanced samples.
AI Key Findings
Get AI-generated insights about this paper's methodology, results, significance, and more — seven facets brought into focus.
Impact
Paper Details
Authors
PDF Preview
Key Terms
Citation Network
Current paper (gray), citations (green), references (blue)
Display is limited for performance on very large graphs.
Discussion 0