Publication
Metrics
AI Quick Summary
Existing Bayesian control charts are not always optimal due to limitations identified in a 1965 analytical counterexample, contradicting claims of their economic optimality.
Paper Preview
Abstract
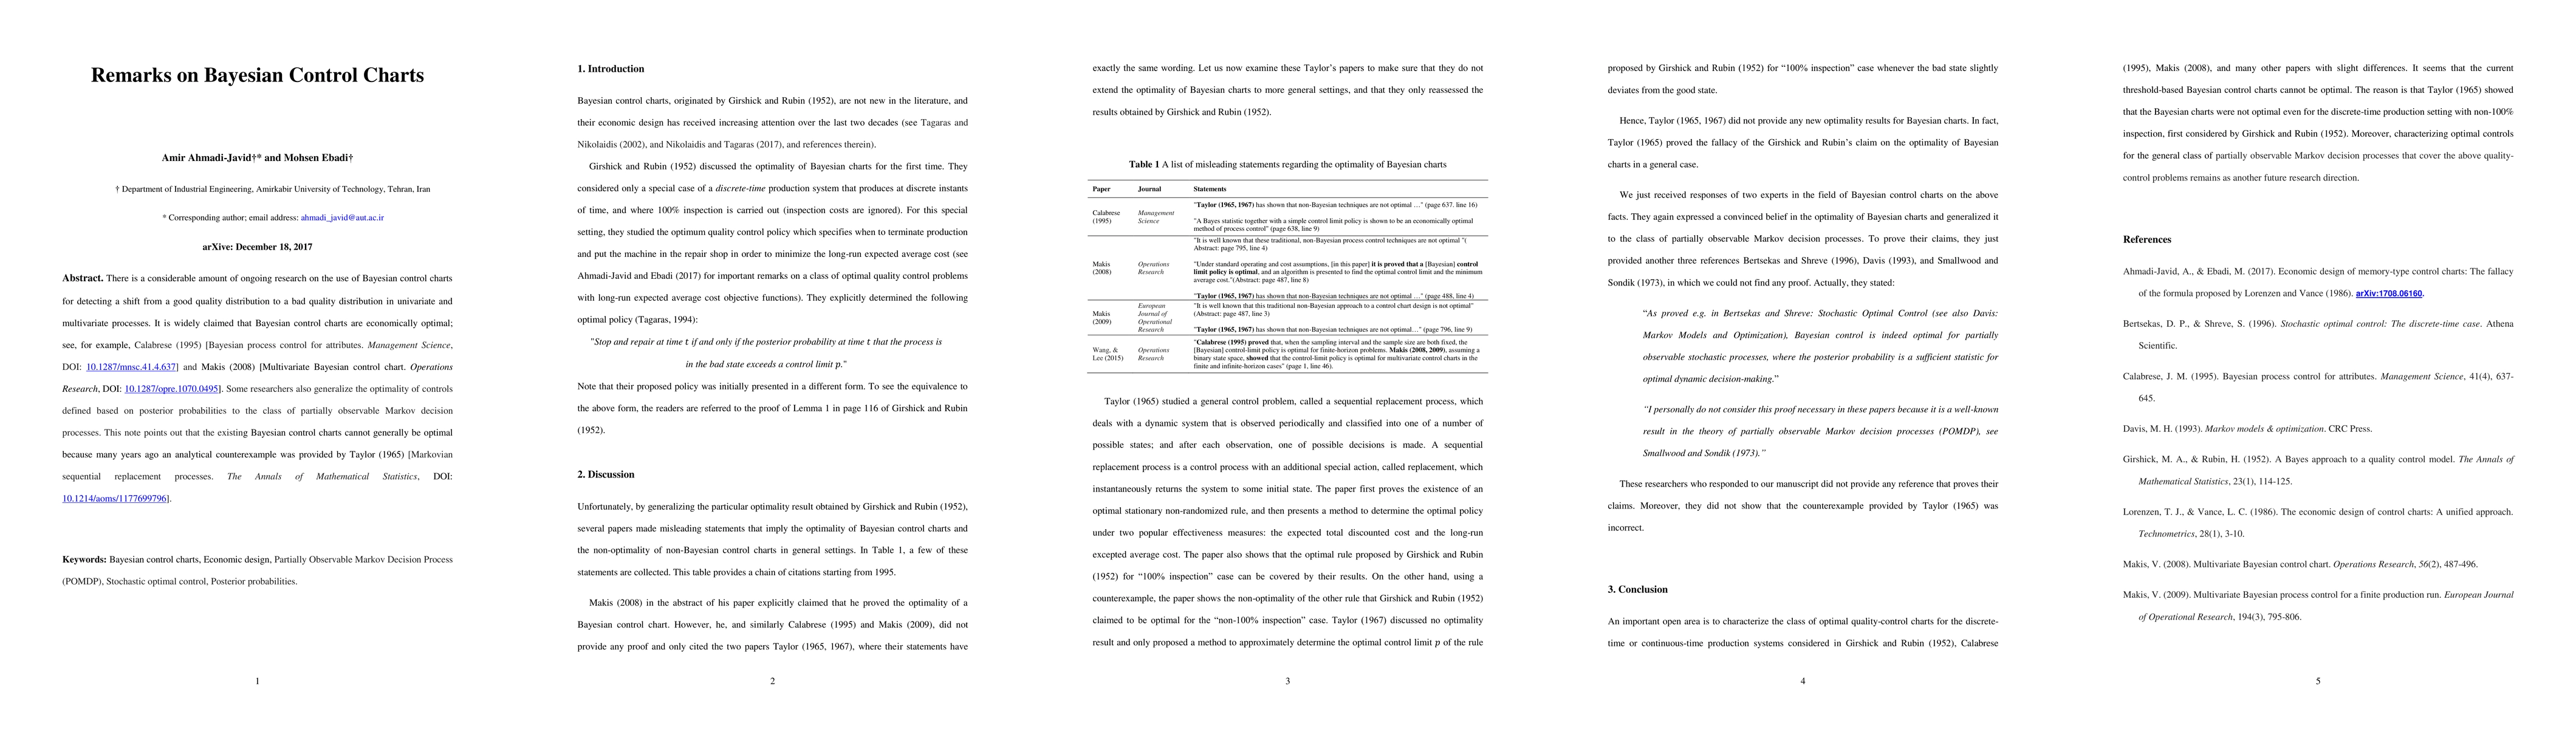
There is a considerable amount of ongoing research on the use of Bayesian control charts for detecting a shift from a good quality distribution to a bad quality distribution in univariate and multivariate processes. It is widely claimed that Bayesian control charts are economically optimal; see, for example, Calabrese (1995) [Bayesian process control for attributes. Management Science, DOI: 10.1287/mnsc.41.4.637] and Makis (2008) [Multivariate Bayesian control chart. Operations Research, DOI: 10.1287/opre.1070.0495]. Some researchers also generalize the optimality of controls defined based on posterior probabilities to the class of partially observable Markov decision processes. This note points out that the existing Bayesian control charts cannot generally be optimal because many years ago an analytical counterexample was provided by Taylor (1965) [Markovian sequential replacement processes. The Annals of Mathematical Statistics, DOI: 10.1214/aoms/1177699796].
AI Key Findings
Get AI-generated insights about this paper's methodology, results, significance, and more — seven facets brought into focus.
Impact
Paper Details
PDF Preview
Key Terms
Citation Network
Current paper (gray), citations (green), references (blue)
Display is limited for performance on very large graphs.
Discussion 0