A precise method for visualizing dispersive features in image plots
Publication
Metrics
Paper Preview
Abstract
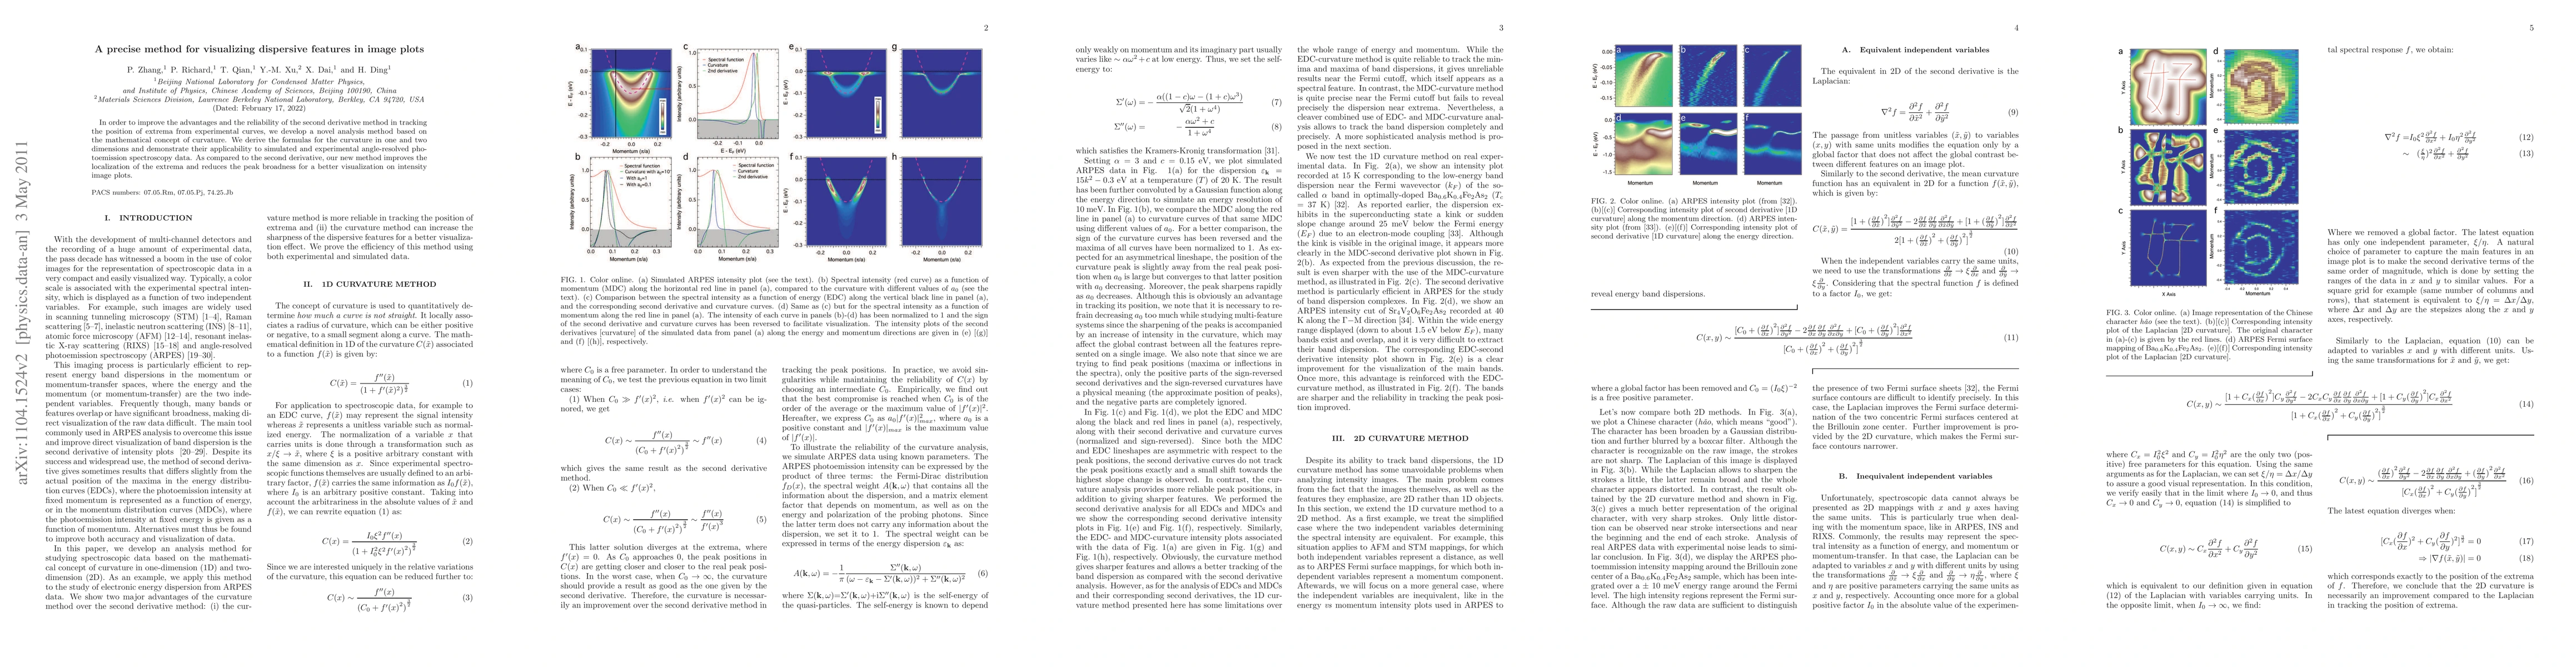
In order to improve the advantages and the reliability of the second derivative method in tracking the position of extrema from experimental curves, we develop a novel analysis method based on the mathematical concept of curvature. We derive the formulas for the curvature in one and two dimensions and demonstrate their applicability to simulated and experimental angle-resolved photoemission spectroscopy data. As compared to the second derivative, our new method improves the localization of the extrema and reduces the peak broadness for a better visualization on intensity image plots.
AI Key Findings
Get AI-generated insights about this paper's methodology, results, significance, and more — seven facets brought into focus.
Impact
Paper Details
PDF Preview
Key Terms
Citation Network
Current paper (gray), citations (green), references (blue)
Display is limited for performance on very large graphs.
Discussion 0