Visualizing changes in student responses using consistency plots
Publication
Metrics
AI Quick Summary
This paper introduces "consistency plots" to visualize shifts in student responses over time, extending "escalator diagrams" to include both method of solution and correctness before and after instruction, providing deeper insights beyond class-wide averages. The data, from an intermediate mechanics class, compare nearly identical midterm and final exam questions.
Paper Preview
Abstract
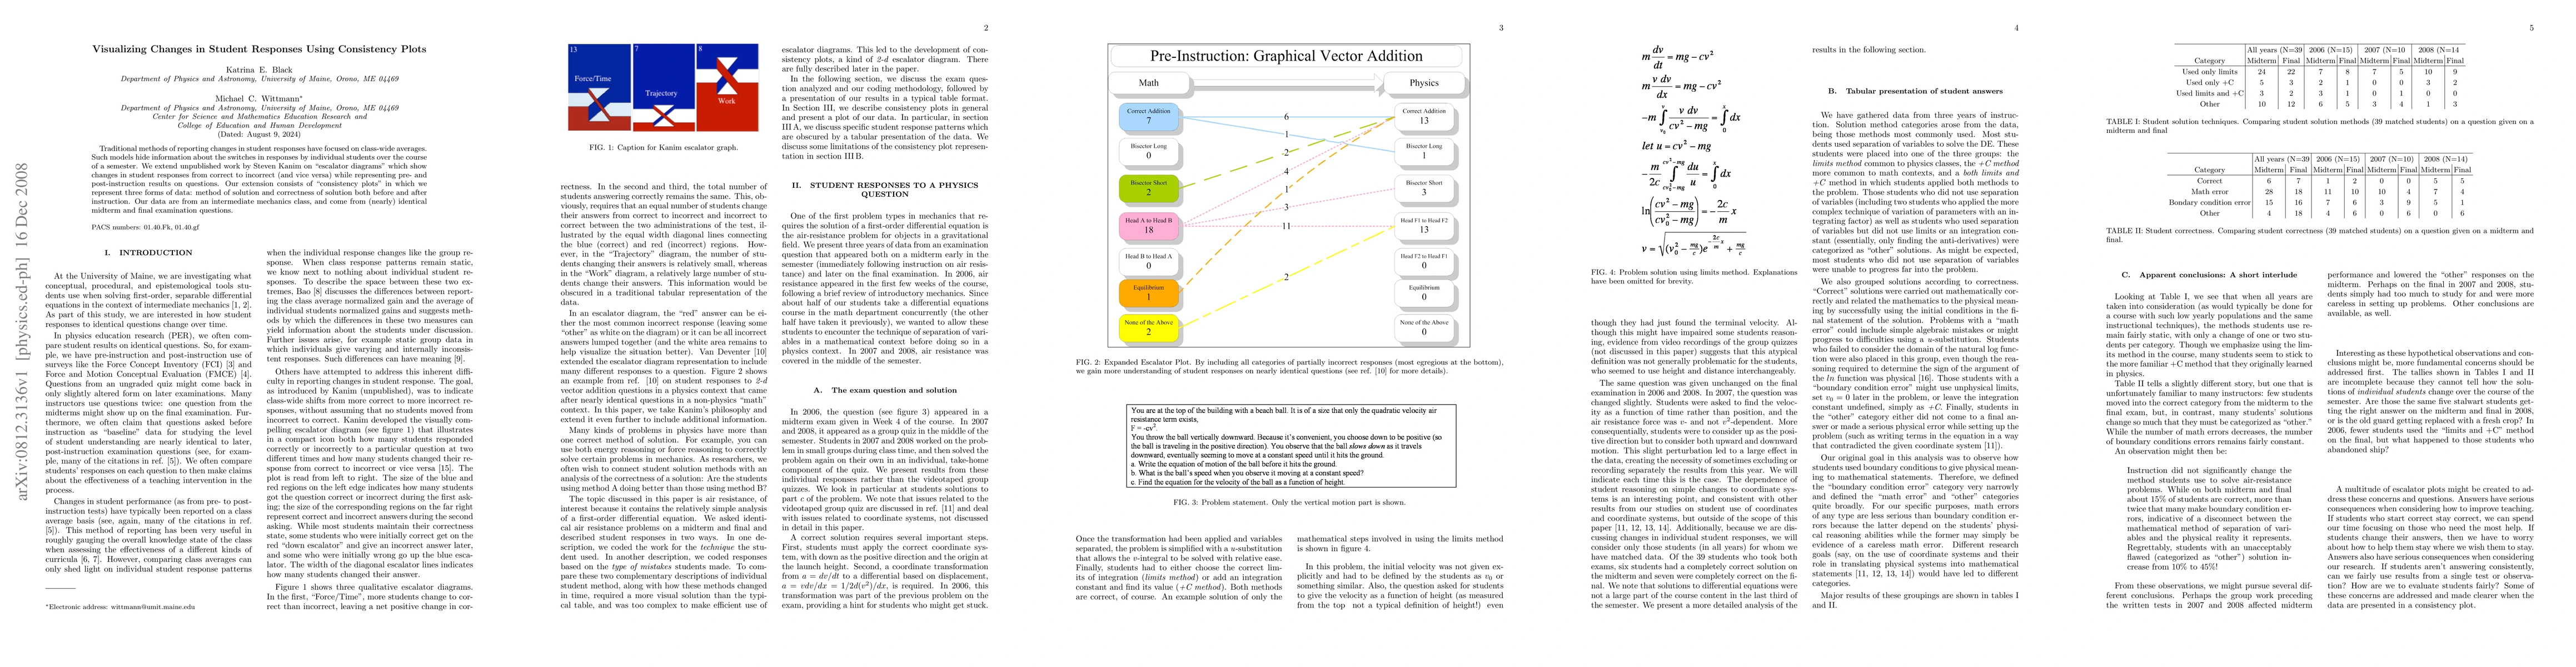
Traditional methods of reporting changes in student responses have focused on class-wide averages. Such models hide information about the switches in responses by individual students over the course of a semester. We extend unpublished work by Steven Kanim on "escalator diagrams" which show changes in student responses from correct to incorrect (and vice versa) while representing pre- and post-instruction results on questions. Our extension consists of "consistency plots" in which we represent three forms of data: method of solution and correctness of solution both before and after instruction. Our data are from an intermediate mechanics class, and come from (nearly) identical midterm and final examination questions.
AI Key Findings
Get AI-generated insights about this paper's methodology, results, significance, and more — seven facets brought into focus.
Impact
Paper Details
PDF Preview
Key Terms
Citation Network
Current paper (gray), citations (green), references (blue)
Display is limited for performance on very large graphs.
Discussion 0