Visualizing Uncertainty in Probabilistic Graphs with Network Hypothetical Outcome Plots (NetHOPs)
Publication
Metrics
AI Quick Summary
The paper introduces NetHOPs, an animated visualization technique for probabilistic graphs that samples network realizations to depict uncertainty. Participants using NetHOPs achieved accurate estimates of network statistics, suggesting it aids in reasoning about uncertain network structures.
Paper Preview
Abstract
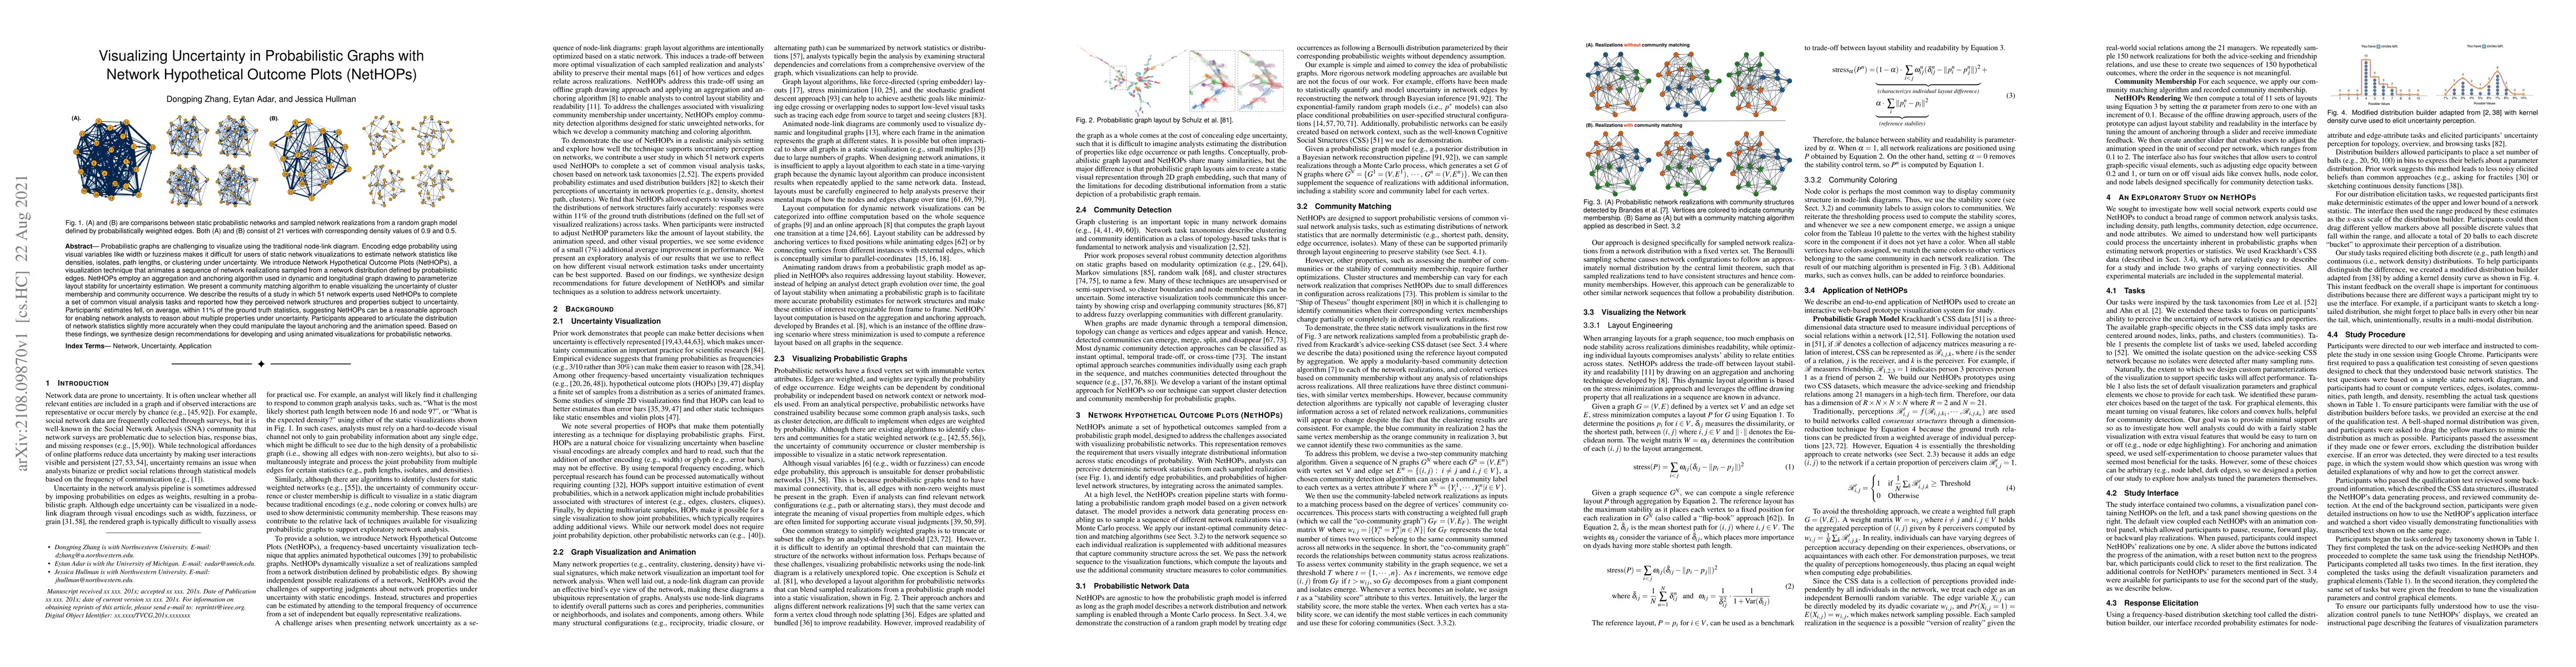
Probabilistic graphs are challenging to visualize using the traditional node-link diagram. Encoding edge probability using visual variables like width or fuzziness makes it difficult for users of static network visualizations to estimate network statistics like densities, isolates, path lengths, or clustering under uncertainty. We introduce Network Hypothetical Outcome Plots (NetHOPs), a visualization technique that animates a sequence of network realizations sampled from a network distribution defined by probabilistic edges. NetHOPs employ an aggregation and anchoring algorithm used in dynamic and longitudinal graph drawing to parameterize layout stability for uncertainty estimation. We present a community matching algorithm to enable visualizing the uncertainty of cluster membership and community occurrence. We describe the results of a study in which 51 network experts used NetHOPs to complete a set of common visual analysis tasks and reported how they perceived network structures and properties subject to uncertainty. Participants' estimates fell, on average, within 11% of the ground truth statistics, suggesting NetHOPs can be a reasonable approach for enabling network analysts to reason about multiple properties under uncertainty. Participants appeared to articulate the distribution of network statistics slightly more accurately when they could manipulate the layout anchoring and the animation speed. Based on these findings, we synthesize design recommendations for developing and using animated visualizations for probabilistic networks.
AI Key Findings
Get AI-generated insights about this paper's methodology, results, significance, and more — seven facets brought into focus.
Impact
Paper Details
Authors
PDF Preview
Key Terms
Citation Network
Current paper (gray), citations (green), references (blue)
Display is limited for performance on very large graphs.
Discussion 0