Visualizing Sensor Network Coverage with Location Uncertainty
Publication
Metrics
AI Quick Summary
This paper introduces an interactive visualization system to explore sensor network coverage with uncertain sensor locations, using topological data analysis to quantify uncertainty in simplicial complex representations.
Paper Preview
Abstract
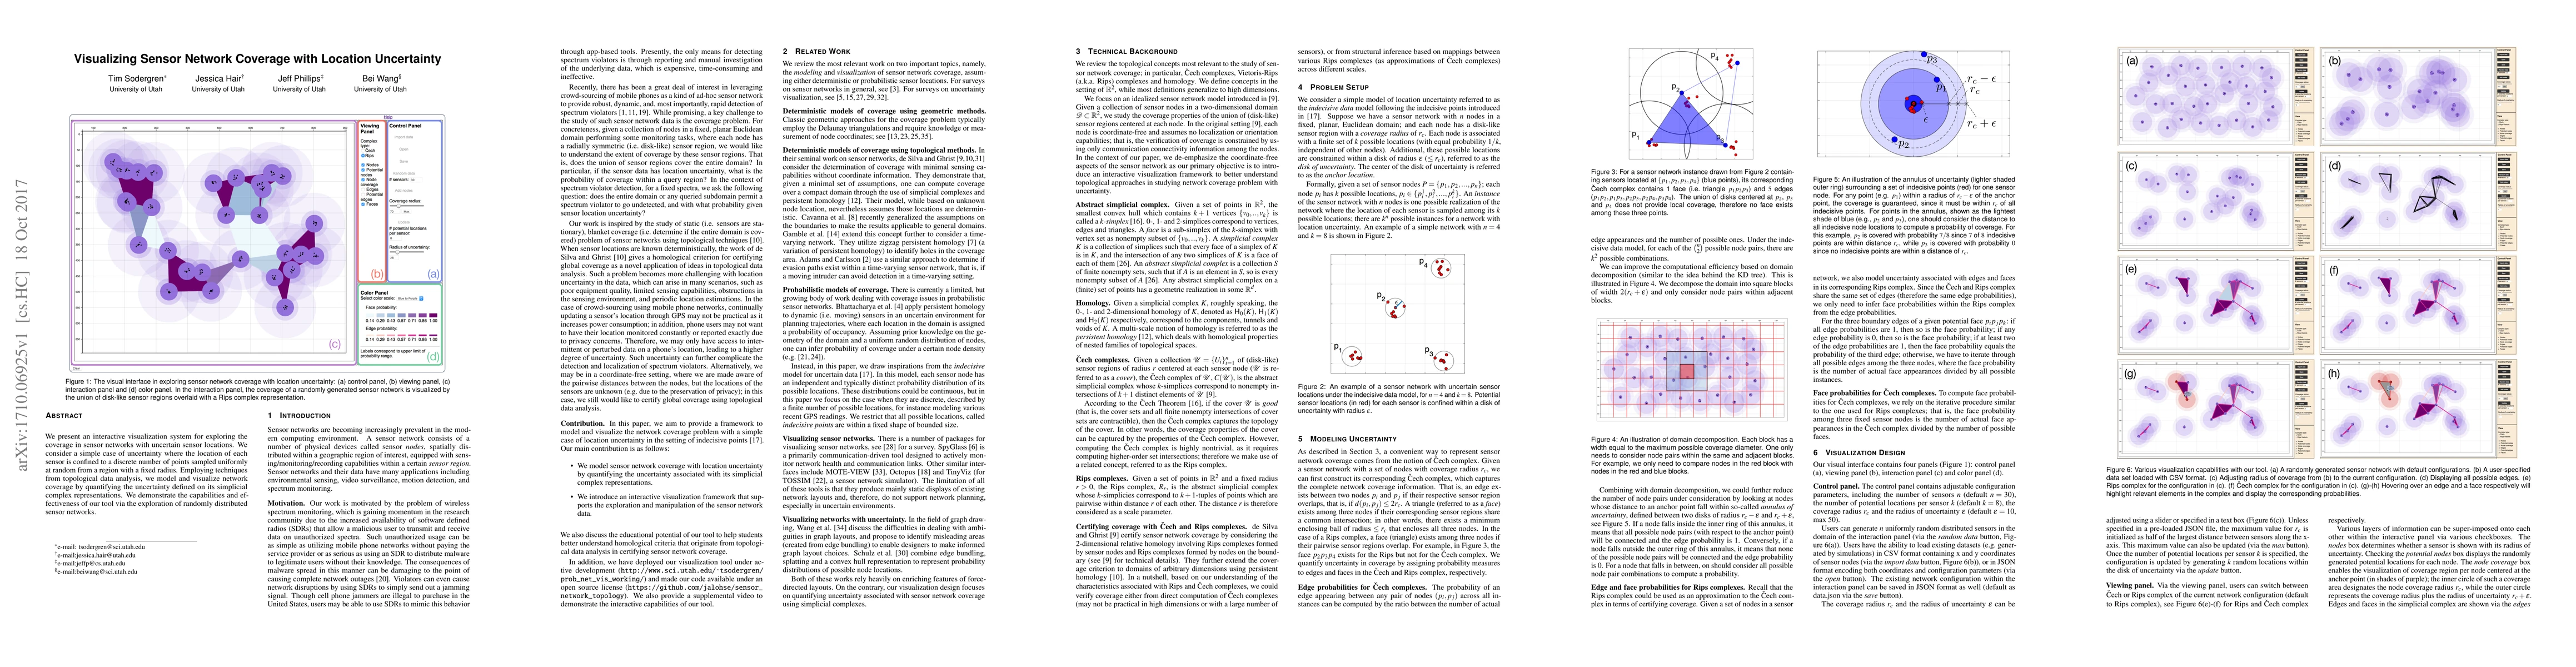
We present an interactive visualization system for exploring the coverage in sensor networks with uncertain sensor locations. We consider a simple case of uncertainty where the location of each sensor is confined to a discrete number of points sampled uniformly at random from a region with a fixed radius. Employing techniques from topological data analysis, we model and visualize network coverage by quantifying the uncertainty defined on its simplicial complex representations. We demonstrate the capabilities and effectiveness of our tool via the exploration of randomly distributed sensor networks.
AI Key Findings
Get AI-generated insights about this paper's methodology, results, significance, and more — seven facets brought into focus.
Impact
Paper Details
PDF Preview
Key Terms
Citation Network
Current paper (gray), citations (green), references (blue)
Display is limited for performance on very large graphs.
Discussion 0