Summary
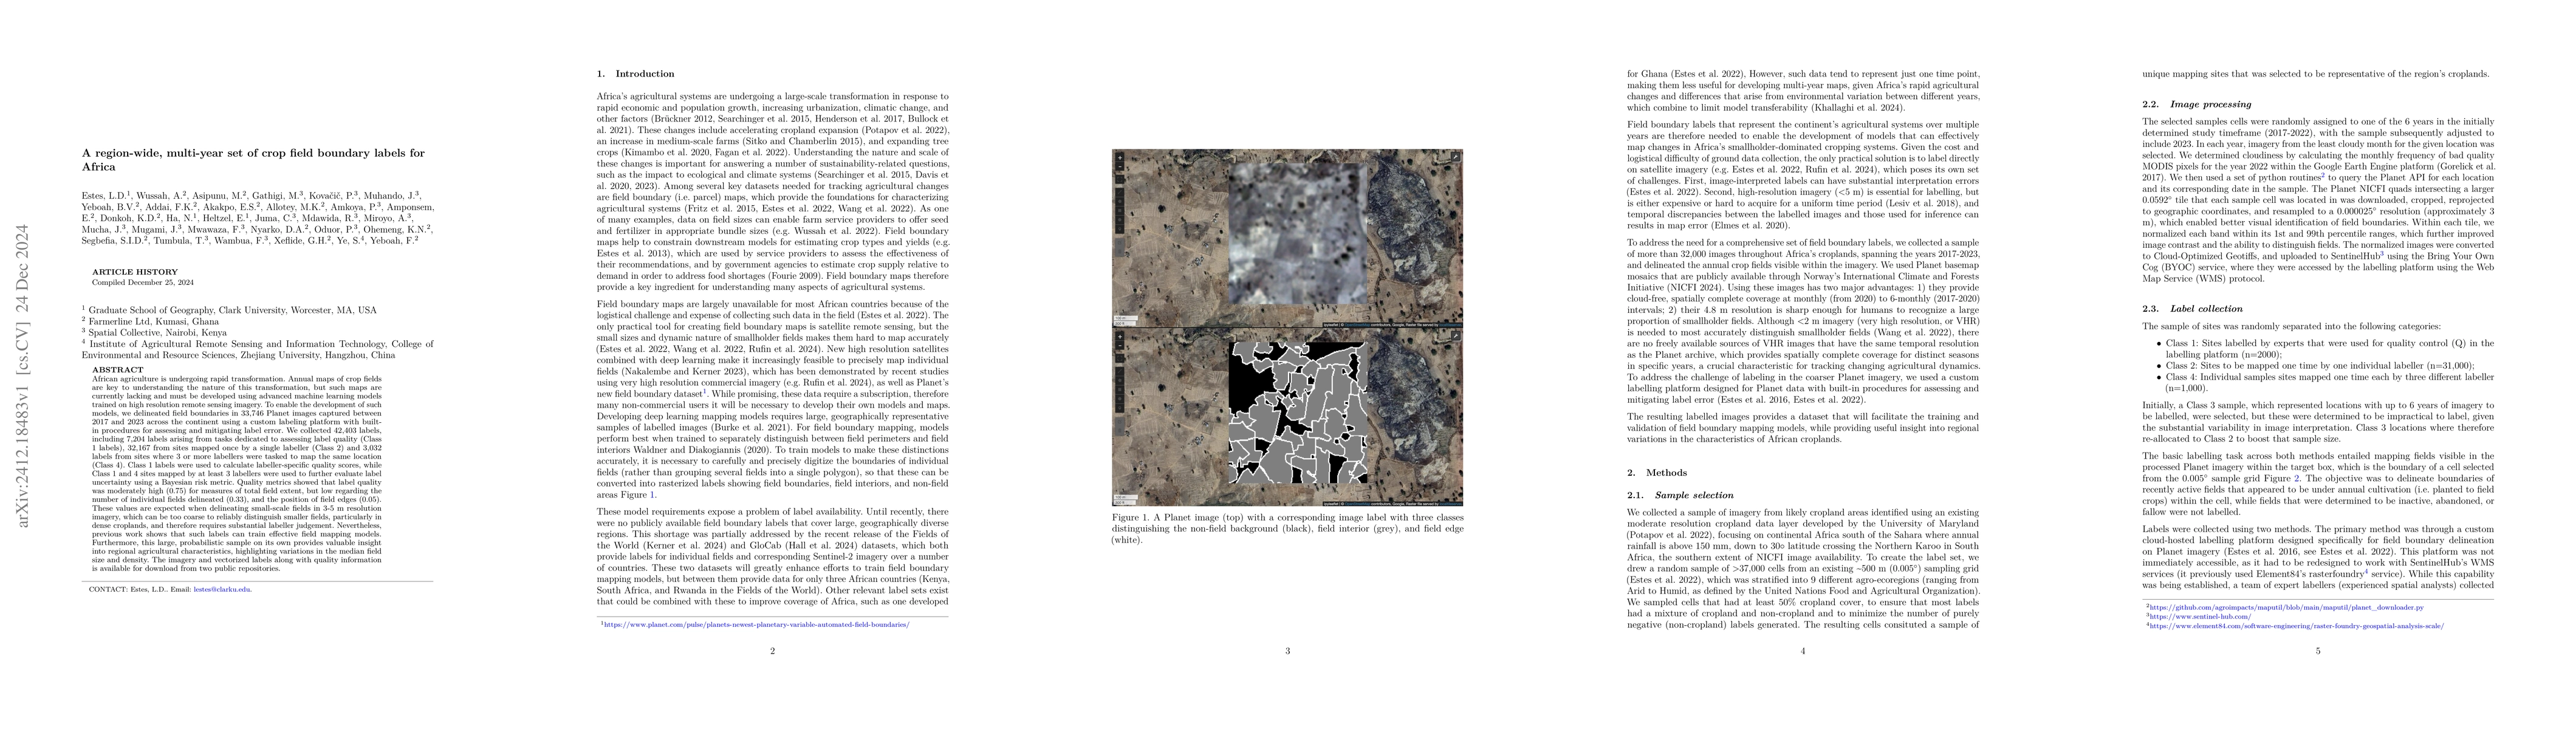
African agriculture is undergoing rapid transformation. Annual maps of crop fields are key to understanding the nature of this transformation, but such maps are currently lacking and must be developed using advanced machine learning models trained on high resolution remote sensing imagery. To enable the development of such models, we delineated field boundaries in 33,746 Planet images captured between 2017 and 2023 across the continent using a custom labeling platform with built-in procedures for assessing and mitigating label error. We collected 42,403 labels, including 7,204 labels arising from tasks dedicated to assessing label quality (Class 1 labels), 32,167 from sites mapped once by a single labeller (Class 2) and 3,032 labels from sites where 3 or more labellers were tasked to map the same location (Class 4). Class 1 labels were used to calculate labeller-specific quality scores, while Class 1 and 4 sites mapped by at least 3 labellers were used to further evaluate label uncertainty using a Bayesian risk metric. Quality metrics showed that label quality was moderately high (0.75) for measures of total field extent, but low regarding the number of individual fields delineated (0.33), and the position of field edges (0.05). These values are expected when delineating small-scale fields in 3-5 m resolution imagery, which can be too coarse to reliably distinguish smaller fields, particularly in dense croplands, and therefore requires substantial labeller judgement. Nevertheless, previous work shows that such labels can train effective field mapping models. Furthermore, this large, probabilistic sample on its own provides valuable insight into regional agricultural characteristics, highlighting variations in the median field size and density. The imagery and vectorized labels along with quality information is available for download from two public repositories.
AI Key Findings
Get AI-generated insights about this paper's methodology, results, and significance.
Paper Details
PDF Preview
Similar Papers
Found 4 papersMulti-Region Transfer Learning for Segmentation of Crop Field Boundaries in Satellite Images with Limited Labels
Hannah Kerner, Saketh Sundar, Mathan Satish
A Sentinel-2 multi-year, multi-country benchmark dataset for crop classification and segmentation with deep learning
Ioannis Papoutsis, Maria Sdraka, Dimitrios Sykas et al.
No citations found for this paper.
Comments (0)