ArxivLens

Quick Summary:

This paper reviews control charts for monitoring multivariate processes with individual observations, categorizing 30 relevant articles and highlighting gaps in research on CUSUM, high-dimensional, and non-parametric methods. It discusses the advantages and limitations of each method and suggests future research directions.

arXiv Id: 1912.09755
Comments: 43 pages, 2 Figures, 9 Tables
Date Published: 2019-12-23
Date Updated: 2019-12-23

Categories:

Key Terms (TF-IDF):

articles (0.308)
covariance (0.283)
articles (0.281)
monitor (0.275)
covariance matrix (0.272)
multivariate (0.269)
multivariate (0.256)
covariance (0.235)
collected (0.233)
control (0.222)
collected (0.215)
control (0.206)
individual (0.201)
literature (0.194)
individual (0.191)
process (0.189)
literature (0.181)
matrix (0.180)
process (0.179)
research (0.173)
License: http://arxiv.org/licenses/nonexclusive-distrib/1.0/

Summary:

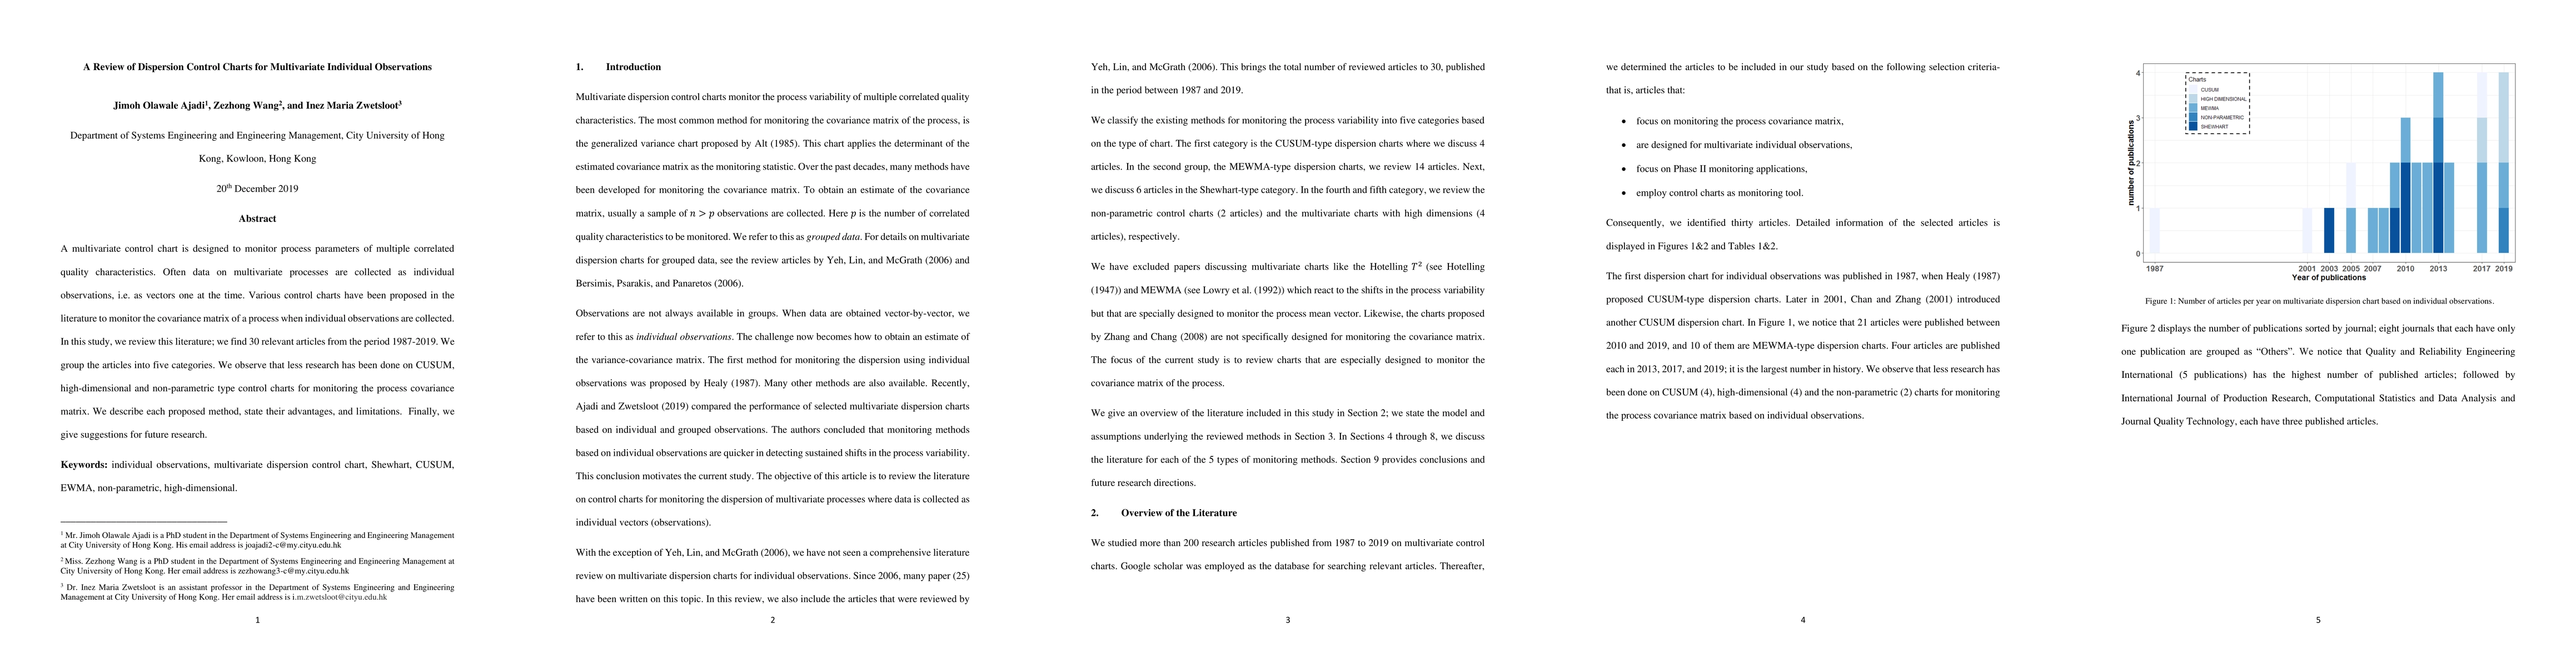
A multivariate control chart is designed to monitor process parameters of multiple correlated quality characteristics. Often data on multivariate processes are collected as individual observations, i.e. as vectors one at the time. Various control charts have been proposed in the literature to monitor the covariance matrix of a process when individual observations are collected. In this study, we review this literature; we find 30 relevant articles from the period 1987-2019. We group the articles into five categories. We observe that less research has been done on CUSUM, high-dimensional and non-parametric type control charts for monitoring the process covariance matrix. We describe each proposed method, state their advantages, and limitations. Finally, we give suggestions for future research.

Citation & Reference Network Visualization

This graph shows how this paper is connected to other research. The current paper is shown in dark gray, papers that cite it are in green, and papers it references are in blue. You can:

Current Paper
Papers citing this work (Citations)
Papers cited by this work (References)

• Hover over any node to see the paper title

• Click a node to view that paper's details

• Drag nodes to rearrange the graph

• Use the zoom controls (bottom right) to zoom in/out

Citations and References

Title Authors Year Actions
Efficient Online Cross‐Covariance Monitoring With Incremental SVD: An Approach for the Detection of Emerging Dependency Patterns in IoT Systems
Xinmiao Luan, Qing Zou, Jian Li, Andi Wang
2025
View Paper
A comparative study on sequential detection of random mean change in multivariate normal data stream
Yanhong Wu, Wei Biao Wu, Dong-Yun Kim
2024
View Paper
Joint risk-based maintenance strategy and integrated monitoring approach for manufacturing system operational process considering workpiece quality
Ruoyu Liao, Yihai He, Min Xie, Haibin Cao, Hanjun Guo, Haiyun Lu, Wei Dai
2024
View Paper
Process Monitoring for Covariance Matrixes with Latent Structures
Qing Zou, Jian Li, Dong Ding, F. Tsung
2024
View Paper
Exponential bounds for regularized Hotelling’s <mml:math xmlns:mml="http://www.w3.org/1998/Math/MathML" display="inline" id="d1e476" altimg="si2.svg"><mml:msubsup><mml:mrow><mml:mi>T</mml:mi></mml:mrow><mml:mrow><mml:mi>n</mml:mi></mml:mrow><mml:mrow><mml:mn>2</mml:mn></mml:mrow></mml:msubsup></mml:
El Mehdi Issouani, P. Bertail, Emmanuelle Gautherat
2024
View Paper
Economic modelling and optimisation of SPRT-based quality control schemes for individual observations
Cheng Li, G. Nenes
2024
View Paper
Detecting outliers in the multivariate control charts for dispersion monitoring
J. Ajadi, I. A. Raji, Nasir Abbas, Muhammad Riaz
2024
View Paper
Adaptive multivariate dispersion control chart with application to bimetal thermostat data
Muhammad Noor-ul-Amin, Muhammad Atif Sarwar, W. Emam, Y. Tashkandy, Uzma Yasmeen, Muhammad Nabi
2023
View Paper
Joint diagnosis of process mean vector and covariance matrix for multivariate statistical process control
Feng Xu, Xiaoqin Deng
2023
View Paper
A control chart based on data depth for monitoring the variability in a multivariate process
M. Barale, D. T. Shirke
2023
View Paper
An efficient adaptive r-MD multivariate single control chart for nonlinear multiple quality characteristics
Arijit Maji, I. Mukherjee
2023
View Paper
Optimizing the quality control of multivariate processes under an improved Mahalanobis–Taguchi system
Yefang Sun, Ijaz Younis, Yueyi Zhang, Huiying Zhou
2022
View Paper
Statistical process monitoring for vector autoregressive time series based on location-scale CUSUM method
Sangjo Lee, Sangyeol Lee
2022
View Paper
Sequential Detection of Common Change in High-dimensional Data Stream
Yanhong Wu, W. Wu
2022
View Paper
Nonparametric multivariate covariance chart for monitoring individual observations
N. Adegoke, J. Ajadi, A. Mukherjee, S. Abbasi
2022
View Paper
A new phase II EWMA dispersion control chart
Su-Fen Yang, B. Arnold, Yen-ling Liu, Ming-Che Lu, Shin-Li Lu
2021
View Paper
A new multivariate CUSUM chart for monitoring of covariance matrix with individual observations under estimated parameter
J. Ajadi, Angus K. Y. Wong, T. Mahmood, Kevin Hung
2021
View Paper
Percentile bootstrap control chart for monitoring process variability under non-normal processes
N. Saeed, S. Kamal, Muhammad Aslam
2021
View Paper
A New Robust Multivariate EWMA Dispersion Control Chart for Individual Observations
J. Ajadi, I. Zwetsloot, K. Tsui
2021
View Paper
Monitoring Road Accidents and Injuries Using Variance Chart under Resampling and Having Indeterminacy
Muhammad Aslam, M. Albassam
2021
View Paper
Should observations be grouped for effective monitoring of multivariate process variability?
J. Ajadi, I. Zwetsloot
2019
View Paper
A Hankel Matrix-Based Multivariate Control Chart With Shrinkage Estimator for Condition Monitoring of Rolling Bearings
Wei Fan, Fan Jiang, Yongxiang Li, Zhike Peng
2025
View Paper
EWMA Control Chart for Rayleigh Process With Engineering Applications
Fuad S. Alduais, Zahid Khan
2023
View Paper

Comments (0)

This website uses cookies to ensure you get the best experience. Learn more