A self-organising eigenspace map for time series clustering
Publication
Metrics
AI Quick Summary
This paper introduces the self-organising eigenspace map (SOEM), a novel clustering method for time series based on the eigenspaces of their covariance structures, showing superior performance compared to standard benchmarks, especially for non-aligned and multivariate time series. The technique also supports forecasting and handles partial time series data effectively.
Paper Preview
Abstract
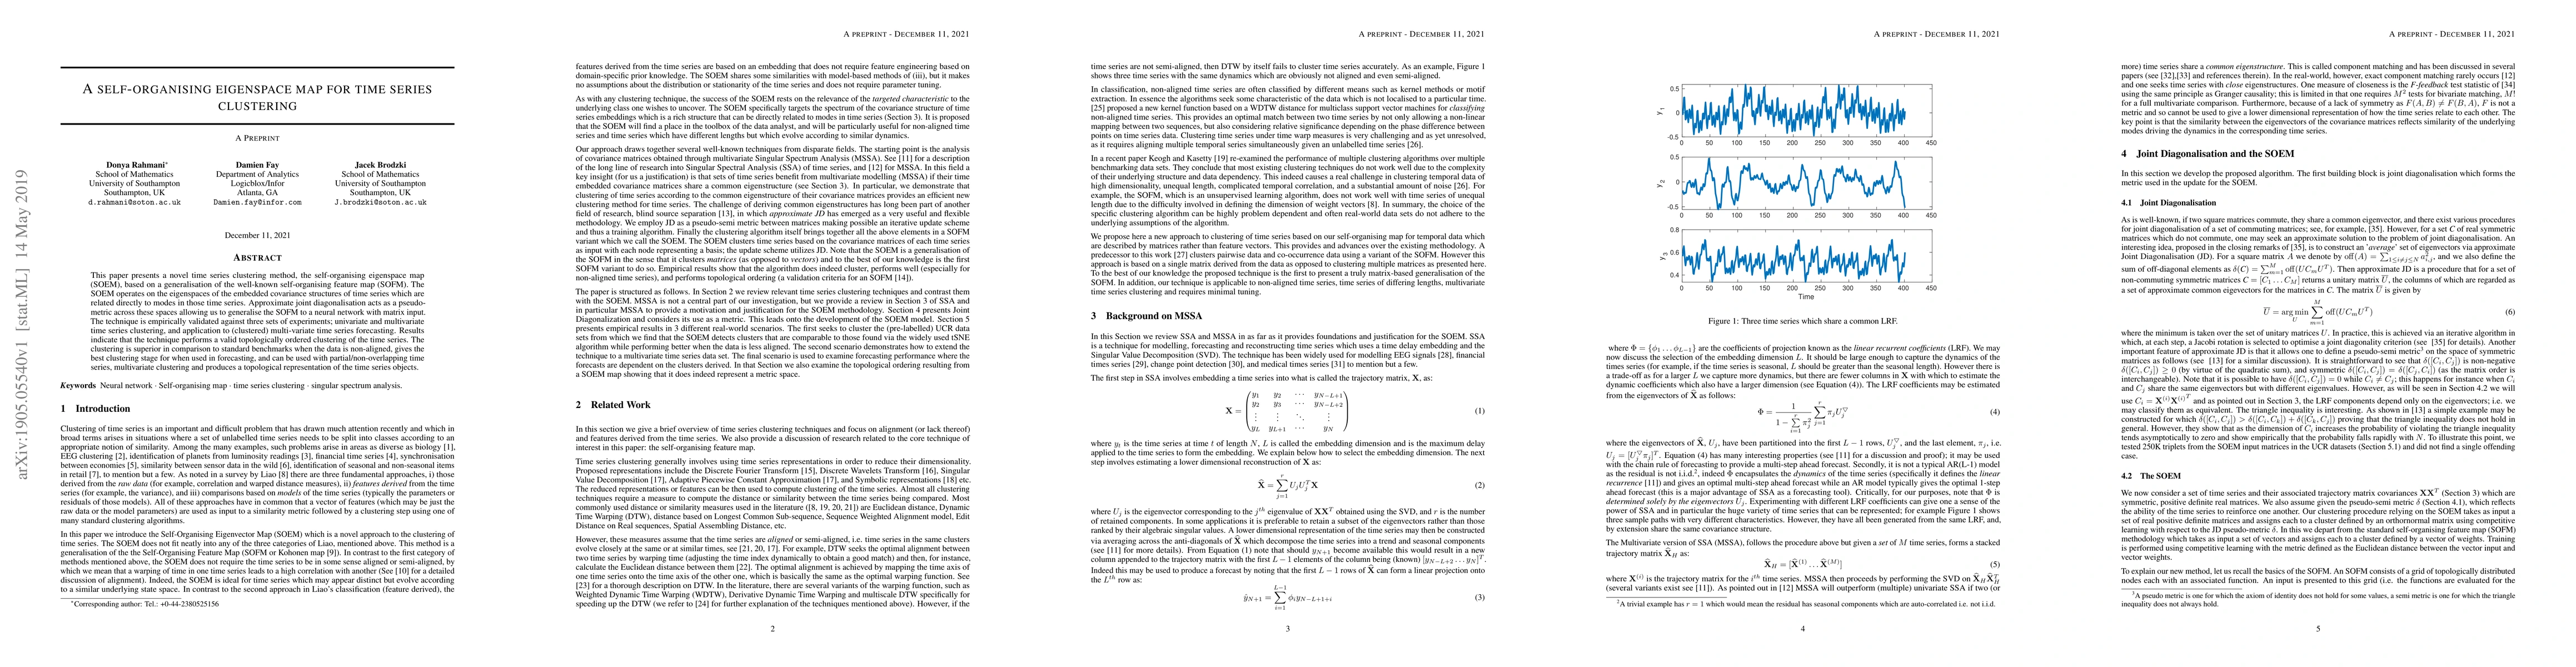
This paper presents a novel time series clustering method, the self-organising eigenspace map (SOEM), based on a generalisation of the well-known self-organising feature map (SOFM). The SOEM operates on the eigenspaces of the embedded covariance structures of time series which are related directly to modes in those time series. Approximate joint diagonalisation acts as a pseudo-metric across these spaces allowing us to generalise the SOFM to a neural network with matrix input. The technique is empirically validated against three sets of experiments; univariate and multivariate time series clustering, and application to (clustered) multi-variate time series forecasting. Results indicate that the technique performs a valid topologically ordered clustering of the time series. The clustering is superior in comparison to standard benchmarks when the data is non-aligned, gives the best clustering stage for when used in forecasting, and can be used with partial/non-overlapping time series, multivariate clustering and produces a topological representation of the time series objects.
AI Key Findings
Get AI-generated insights about this paper's methodology, results, significance, and more — seven facets brought into focus.
Impact
Paper Details
PDF Preview
Key Terms
Citation Network
Current paper (gray), citations (green), references (blue)
Display is limited for performance on very large graphs.
Discussion 0