Visualizing Random Forest with Self-Organising Map
Publication
Metrics
AI Quick Summary
This paper proposes a novel method using Self-Organising Maps (SOM) to visualize and better understand the internal relationships within a Random Forest (RF) model. The SOM-based visualization, compared to Multidimensional Scaling (MDS), shows improved classification accuracy, enhancing both interpretability and performance of the RF model.
Paper Preview
Abstract
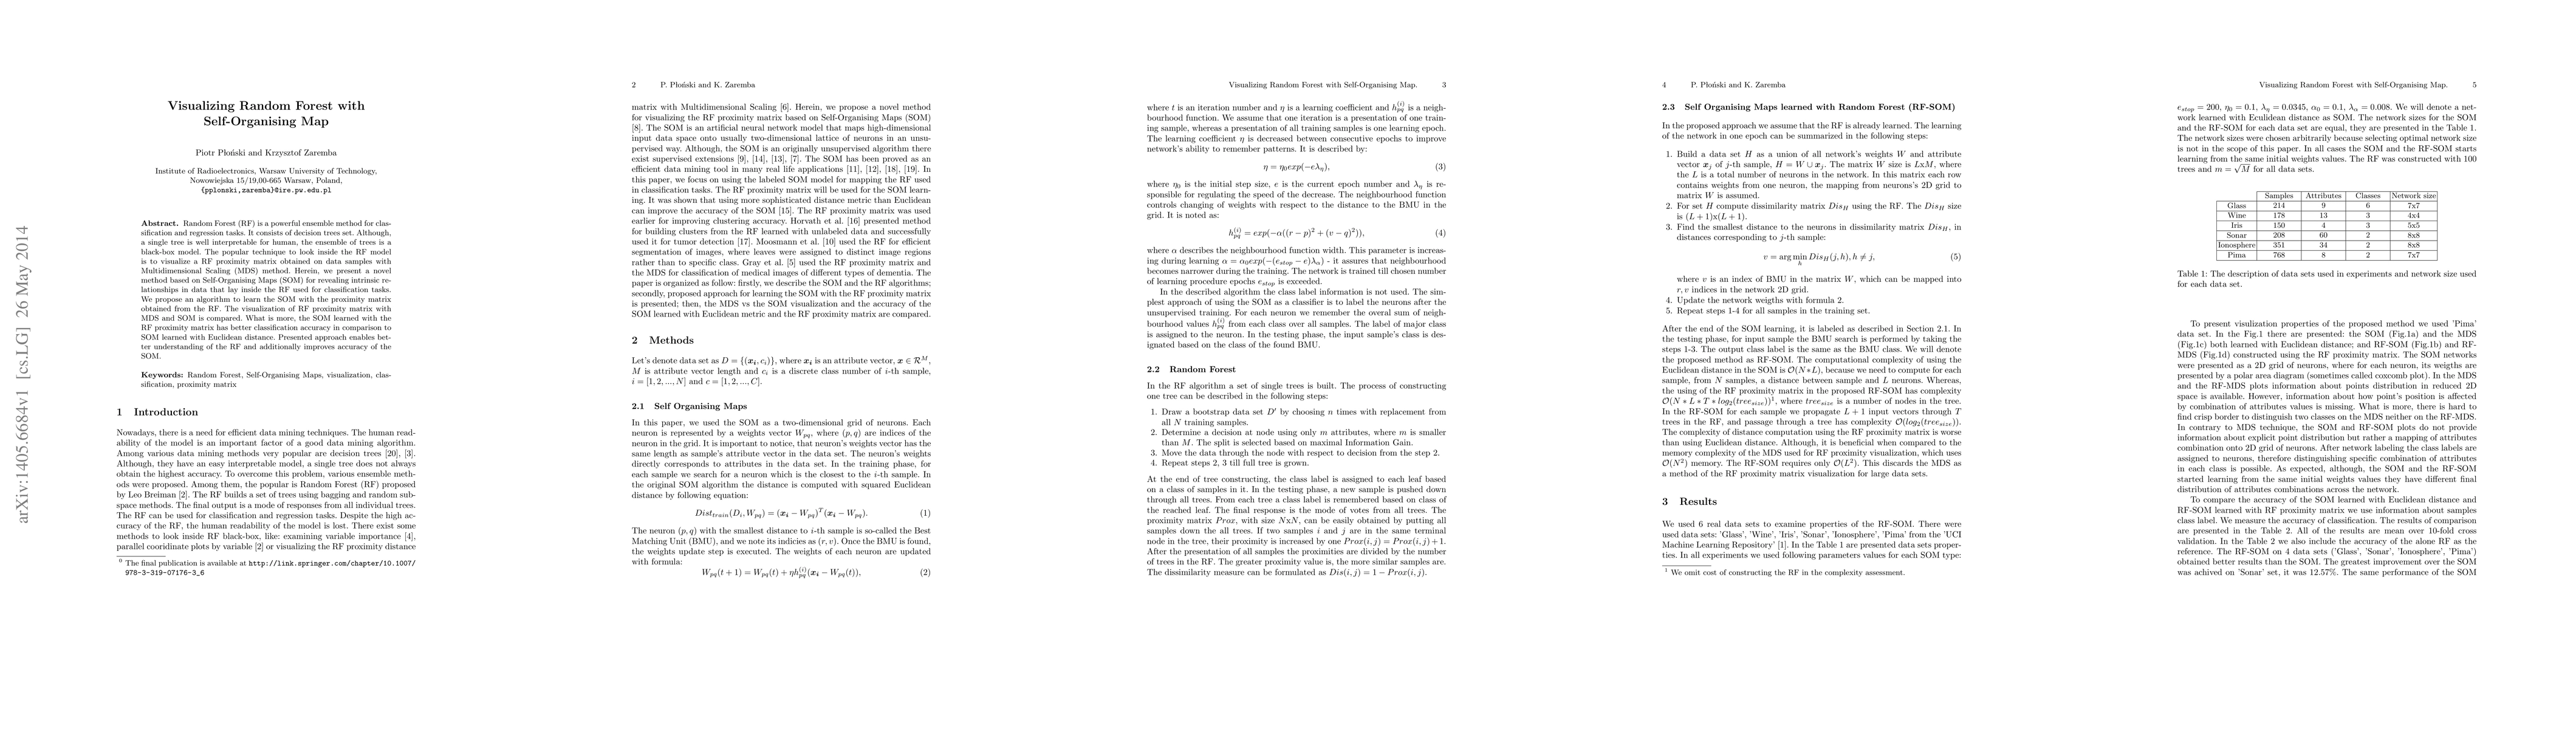
Random Forest (RF) is a powerful ensemble method for classification and regression tasks. It consists of decision trees set. Although, a single tree is well interpretable for human, the ensemble of trees is a black-box model. The popular technique to look inside the RF model is to visualize a RF proximity matrix obtained on data samples with Multidimensional Scaling (MDS) method. Herein, we present a novel method based on Self-Organising Maps (SOM) for revealing intrinsic relationships in data that lay inside the RF used for classification tasks. We propose an algorithm to learn the SOM with the proximity matrix obtained from the RF. The visualization of RF proximity matrix with MDS and SOM is compared. What is more, the SOM learned with the RF proximity matrix has better classification accuracy in comparison to SOM learned with Euclidean distance. Presented approach enables better understanding of the RF and additionally improves accuracy of the SOM.
AI Key Findings
Get AI-generated insights about this paper's methodology, results, significance, and more — seven facets brought into focus.
Impact
Paper Details
PDF Preview
Key Terms
Citation Network
Current paper (gray), citations (green), references (blue)
Display is limited for performance on very large graphs.
Discussion 0