A Single Visualization Technique for Displaying Multiple Metabolite-Phenotype Associations
Publication
Metrics
Paper Preview
Abstract
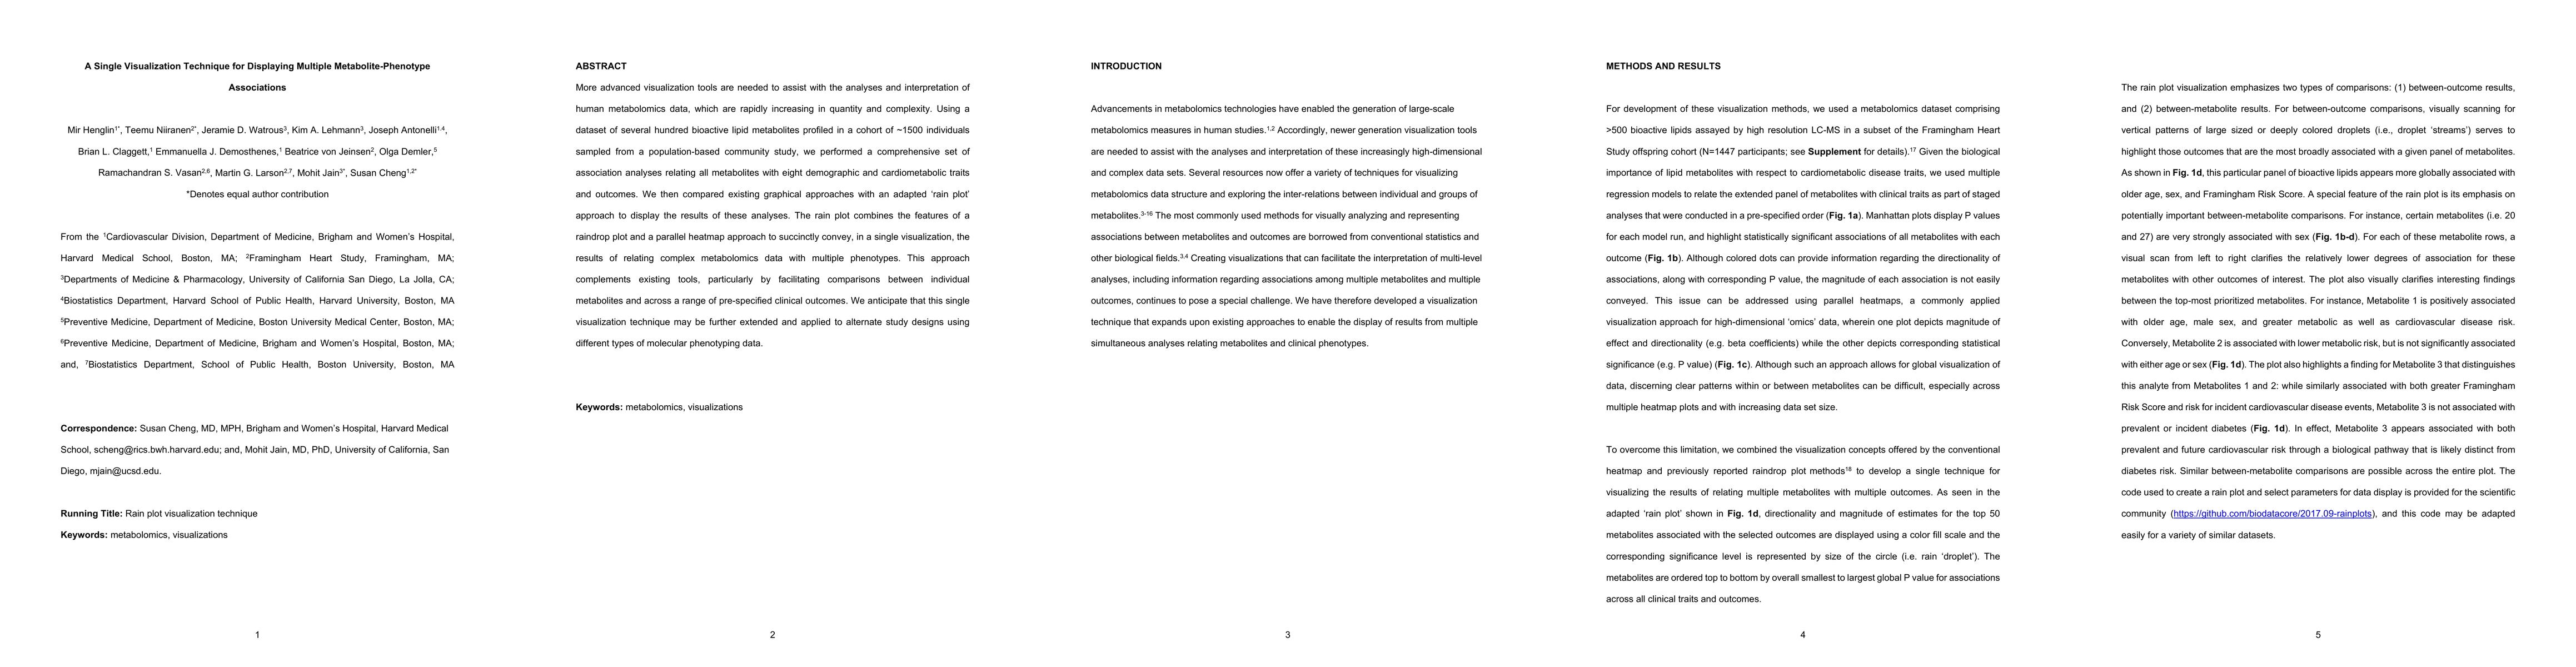
More advanced visualization tools are needed to assist with the analyses and interpretation of human metabolomics data, which are rapidly increasing in quantity and complexity. Using a dataset of several hundred bioactive lipid metabolites profiled in a cohort of over 1400 individuals sampled from a population-based community study, we performed a comprehensive set of association analyses relating all metabolites with eight demographic and cardiometabolic traits and outcomes. We then compared existing graphical approaches with an adapted rain plot approach to display the results of these analyses. The rain plot combines the features of a raindrop plot and a parallel heatmap approach to succinctly convey, in a single visualization, the results of relating complex metabolomics data with multiple phenotypes. This approach complements existing tools, particularly by facilitating comparisons between individual metabolites and across a range of pre-specified clinical outcomes. We anticipate that this single visualization technique may be further extended and applied to alternate study designs using different types of molecular phenotyping data.
AI Key Findings
Get AI-generated insights about this paper's methodology, results, significance, and more — seven facets brought into focus.
Impact
Paper Details
PDF Preview
Key Terms
Citation Network
Current paper (gray), citations (green), references (blue)
Display is limited for performance on very large graphs.
Discussion 0